Estimated zip code population in 2022: 41,403 Zip code population in 2010: 35,850 Zip code population in 2000: 31,923
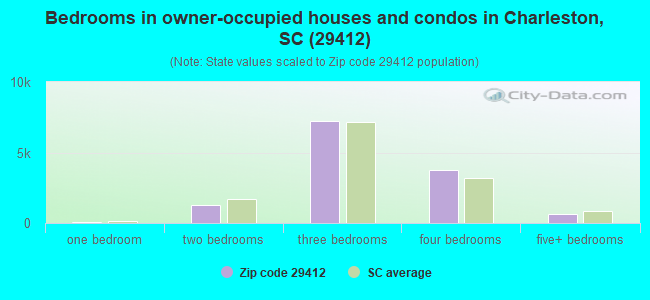
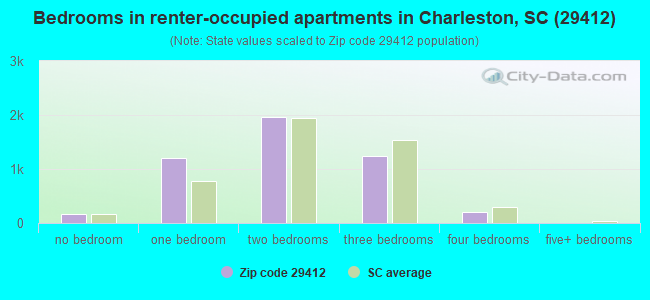
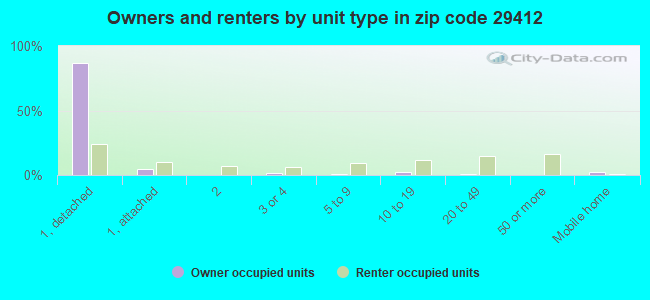
Houses and condos: 19,250 Renter-occupied apartments: 4,749
% of renters here:
27%
State:
28%
March 2022 cost of living index in zip code 29412: 94.8 (less than average, U.S. average is 100)
Land area: 39.2 sq. mi. Water area: 12.3 sq. mi.
Population density: 1,055 people per square mile
(low).
OSM Map
General Map
Google Map
MSN Map
OSM Map
General Map
Google Map
MSN Map
OSM Map
General Map
Google Map
MSN Map
OSM Map
General Map
Google Map
MSN Map
Please wait while loading the map...
Real estate property taxes paid for housing units in 2022:
This zip code:
0.4% ($1,925)
South Carolina:
0.5% ($1,185)
Median real estate property taxes paid for housing units with mortgages in 2022: $1,981 (0.4%) Median real estate property taxes paid for housing units with no mortgage in 2022: $1,668 (0.4%)
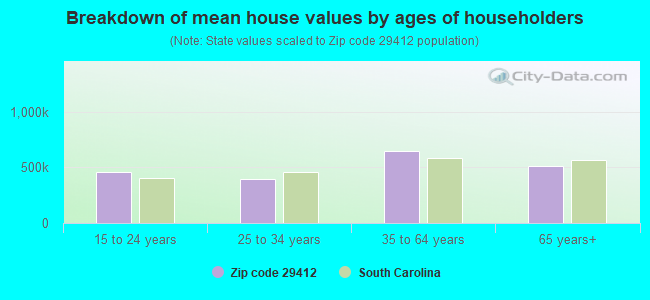
Estimated median house/condo value in 2022: $502,841
29412:
$502,841
South Carolina:
$254,600
According to our research of South Carolina and other state lists, there were 6 registered sex offenders living in 29412 zip code as of April 24, 2024. The ratio of all residents to sex offenders in zip code 29412 is 6,667 to 1. The ratio of registered sex offenders to all residents in this zip code is much lower than the state average.
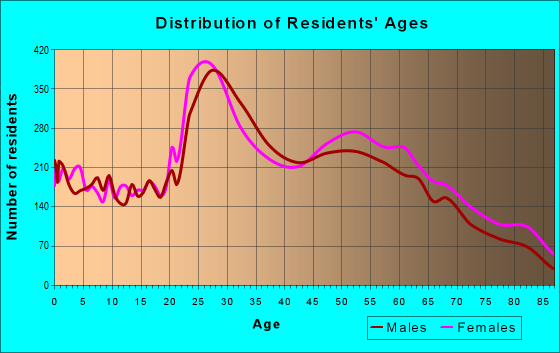
Median resident age:
This zip code:
40.8 years
South Carolina median age:
40.5 years
Average household size:
This zip code:
2.3 people
South Carolina:
2.4 people
Averages for the 2020 tax year for zip code 29412, filed in 2021:
Average Adjusted Gross Income (AGI) in 2020: $96,417 (Individual Income Tax Returns)
Here:
$96,417
State:
$65,754
Salary/wage: $72,867 (reported on 79.5% of returns)
Here:
$72,867
State:
$52,566
(% of AGI for various income ranges: 1230.2% for AGIs below $25k, 3839.7% for AGIs $25k-50k, 6912.1% for AGIs $50k-75k, 10060.7% for AGIs $75k-100k, 20240.2% for AGIs $100k-200k, 87636.1% for AGIs over 200k)
Taxable interest for individuals: $2,172 (reported on 32.6% of returns)
This zip code:
$2,172
South Carolina:
$1,749
(% of AGI for various income ranges: 16.9% for AGIs below $25k, 27.8% for AGIs $25k-50k, 54.1% for AGIs $50k-75k, 74.2% for AGIs $75k-100k, 135.6% for AGIs $100k-200k, 1885.0% for AGIs over 200k)
Ordinary dividends: $12,111 (reported on 28.8% of returns)
Here:
$12,111
State:
$8,783
(% of AGI for various income ranges: 52.5% for AGIs below $25k, 81.8% for AGIs $25k-50k, 172.5% for AGIs $50k-75k, 382.7% for AGIs $75k-100k, 723.8% for AGIs $100k-200k, 10081.7% for AGIs over 200k)
Net capital gain/loss in AGI: +$38,241 (reported on 26.1% of returns)
Here:
+$38,241
State:
+$24,194
(% of AGI for various income ranges: 26.4% for AGIs below $25k, 51.4% for AGIs $25k-50k, 163.4% for AGIs $50k-75k, 343.4% for AGIs $75k-100k, 843.0% for AGIs $100k-200k, 39219.6% for AGIs over 200k)
Profit/loss from business: +$20,630 (reported on 20.6% of returns)
Here:
+$20,630
State:
+$11,253
(% of AGI for various income ranges: 188.5% for AGIs below $25k, 260.3% for AGIs $25k-50k, 382.3% for AGIs $50k-75k, 574.5% for AGIs $75k-100k, 1227.9% for AGIs $100k-200k, 7741.3% for AGIs over 200k)
Taxable individual retirement arrangement distribution: $22,803 (reported on 9.7% of returns)
29412:
$22,803
South Carolina:
$21,604
(% of AGI for various income ranges: 50.8% for AGIs below $25k, 101.4% for AGIs $25k-50k, 211.9% for AGIs $50k-75k, 488.6% for AGIs $75k-100k, 838.6% for AGIs $100k-200k, 3314.1% for AGIs over 200k)
Self-employed (Keogh) retirement plans: $23,129 (reported on 1.2% of returns)
29412:
$23,129
South Carolina:
$25,038
(% of AGI for various income ranges: 26.0% for AGIs $50k-75k, 66.2% for AGIs $100k-200k, 839.1% for AGIs over 200k)
Total itemized deductions: $36,699 (reported on 15.0% of returns)
Here:
$36,699
State:
$35,199
(% of AGI for various income ranges: 91.0% for AGIs below $25k, 174.8% for AGIs $25k-50k, 474.6% for AGIs $50k-75k, 892.4% for AGIs $75k-100k, 1636.5% for AGIs $100k-200k, 11991.3% for AGIs over 200k)
Charity contributions: $14,210 (reported on 11.7% of returns)
Here:
$14,210
State:
$14,319
(% of AGI for various income ranges: 6.1% for AGIs below $25k, 19.7% for AGIs $25k-50k, 49.2% for AGIs $50k-75k, 129.6% for AGIs $75k-100k, 261.0% for AGIs $100k-200k, 5700.0% for AGIs over 200k)
Taxes paid: $7,801 (reported on 14.9% of returns)
29412:
$7,801
State:
$7,486
(% of AGI for various income ranges: 12.6% for AGIs below $25k, 30.1% for AGIs $25k-50k, 110.9% for AGIs $50k-75k, 239.6% for AGIs $75k-100k, 482.0% for AGIs $100k-200k, 1930.4% for AGIs over 200k)
Earned income credit: $1,832 (reported on 10.0% of returns)
Here:
$1,832
State:
$2,397
(% of AGI for various income ranges: 71.4% for AGIs below $25k, 36.5% for AGIs $25k-50k, 0.6% for AGIs $50k-75k)
Percentage of individuals using paid preparers for their 2020 taxes: 92.7%
Here:
93%
State:
93%
(% for various income ranges: 90.4% for AGIs below $25k, 92.7% for AGIs $25k-50k, 93.3% for AGIs $50k-75k, 93.7% for AGIs $75k-100k, 93.5% for AGIs $100k-200k, 95.5% for AGIs over 200k)
Averages for the 2012 tax year for zip code 29412, filed in 2013:
Average Adjusted Gross Income (AGI) in 2012: $61,210 (Individual Income Tax Returns)
Here:
$61,210
State:
$51,133
Salary/wage: $49,910 (reported on 82.3% of returns)
Here:
$49,910
State:
$42,173
(% of AGI for various income ranges: 77.6% for AGIs below $25k, 79.1% for AGIs $25k-50k, 73.0% for AGIs $50k-75k, 74.5% for AGIs $75k-100k, 70.7% for AGIs $100k-200k, 45.7% for AGIs over 200k)
Taxable interest for individuals: $1,414 (reported on 34.0% of returns)
This zip code:
$1,414
South Carolina:
$1,468
(% of AGI for various income ranges: 0.8% for AGIs below $25k, 0.5% for AGIs $25k-50k, 0.7% for AGIs $50k-75k, 0.7% for AGIs $75k-100k, 0.7% for AGIs $100k-200k, 1.2% for AGIs over 200k)
Ordinary dividends: $7,348 (reported on 25.4% of returns)
Here:
$7,348
State:
$6,511
(% of AGI for various income ranges: 2.0% for AGIs below $25k, 1.5% for AGIs $25k-50k, 2.1% for AGIs $50k-75k, 1.9% for AGIs $75k-100k, 2.4% for AGIs $100k-200k, 6.1% for AGIs over 200k)
Net capital gain/loss in AGI: +$14,645 (reported on 19.4% of returns)
Here:
+$14,645
State:
+$13,061
(% of AGI for various income ranges: 0.3% for AGIs $25k-50k, 0.6% for AGIs $50k-75k, 0.9% for AGIs $75k-100k, 1.8% for AGIs $100k-200k, 16.1% for AGIs over 200k)
Profit/loss from business: +$13,462 (reported on 17.9% of returns)
Here:
+$13,462
State:
+$10,167
(% of AGI for various income ranges: 7.6% for AGIs below $25k, 3.5% for AGIs $25k-50k, 3.5% for AGIs $50k-75k, 3.6% for AGIs $75k-100k, 3.5% for AGIs $100k-200k, 4.0% for AGIs over 200k)
Taxable individual retirement arrangement distribution: $16,861 (reported on 10.3% of returns)
29412:
$16,861
South Carolina:
$17,019
(% of AGI for various income ranges: 2.3% for AGIs below $25k, 1.9% for AGIs $25k-50k, 2.8% for AGIs $50k-75k, 2.2% for AGIs $75k-100k, 3.6% for AGIs $100k-200k, 3.1% for AGIs over 200k)
Self-employment retirement plans: $18,477 (reported on 0.7% of returns)
29412:
$18,477
South Carolina:
$21,023
(% of AGI for various income ranges: 0.2% for AGIs $50k-75k, 0.2% for AGIs $100k-200k, 0.5% for AGIs over 200k)
Total itemized deductions: $23,044 (21% of AGI, reported on 38.2% of returns)
Here:
$23,044
State:
$22,890
Here:
20.9% of AGI
State:
21.4% of AGI
(% of AGI for various income ranges: 10.9% for AGIs below $25k, 11.1% for AGIs $25k-50k, 15.4% for AGIs $50k-75k, 16.8% for AGIs $75k-100k, 16.4% for AGIs $100k-200k, 13.4% for AGIs over 200k)
Charity contributions: $4,083 (reported on 32.0% of returns)
Here:
$4,083
State:
$5,169
(% of AGI for various income ranges: 1.0% for AGIs below $25k, 1.2% for AGIs $25k-50k, 1.8% for AGIs $50k-75k, 2.1% for AGIs $75k-100k, 2.3% for AGIs $100k-200k, 3.1% for AGIs over 200k)
Taxes paid: $7,752 (reported on 38.2% of returns)
29412:
$7,752
State:
$7,644
(% of AGI for various income ranges: 1.9% for AGIs below $25k, 2.4% for AGIs $25k-50k, 4.1% for AGIs $50k-75k, 5.1% for AGIs $75k-100k, 6.2% for AGIs $100k-200k, 6.1% for AGIs over 200k)
Earned income credit: $1,845 (reported on 13.5% of returns)
Here:
$1,845
State:
$2,418
(% of AGI for various income ranges: 4.4% for AGIs below $25k, 0.5% for AGIs $25k-50k)
Percentage of individuals using paid preparers for their 2012 taxes: 50.2%
Here:
50%
State:
57%
(% for various income ranges: 46.1% for AGIs below $25k, 43.9% for AGIs $25k-50k, 52.1% for AGIs $50k-75k, 55.0% for AGIs $75k-100k, 60.3% for AGIs $100k-200k, 80.6% for AGIs over 200k)
Averages for the 2004 tax year for zip code 29412, filed in 2005:
Average Adjusted Gross Income (AGI) in 2004: $47,675 (Individual Income Tax Returns)
Here:
$47,675
State:
$41,965
Salary/wage: $39,817 (reported on 82.8% of returns)
Here:
$39,817
State:
$35,695
(% of AGI for various income ranges: 134.5% for AGIs below $10k, 77.3% for AGIs $10k-25k, 77.4% for AGIs $25k-50k, 75.6% for AGIs $50k-75k, 76.8% for AGIs $75k-100k, 55.3% for AGIs over 100k)
Taxable interest for individuals: $1,516 (reported on 45.0% of returns)
This zip code:
$1,516
South Carolina:
$1,623
(% of AGI for various income ranges: 5.5% for AGIs below $10k, 1.9% for AGIs $10k-25k, 1.4% for AGIs $25k-50k, 1.2% for AGIs $50k-75k, 1.4% for AGIs $75k-100k, 1.3% for AGIs over 100k)
Taxable dividends: $4,380 (reported on 28.2% of returns)
Here:
$4,380
State:
$3,999
(% of AGI for various income ranges: 5.4% for AGIs below $10k, 1.8% for AGIs $10k-25k, 1.5% for AGIs $25k-50k, 1.8% for AGIs $50k-75k, 2.0% for AGIs $75k-100k, 3.8% for AGIs over 100k)
Net capital gain/loss: +$11,222 (reported on 22.0% of returns)
Here:
+$11,222
State:
+$13,100
(% of AGI for various income ranges: -1.0% for AGIs below $10k, 0.4% for AGIs $10k-25k, 0.6% for AGIs $25k-50k, 1.2% for AGIs $50k-75k, 1.9% for AGIs $75k-100k, 11.7% for AGIs over 100k)
Profit/loss from business: +$14,646 (reported on 16.5% of returns)
Here:
+$14,646
State:
+$9,144
(% of AGI for various income ranges: 3.5% for AGIs below $10k, 5.0% for AGIs $10k-25k, 3.6% for AGIs $25k-50k, 3.5% for AGIs $50k-75k, 3.6% for AGIs $75k-100k, 7.1% for AGIs over 100k)
IRA payment deduction: $2,767 (reported on 2.6% of returns)
29412:
$2,767
South Carolina:
$2,972
(% of AGI for various income ranges: 0.4% for AGIs below $10k, 0.2% for AGIs $10k-25k, 0.2% for AGIs $25k-50k, 0.2% for AGIs $50k-75k, 0.1% for AGIs $75k-100k, 0.1% for AGIs over 100k)
Self-employed pension: $15,246 (reported on 1.1% of returns)
Here:
$15,246
South Carolina:
$15,117
(% of AGI for various income ranges: 0.5% for AGIs below $10k, 0.1% for AGIs $25k-50k, 0.1% for AGIs $50k-75k, 0.3% for AGIs $75k-100k, 0.8% for AGIs over 100k)
Total itemized deductions: $18,938 (23% of AGI, reported on 41.1% of returns)
Here:
$18,938
State:
$19,039
Here:
22.7% of AGI
State:
22.8% of AGI
(% of AGI for various income ranges: 19.9% for AGIs below $10k, 11.6% for AGIs $10k-25k, 15.5% for AGIs $25k-50k, 18.8% for AGIs $50k-75k, 19.4% for AGIs $75k-100k, 15.5% for AGIs over 100k)
Charity contributions deductions: $3,452 (4% of AGI, reported on 36.5% of returns)
Here:
$3,452
State:
$4,305
Here:
4.0% of AGI
State:
5.0% of AGI
(% of AGI for various income ranges: 1.0% for AGIs below $10k, 1.4% for AGIs $10k-25k, 2.0% for AGIs $25k-50k, 2.7% for AGIs $50k-75k, 2.9% for AGIs $75k-100k, 3.2% for AGIs over 100k)
Total tax: $7,462 (reported on 77.8% of returns)
29412:
$7,462
State:
$6,497
(% of AGI for various income ranges: 3.7% for AGIs below $10k, 4.5% for AGIs $10k-25k, 7.7% for AGIs $25k-50k, 9.4% for AGIs $50k-75k, 10.5% for AGIs $75k-100k, 18.3% for AGIs over 100k)
Earned income credit: $1,613 (reported on 12.8% of returns)
Here:
$1,613
State:
$1,882
Percentage of individuals using paid preparers for their 2004 taxes: 56.8%
Here:
57%
State:
66%
(% for various income ranges: 50.2% for AGIs below $10k, 56.9% for AGIs $10k-25k, 54.4% for AGIs $25k-50k, 60.1% for AGIs $50k-75k, 57.9% for AGIs $75k-100k, 71.1% for AGIs over 100k)
Likely homosexual households (counted as self-reported same-sex unmarried-partner households)
Lesbian couples: 0.3% of all households
Gay men: 0.0% of all households
Household received Food Stamps/SNAP in the past 12 months: 577 Household did not receive Food Stamps/SNAP in the past 12 months: 17,099
Women who had a birth in the past 12 months: 399 (248 now married, 151 unmarried) Women who did not have a birth in the past 12 months: 10,295 (4,877 now married, 5,437 unmarried)
Housing units in zip code 29412 with a mortgage: 8,867 (1,466 second mortgage, 1,229 both second mortgage and home equity loan) Houses without a mortgage: 214
Median monthly owner costs for units with a mortgage: $2,087 Median monthly owner costs for units without a mortgage: $591
Residents with income below the poverty level in 2022:
This zip code:
6.9%
Whole state:
14.0%
Residents with income below 50% of the poverty level in 2022:
This zip code:
3.4%
Whole state:
7.3%
Median number of rooms in houses and condos:
Here:
6.6
State:
6.4
Median number of rooms in apartments:
Here:
4.6
State:
4.5
Notable locations in this zip code not listed on our city pages
Notable locations in zip code 29412: Island Plaza (A), Whitehall Plantation (B), Charleston Golf Course (C), Plum Island Wastewater Treatment Plant (D), North Windmill (E), South Windmill (F), Fort Johnson Marine Biological Station (G), Charleston Country Club (H), James Island Yacht Club (I), James Island Magistrate Office (J), Charleston County Public Library James Island Branch Library (K), City of Charleston Fire Department Station 13 (L), James Island Fire Department Station 3 (M), James Island Fire Department Station 4 (N), James Island Fire Department Station 2 (O), James Island Fire Department Station 1 (P), City of Charleston Fire Department Station 7 (Q), Charleston County Sheriff West District Service Center and Substation (R). Display/hide their locations on the map
Shopping Centers: Meyer Park Plaza Shopping Center (1), James Island Shopping Center (2), Harbor View Shopping Center (3), Cross Creek Shopping Center (4). Display/hide their locations on the map
Streams, rivers, and creeks: Wolfpit Run (A), Simpson Creek (B), Second Sister Creek (C), Secessionville Creek (D), Seaside Creek (E), Schooner Creek (F), Robbins Creek (G), Rat Island Creek (H), Wappoo Creek (I). Display/hide their locations on the map
6,045 married couples with children.
1,252 single-parent households (773 men, 479 women).
94.1% of residents of 29412 zip code speak English at home.
2.6% of residents speak Spanish at home (75% very well, 23% well, 2% not well).
2.1% of residents speak other Indo-European language at home (80% very well, 20% well).
0.8% of residents speak Asian or Pacific Island language at home (61% very well, 39% well).
0.6% of residents speak other language at home (14% very well, 86% well).
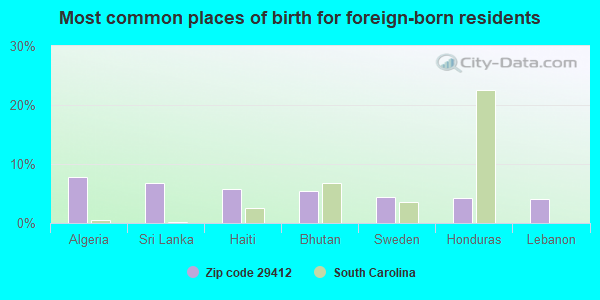
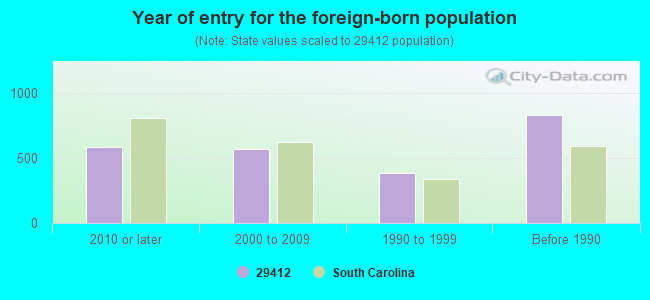
Foreign born population: 1,819 (4.4%) (61.5% of them are naturalized citizens)
Major facilities with environmental interests located in this zip code:
BELLSOUTH TELECOMMUNICATIONS INC - JAMES ISLAND (1630 CAMP ROAD in JAMES ISLAND, SC)
AIR MINOR (AIRS/AFS) STATE MASTER (South Carolina database) - AIR PROGRAM STATE MASTER (South Carolina database) - UNDERGROUND STORAGE TANK PROGRAM Business SIC classification: SERVICES Alternative names: BELLSOUTH:JAMES ISLAND, BELLSOUTH:JAMES ISLAND, SOUTHERN BELL - CHTNSCJM
AMERADA HESS STATION 40230 (1601 HARBOR VIEW RD in CHARLESTON, SC)
Conditionally Exempt Small Quantity Generators, less than 100 kg/month of hazardous waste (Resource Conservation and Recovery Act (tracking hazardous waste)) - notification STATE MASTER (South Carolina database) - HAZARDOUS WASTE PROGRAM STATE MASTER (South Carolina database) - UNDERGROUND STORAGE TANK PROGRAM Organizations: AMERADA HESS CORP (CONTACT/OWNER)
CHARLESTON WOOD INDUSTRIES (1911 MAYBANK HIGHWAY in CHARLESTON, SC)
National Pollutant Discharge Elimination System NON-MAJOR (Tracking pollutant discharge elimination systems) - permit (Resource Conservation and Recovery Act (tracking hazardous waste)) STATE MASTER (South Carolina database) - HAZARDOUS WASTE PROGRAM Business SIC classification: WOOD PRESERVING Organizations: OPERNAME (CONTACT/OPERATOR)
Alternative names: EDGARD BUCK - CHARLESTON WOOD
CONCRETE PRODUCTS COMPANY (39 FOLLY ROAD in CHARLESTON, SC)
AIR MINOR (AIRS/AFS) National Pollutant Discharge Elimination System NON-MAJOR (Tracking pollutant discharge elimination systems) - permit STATE MASTER (South Carolina database) - AIR PROGRAM, UNDERGROUND STORAGE TANK PROGRAM, Business SIC classification: CONCRETE BLOCK AND BRICK Alternative names: CONCRETE SERVICE CO., INC.
FORT SUMTER MARINE (719 FOLLY ROAD in CHARLESTON, SC)
(Resource Conservation and Recovery Act (tracking hazardous waste)) STATE MASTER (South Carolina database) - HAZARDOUS WASTE PROGRAM Organizations: OPERNAME (CONTACT/OPERATOR)
AMOCO OIL SS #917 (897 FOLLY ROAD in CHARLESTON, SC)
(Resource Conservation and Recovery Act (tracking hazardous waste)) STATE MASTER (South Carolina database) - UNDERGROUND STORAGE TANK PROGRAM Organizations: AMOCO OIL COMPANY (CONTACT/OWNER)
ATLANTIC LITTLENECK CLAMFARMS (2107 FOLLY ROAD in CHARLESTON, SC)
National Pollutant Discharge Elimination System NON-MAJOR (Tracking pollutant discharge elimination systems) - permit STATE MASTER (South Carolina database) - LABORATORY CERTIFICATION Business SIC classification: FISH HATCHERIES AND PRESERVES Organizations: ATLANTIC FARMS INC (CONTACT/OWNER)
Alternative names: ATLANTIC FARMS INC
BARNES PAINT & BODY SHOP (1990 MAYBANK HWY in JAMES ISLAND, SC)
Conditionally Exempt Small Quantity Generators, less than 100 kg/month of hazardous waste (Resource Conservation and Recovery Act (tracking hazardous waste)) - notification STATE MASTER (South Carolina database) - HAZARDOUS WASTE PROGRAM
COLONIAL RESTORATION (952 ANCHOR RD in CHARLESTON, SC)
Small Quantity Generators, between 100 kg and 1000 kg of hazardous waste/month (Resource Conservation and Recovery Act (tracking hazardous waste)) - notification STATE MASTER (South Carolina database) - HAZARDOUS WASTE PROGRAM
FORT JOHNSON MIDDLE (1825 CAMP ROAD in JAMES ISLAND, SC)
(National Center for Education Statistics) - STATE ID-1001035 Organizations: CHARLESTON COUNTY SCHOOL DISTRICT (SCHOOL DISTRICT)
CORINTHIAN CULTURED MARBLE LTD (403 FLEMING RD. in CHARLESTON, SC)
AIR MINOR (AIRS/AFS) Small Quantity Generators, between 100 kg and 1000 kg of hazardous waste/month (Resource Conservation and Recovery Act (tracking hazardous waste)) TRI REPORTER (Tracking of toxic chemicals releasing facilities) Business SIC classification: PLASTICS PLUMBING FIXTURES Organizations: CORINTHIAN MARBLE INC (CONTACT/OPERATOR)
, BRYAN MCCLELLAND (CONTACT/OWNER)
Alternative names: CORINTHIAN MARBLE INC
BP OIL-SITE #48147 (1311 FOLLY ROAD & GRIMBALL in JAMES ISLAND, SC)
(Resource Conservation and Recovery Act (tracking hazardous waste)) Organizations: BP OIL-D W MADDOX/DEALER (CONTACT/OWNER)
Housing units lacking complete plumbing facilities: 0.2% Housing units lacking complete kitchen facilities: 0.5%
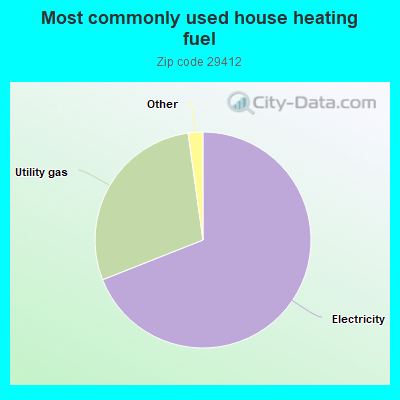
69.0%Electricity
28.8%Utility gas
0.8%Solar energy
0.6%Bottled, tank, or LP gas
Population in 1990: 29,969. Population change in the 1990s: +1,954 (+6.5%).
Place of birth for U.S.-born residents:
This state: 17,419
Northeast: 6,184
Midwest: 3,663
South: 10,404
West: 1,587
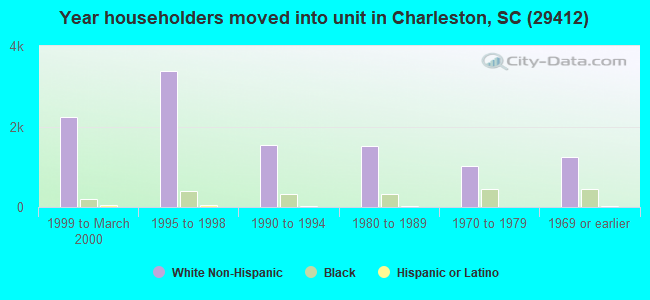
57% of the 29412 zip code residents lived in the same house 5 years ago. Out of people who lived in different houses, 56% lived in this county. Out of people who lived in different counties, 50% lived in South Carolina.
89% of the 29412 zip code residents lived in the same house 1 year ago. Out of people who lived in different houses, 44% moved from this county. Out of people who lived in different houses, 13% moved from different county within same state. Out of people who lived in different houses, 42% moved from different state. Out of people who lived in different houses, 1% moved from abroad.
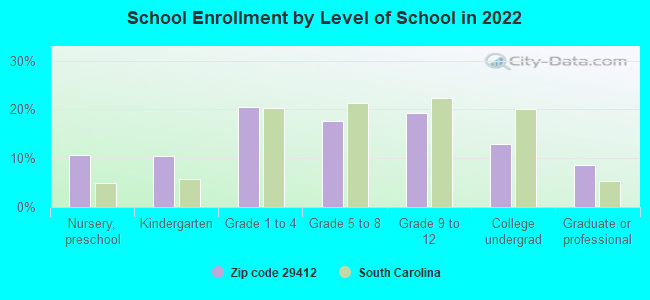
Private vs. public school enrollment:
Students in private schools in grades 1 to 8 (elementary and middle school): 741
Here:
24.0%
South Carolina:
14.4%
Students in private schools in grades 9 to 12 (high school): 325
Here:
20.9%
South Carolina:
11.1%
Students in private undergraduate colleges: 94
Here:
9.1%
South Carolina:
21.9%
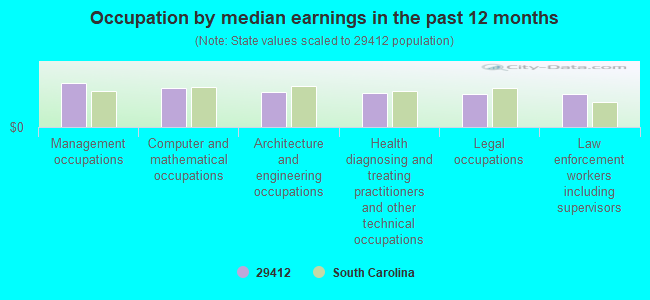
Occupation by median earnings in the past 12 months ($)
101,898Management occupations
89,531Computer and mathematical occupations
80,156Architecture and engineering occupations
79,843Health diagnosing and treating practitioners and other technical occupations
77,200Legal occupations
75,908Law enforcement workers including supervisors
Companies with federal contracts located in this zip code (CHARLESTON, SC):
PETROLEUM RECOVERY SERVICES (1570 FAIRWAY DRIVE; small business) : $166,271 in 10 contractsfrom 2000 to 2006
Contracts for Maintenance, Repair and Rebuilding of Equipment -- Miscellaneous, Facilities Operations Support Services, Maintenance, Repair or Alteration of Real Property -- Government-Owned Government-Operated (GOGO) R&D Facilities, Maintenance, Repair and Rebuilding of Equipment -- Alarm, Signal, and Security Detection Systems, and moreby National Oceanic and Atmospheric Administration/Under Secretary for Oceans and Atmosphere, Navy Signed by year:2000: $24,790; 2001: $0; 2002: $4,150; 2003: $3,800; 2004: $60,975; 2005: $8,896; 2006: $63,660.
Biggest contracts:
$63,660 with National Oceanic and Atmospheric Administration/Under Secretary for Oceans and Atmosphere for Maintenance, Repair and Rebuilding of Equipment -- Miscellaneous. Signed on 2006-01-19. Completion date: 2006-03-30.
$48,925 with Navy for Facilities Operations Support Services. Taking place in NC. Signed on 2004-03-03. Completion date: 2004-04-30.
$24,790 with Navy for Maintenance, Repair or Alteration of Real Property -- Government-Owned Government-Operated (GOGO) R&D Facilities. Taking place in VA. Signed on 2000-10-01. Completion date: 1999-12-27.
$7,900 with Navy for Maintenance, Repair and Rebuilding of Equipment -- Alarm, Signal, and Security Detection Systems. Signed on 2004-09-10. Completion date: 2004-09-28.
TERRACE HEATING AND AIR INC (2041 WAPPOO DR STE E; small business) : $70,545 in 3 contractsfrom 2001 to 2006
$35,215 with Navy for Plumbing Fixtures and Accessories. Signed on 2001-02-05. Completion date: 2001-02-15.
$18,690 with Navy for Maintenance, Repair and Rebuilding of Equipment -- Refrigeration, Air Conditioning, and Air Circulating Equipment. Signed on 2006-05-09. Completion date: 2006-06-09.
$16,640 with Navy for Miscellaneous Items. Signed on 2005-06-30. Completion date: 2005-07-15.
EMERGENCY LIGHTING SPECIALTIES (91 RIVERS POINT ROW; small business)
$16,191 with Navy for Fire Fighting Equipment. Signed on 2004-08-13. Completion date: 2004-08-20.
DIRECT EQUIPMENT SUPPLY COMPAN (648 FORT SUMTER DR; small business) : $15,894 in 3 contractsfrom 2003 to 2005
$10,264 with Army for Industrial Assembly Machines. Signed on 2005-01-25. Completion date: 2005-02-18.
$5,163 with Army for Trailers. Signed on 2003-09-18. Completion date: 2003-09-29.
$467 with Army for Industrial Assembly Machines. Signed on 2005-02-09. Completion date: 2005-02-18.
KEATING ROOFING & S.M. CO., IN (654 RIVERLAND DRIVE; small business) : $11,860 in 2 contractsin 2000
$6,660 with Navy for Construction of Structures and Facilities -- Miscellaneous Buildings. Signed on 2000-02-22. Completion date: 2000-04-29.
$5,200 with Navy for Maintenance, Repair or Alteration of Real Property -- Miscellaneous Buildings. Signed on 2000-02-23. Completion date: 2000-04-28.
ATLANTIC INC PEST MANAGEMENT (1731 SIGNAL POINT ROAD; small business) : $5,400 in 4 contractsfrom 2002 to 2006
$1,900 with Army for Operation of Government-Owned Facilities -- Other Utilities. Signed on 2002-10-01. Completion date: 2003-09-30.
$1,625, same as above.Signed on 2003-10-01. Completion date: 2004-09-30.
$1,500 with Army for Pesticides Support Services. Signed on 2006-01-25. Completion date: 2006-12-31.
$375 with Army for Operation of Government-Owned Facilities -- Other Utilities. Signed on 2005-09-23. Completion date: 2005-09-30.
NIOTEC INC (910 TRAVERS DRIVE; small business) : $0 in 2 contractsin 2000
$27,000 with Air Force for Laundry and DryCleaning Services. Signed on 2000-12-31. Completion date: 2001-10-31.
-$27,000, same as above.Signed on 2000-12-31. Completion date: 2001-10-30.
Top industries in this zip code by the number of employees in 2005:
2002 - 2018 National Fire Incident Reporting System (NFIRS) incidents
According to the data from the years 2002 - 2018 the average number of fires per year is 133. The highest number of fires - 194 took place in 2014, and the least - 66 in 2013. The data has an increasing trend.
When looking into fire subcategories, the most reports belonged to: Outside Fires (37.0%), and Structure Fires (33.8%).
Fire incident types reported to NFIRS in Zip Code 29412
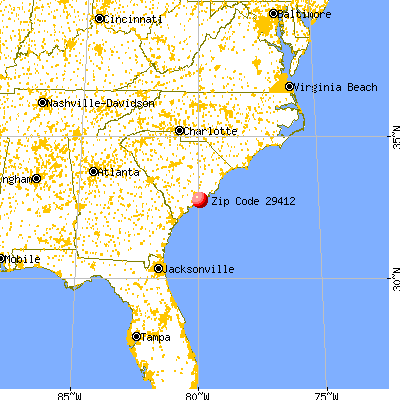


 Nearest zip codes: 29439, 29401, 29424, 29409, 29403, 29407.
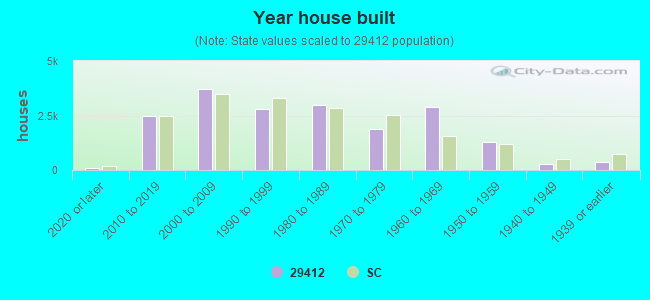


 According to the data from the years 2002 - 2018 the average number of fires per year is 133. The highest number of fires - 194 took place in 2014, and the least - 66 in 2013. The data has an increasing trend.
 When looking into fire subcategories, the most reports belonged to: Outside Fires (37.0%), and Structure Fires (33.8%).