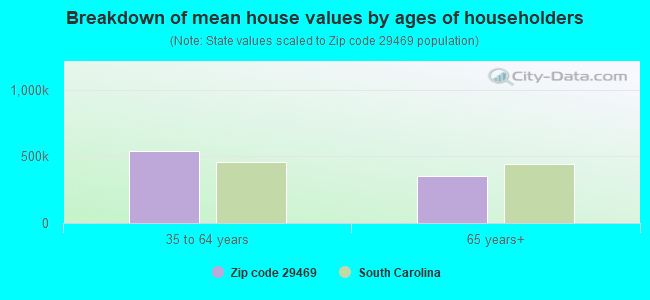
Estimated median house/condo value in 2022: $381,900
29469:
$381,900
South Carolina:
$254,600
Median resident age:
This zip code:
65.1 years
South Carolina median age:
40.5 years
Average household size:
This zip code:
1.7 people
South Carolina:
2.4 people
Averages for the 2020 tax year for zip code 29469, filed in 2021:
Average Adjusted Gross Income (AGI) in 2020: $89,721 (Individual Income Tax Returns)
Here:
$89,721
State:
$65,754
Salary/wage: $70,670 (reported on 71.4% of returns)
Here:
$70,670
State:
$52,566
(% of AGI for various income ranges: 983.3% for AGIs below $25k, 3400.0% for AGIs $25k-50k, 6297.5% for AGIs $50k-75k, 6396.7% for AGIs $75k-100k, 15374.0% for AGIs $100k-200k)
Taxable interest for individuals: $1,320 (reported on 35.7% of returns)
This zip code:
$1,320
South Carolina:
$1,749
(% of AGI for various income ranges: 28.3% for AGIs $25k-50k, 76.7% for AGIs $75k-100k, 146.0% for AGIs $100k-200k)
Ordinary dividends: $6,282 (reported on 26.2% of returns)
Here:
$6,282
State:
$8,783
(% of AGI for various income ranges: 53.3% for AGIs below $25k, 112.5% for AGIs $50k-75k, 530.0% for AGIs $100k-200k)
Net capital gain/loss in AGI: +$21,088 (reported on 19.0% of returns)
Here:
+$21,088
State:
+$24,194
(% of AGI for various income ranges: 168.3% for AGIs $25k-50k, 492.0% for AGIs $100k-200k)
Profit/loss from business: +$7,029 (reported on 16.7% of returns)
Here:
+$7,029
State:
+$11,253
(% of AGI for various income ranges: 837.5% for AGIs $50k-75k, 314.0% for AGIs $100k-200k)
Taxable individual retirement arrangement distribution: $20,017 (reported on 14.3% of returns)
29469:
$20,017
South Carolina:
$21,604
(% of AGI for various income ranges: 595.0% for AGIs $25k-50k, 1688.0% for AGIs $100k-200k)
Total itemized deductions: $35,020 (reported on 11.9% of returns)
Here:
$35,020
State:
$35,199
(% of AGI for various income ranges: 1800.0% for AGIs $100k-200k)
Charity contributions: $12,540 (reported on 11.9% of returns)
Here:
$12,540
State:
$14,319
(% of AGI for various income ranges: 496.0% for AGIs $100k-200k)
Taxes paid: $8,920 (reported on 11.9% of returns)
29469:
$8,920
State:
$7,486
(% of AGI for various income ranges: 468.0% for AGIs $100k-200k)
Earned income credit: $2,133 (reported on 7.1% of returns)
Here:
$2,133
State:
$2,397
(% of AGI for various income ranges: 106.7% for AGIs below $25k)
Percentage of individuals using paid preparers for their 2020 taxes: 90.5%
Here:
90%
State:
93%
(% for various income ranges: 87.5% for AGIs below $25k, 88.9% for AGIs $25k-50k, 85.7% for AGIs $50k-75k, 80.0% for AGIs $75k-100k, 100.0% for AGIs $100k-200k, 100.0% for AGIs over 200k)
Averages for the 2012 tax year for zip code 29469, filed in 2013:
Average Adjusted Gross Income (AGI) in 2012: $68,936 (Individual Income Tax Returns)
Here:
$68,936
State:
$51,133
Salary/wage: $57,867 (reported on 69.2% of returns)
Here:
$57,867
State:
$42,173
(% of AGI for various income ranges: 65.6% for AGIs below $25k, 61.9% for AGIs $25k-50k, 73.0% for AGIs $50k-75k, 45.8% for AGIs $75k-100k, 56.8% for AGIs $100k-200k)
Taxable interest for individuals: $376 (reported on 43.6% of returns)
This zip code:
$376
South Carolina:
$1,468
(% of AGI for various income ranges: 0.2% for AGIs below $25k, 0.3% for AGIs $25k-50k, 0.2% for AGIs $75k-100k, 0.3% for AGIs $100k-200k)
Ordinary dividends: $3,592 (reported on 30.8% of returns)
Here:
$3,592
State:
$6,511
(% of AGI for various income ranges: 1.3% for AGIs below $25k, 2.7% for AGIs $25k-50k, 1.7% for AGIs $50k-75k, 1.8% for AGIs $100k-200k)
Net capital gain/loss in AGI: +$1,438 (reported on 20.5% of returns)
Here:
+$1,438
State:
+$13,061
Profit/loss from business: +$5,300 (reported on 17.9% of returns)
Here:
+$5,300
State:
+$10,167
Taxable individual retirement arrangement distribution: $20,740 (reported on 12.8% of returns)
29469:
$20,740
South Carolina:
$17,019
Total itemized deductions: $25,619 (21% of AGI, reported on 41.0% of returns)
Here:
$25,619
State:
$22,890
Here:
21.1% of AGI
State:
21.4% of AGI
(% of AGI for various income ranges: 19.0% for AGIs $25k-50k, 13.7% for AGIs $50k-75k, 10.3% for AGIs $75k-100k, 17.8% for AGIs $100k-200k)
Charity contributions: $6,638 (reported on 41.0% of returns)
Here:
$6,638
State:
$5,169
(% of AGI for various income ranges: 3.1% for AGIs $25k-50k, 2.7% for AGIs $50k-75k, 3.0% for AGIs $75k-100k, 5.0% for AGIs $100k-200k)
Taxes paid: $8,681 (reported on 41.0% of returns)
29469:
$8,681
State:
$7,644
(% of AGI for various income ranges: 3.6% for AGIs $25k-50k, 3.3% for AGIs $50k-75k, 3.3% for AGIs $75k-100k, 6.8% for AGIs $100k-200k)
Earned income credit: $2,220 (reported on 12.8% of returns)
Here:
$2,220
State:
$2,418
(% of AGI for various income ranges: 6.8% for AGIs below $25k)
Percentage of individuals using paid preparers for their 2012 taxes: 61.5%
Here:
62%
State:
57%
(% for various income ranges: 53.8% for AGIs below $25k, 57.1% for AGIs $25k-50k, 60.0% for AGIs $50k-75k, 80.0% for AGIs $75k-100k, 66.7% for AGIs $100k-200k)
Averages for the 2004 tax year for zip code 29469, filed in 2005:
Average Adjusted Gross Income (AGI) in 2004: $53,845 (Individual Income Tax Returns)
Here:
$53,845
State:
$41,965
Salary/wage: $45,510 (reported on 78.5% of returns)
Here:
$45,510
State:
$35,695
(% of AGI for various income ranges: 109.6% for AGIs below $10k, 56.7% for AGIs $10k-25k, 64.4% for AGIs $25k-50k, 70.9% for AGIs $50k-75k, 58.8% for AGIs $75k-100k, 67.4% for AGIs over 100k)
Taxable interest for individuals: $1,286 (reported on 52.5% of returns)
This zip code:
$1,286
South Carolina:
$1,623
(% of AGI for various income ranges: 1.0% for AGIs below $10k, 4.7% for AGIs $10k-25k, 3.5% for AGIs $25k-50k, 0.5% for AGIs $50k-75k, 0.9% for AGIs $75k-100k, 0.6% for AGIs over 100k)
Taxable dividends: $2,029 (reported on 31.9% of returns)
Here:
$2,029
State:
$3,999
(% of AGI for various income ranges: 1.0% for AGIs below $10k, 2.6% for AGIs $10k-25k, 1.0% for AGIs $25k-50k, 0.5% for AGIs $50k-75k, 2.2% for AGIs $75k-100k, 1.0% for AGIs over 100k)
Net capital gain/loss: +$4,812 (reported on 22.2% of returns)
Here:
+$4,812
State:
+$13,100
(% of AGI for various income ranges: 0.8% for AGIs below $10k, -0.3% for AGIs $25k-50k, 0.3% for AGIs $50k-75k, 0.6% for AGIs $75k-100k, 4.1% for AGIs over 100k)
Profit/loss from business: +$3,808 (reported on 18.1% of returns)
Here:
+$3,808
State:
+$9,144
(% of AGI for various income ranges: 7.0% for AGIs below $10k, 0.8% for AGIs $25k-50k, -0.7% for AGIs $50k-75k, 0.3% for AGIs $75k-100k, 2.5% for AGIs over 100k)
Total itemized deductions: $19,930 (22% of AGI, reported on 42.8% of returns)
Here:
$19,930
State:
$19,039
Here:
21.6% of AGI
State:
22.8% of AGI
(% of AGI for various income ranges: 13.9% for AGIs $10k-25k, 15.6% for AGIs $25k-50k, 17.9% for AGIs $50k-75k, 16.4% for AGIs $75k-100k, 15.7% for AGIs over 100k)
Charity contributions deductions: $5,723 (6% of AGI, reported on 40.0% of returns)
Here:
$5,723
State:
$4,305
Here:
6.0% of AGI
State:
5.0% of AGI
(% of AGI for various income ranges: 2.2% for AGIs $10k-25k, 3.4% for AGIs $25k-50k, 3.7% for AGIs $50k-75k, 4.1% for AGIs $75k-100k, 5.2% for AGIs over 100k)
Total tax: $8,006 (reported on 78.0% of returns)
29469:
$8,006
State:
$6,497
(% of AGI for various income ranges: 2.1% for AGIs below $10k, 4.0% for AGIs $10k-25k, 6.7% for AGIs $25k-50k, 8.4% for AGIs $50k-75k, 10.7% for AGIs $75k-100k, 15.9% for AGIs over 100k)
Earned income credit: $1,766 (reported on 10.9% of returns)
Here:
$1,766
State:
$1,882
Percentage of individuals using paid preparers for their 2004 taxes: 70.1%
Here:
70%
State:
66%
(% for various income ranges: 56.7% for AGIs below $10k, 76.2% for AGIs $10k-25k, 70.6% for AGIs $25k-50k, 74.6% for AGIs $50k-75k, 70.5% for AGIs $75k-100k, 75.8% for AGIs over 100k)
Household received Food Stamps/SNAP in the past 12 months: 12 Household did not receive Food Stamps/SNAP in the past 12 months: 343
Women who did not have a birth in the past 12 months: 17 (17 now married, 0 unmarried)
Housing units in zip code 29469 with a mortgage: 104 (7 second mortgage, 7 both second mortgage and home equity loan) Median monthly owner costs for units with a mortgage: $1,793 Median monthly owner costs for units without a mortgage: $299
Residents with income below the poverty level in 2022:
This zip code:
16.6%
Whole state:
14.0%
Residents with income below 50% of the poverty level in 2022:
This zip code:
16.6%
Whole state:
7.3%
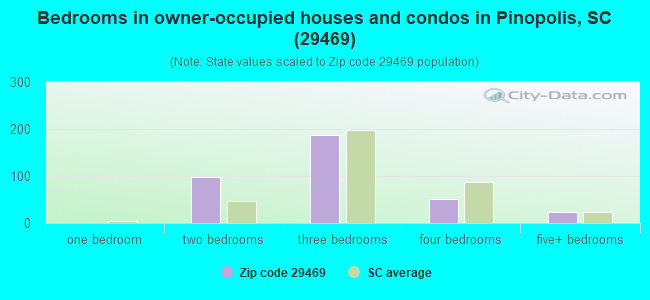
Median number of rooms in houses and condos:
Here:
6.5
State:
6.4
Notable locations in this zip code not listed on our city pages
Churches in zip code 29469 include: Mount Olivet Baptist Church (A), Pinopolis United Methodist Church (B), Trinity Episcopal Church (C). Display/hide their locations on the map
Size of family households: 190 2-persons, 13 3-persons, 14 4-persons
Size of nonfamily households: 120 1-person, 23 2-persons
96.9% of residents of 29469 zip code speak English at home.
4.4% of residents speak other Indo-European language at home (100% very well).
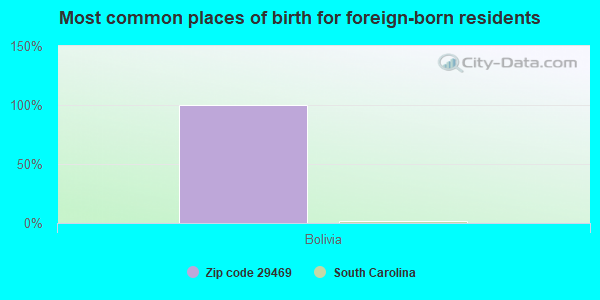
Foreign born population: 24 (3.9%) (100.0% of them are naturalized citizens)
This zip code:
3.9%
Whole state:
5.2%
100%Bolivia
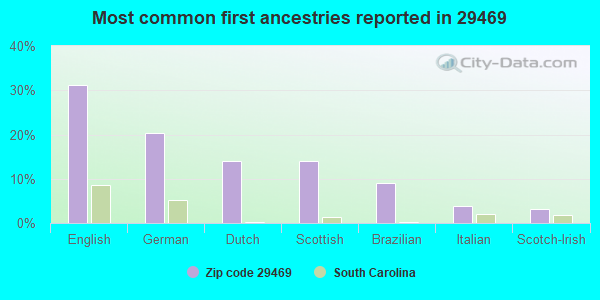
31%English
20%German
14%Dutch
14%Scottish
9%Brazilian
4%Italian
3%Scotch-Irish
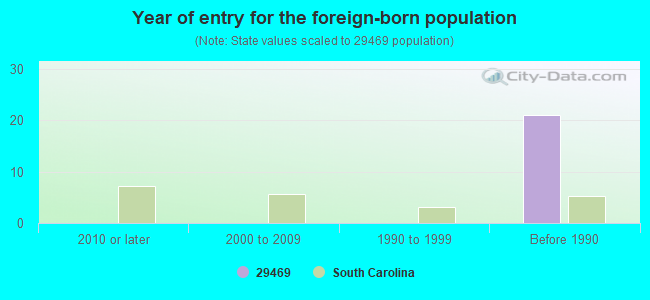
Year of entry for the foreign-born population
02010 or later
02000 to 2009
01990 to 1999
21Before 1990
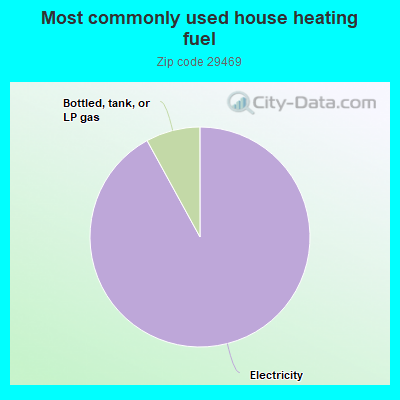
92.2%Electricity
8.0%Bottled, tank, or LP gas
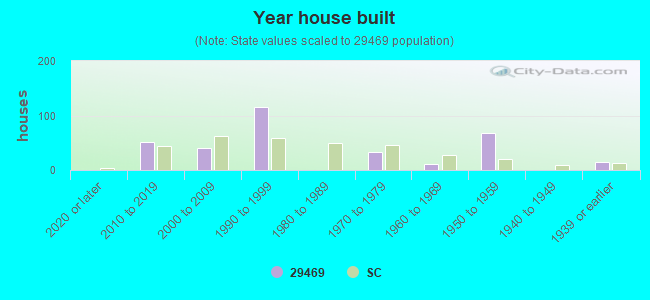
Population in 1990: 958.
Place of birth for U.S.-born residents:
This state: 358
Northeast: 78
Midwest: 38
South: 95
West: 21
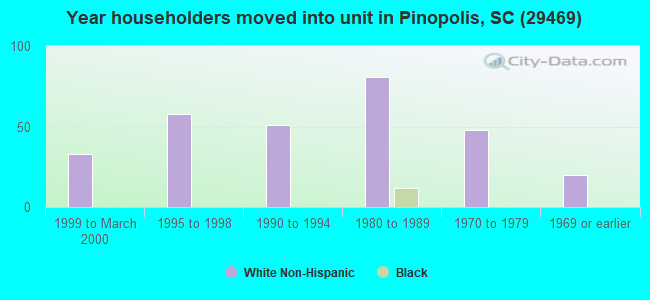
83% of the 29469 zip code residents lived in the same house 5 years ago. Out of people who lived in different houses, 47% lived in this county. Out of people who lived in different counties, 50% lived in South Carolina.
100% of the 29469 zip code residents lived in the same house 1 year ago.
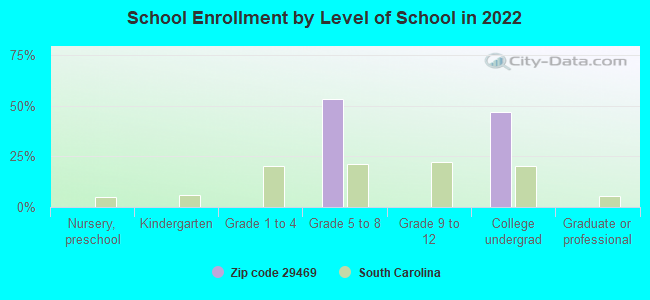
Private vs. public school enrollment:
Students in private schools in grades 1 to 8 (elementary and middle school):
Here:
0.0%
South Carolina:
14.4%
Students in private undergraduate colleges:
Here:
0.0%
South Carolina:
21.9%
Top industries in this zip code by the number of employees in 2005:
Construction: New Single-Family Housing Construction (except Operative Builders) (10-19 employees: 1 establishment)
Other Services (except Public Administration): Religious Organizations (5-9: 2)
Utilities: Water Supply and Irrigation Systems (5-9: 1)
Construction: Site Preparation Contractors (1-4: 2)
Construction: Electrical Contractors (1-4: 1)
Professional, Scientific, and Technical Services: Offices of Lawyers (1-4: 1)
Wholesale Trade: Refrigeration Equipment and Supplies Merchant Wholesalers (1-4: 1)
Wholesale Trade: Jewelry, Watch, Precious Stone, and Precious Metal Merchant Wholesalers (1-4: 1)
Finance and Insurance: Insurance Agencies and Brokerages (1-4: 1)
Fatal accident statistics in 2010:
Fatal accident count: 2
Vehicles involved in fatal accidents: 2
Fatal accidents caused by drunken drivers: 1
Fatalities: 2
Persons involved in fatal accidents: 2
Pedestrians involved in fatal accidents: 0
Home Mortgage Disclosure Act Aggregated Statistics For Year 2009 (Based on 2 partial tracts)
A) FHA, FSA/RHS & VA Home Purchase Loans
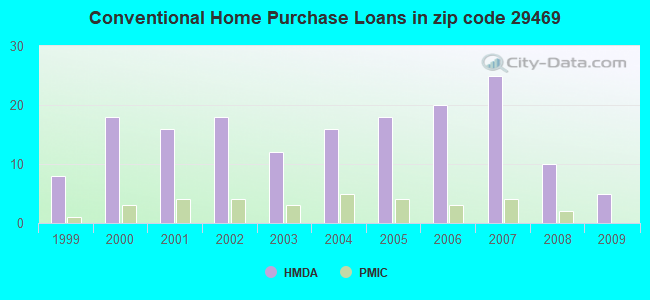
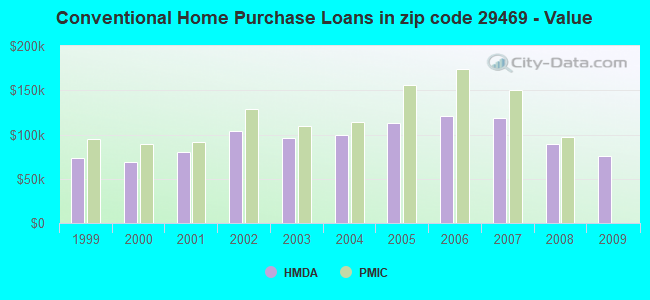
B) Conventional Home Purchase Loans
C) Refinancings
D) Home Improvement Loans
F) Non-occupant Loans on < 5 Family Dwellings (A B C & D)
G) Loans On Manufactured Home Dwelling (A B C & D)
Number
Average Value
Number
Average Value
Number
Average Value
Number
Average Value
Number
Average Value
Number
Average Value
LOANS ORIGINATED
4
$151,690
5
$75,206
17
$173,332
6
$49,880
5
$55,286
6
$39,347
APPLICATIONS APPROVED, NOT ACCEPTED
0
$0
1
$127,340
2
$159,490
0
$0
0
$0
0
$0
APPLICATIONS DENIED
5
$190,664
3
$122,927
16
$182,432
1
$82,110
1
$101,970
3
$66,403
APPLICATIONS WITHDRAWN
1
$246,010
1
$122,460
6
$142,182
0
$0
0
$0
0
$0
FILES CLOSED FOR INCOMPLETENESS
0
$0
0
$0
2
$140,185
0
$0
0
$0
0
$0
Aggregated Statistics For Year 2008 (Based on 2 partial tracts)
A) FHA, FSA/RHS & VA Home Purchase Loans
B) Conventional Home Purchase Loans
C) Refinancings
D) Home Improvement Loans
F) Non-occupant Loans on < 5 Family Dwellings (A B C & D)
G) Loans On Manufactured Home Dwelling (A B C & D)
Number
Average Value
Number
Average Value
Number
Average Value
Number
Average Value
Number
Average Value
Number
Average Value
LOANS ORIGINATED
4
$146,725
10
$89,769
19
$135,129
6
$22,090
6
$52,533
8
$37,804
APPLICATIONS APPROVED, NOT ACCEPTED
0
$0
1
$127,660
3
$113,997
0
$0
0
$0
1
$66,190
APPLICATIONS DENIED
3
$146,777
2
$105,905
13
$142,907
2
$90,780
1
$68,400
3
$55,003
APPLICATIONS WITHDRAWN
1
$206,610
1
$155,080
6
$128,838
0
$0
0
$0
1
$65,090
FILES CLOSED FOR INCOMPLETENESS
0
$0
1
$88,410
1
$225,680
0
$0
0
$0
0
$0
Aggregated Statistics For Year 2007 (Based on 2 partial tracts)
A) FHA, FSA/RHS & VA Home Purchase Loans
B) Conventional Home Purchase Loans
C) Refinancings
D) Home Improvement Loans
F) Non-occupant Loans on < 5 Family Dwellings (A B C & D)
G) Loans On Manufactured Home Dwelling (A B C & D)
Number
Average Value
Number
Average Value
Number
Average Value
Number
Average Value
Number
Average Value
Number
Average Value
LOANS ORIGINATED
6
$166,530
25
$118,200
24
$133,428
7
$45,817
9
$77,977
12
$53,978
APPLICATIONS APPROVED, NOT ACCEPTED
0
$0
4
$150,232
6
$118,935
0
$0
0
$0
2
$88,335
APPLICATIONS DENIED
2
$162,880
6
$144,125
19
$129,497
4
$68,478
2
$100,390
5
$79,808
APPLICATIONS WITHDRAWN
2
$216,385
7
$132,497
9
$134,906
1
$118,040
1
$34,830
2
$70,290
FILES CLOSED FOR INCOMPLETENESS
1
$107,800
1
$136,800
1
$146,250
0
$0
0
$0
0
$0
Aggregated Statistics For Year 2006 (Based on 2 partial tracts)
A) FHA, FSA/RHS & VA Home Purchase Loans
B) Conventional Home Purchase Loans
C) Refinancings
D) Home Improvement Loans
F) Non-occupant Loans on < 5 Family Dwellings (A B C & D)
G) Loans On Manufactured Home Dwelling (A B C & D)
Number
Average Value
Number
Average Value
Number
Average Value
Number
Average Value
Number
Average Value
Number
Average Value
LOANS ORIGINATED
1
$169,740
20
$120,627
21
$139,543
6
$53,478
5
$85,828
7
$67,476
APPLICATIONS APPROVED, NOT ACCEPTED
1
$144,200
6
$161,042
5
$116,246
1
$28,530
1
$57,840
4
$57,485
APPLICATIONS DENIED
0
$0
11
$121,095
18
$113,244
5
$65,624
2
$204,330
9
$62,094
APPLICATIONS WITHDRAWN
0
$0
5
$138,498
6
$110,137
1
$109,060
1
$82,740
1
$95,030
FILES CLOSED FOR INCOMPLETENESS
0
$0
1
$95,510
3
$126,080
0
$0
0
$0
0
$0
Aggregated Statistics For Year 2005 (Based on 2 partial tracts)
A) FHA, FSA/RHS & VA Home Purchase Loans
B) Conventional Home Purchase Loans
C) Refinancings
D) Home Improvement Loans
F) Non-occupant Loans on < 5 Family Dwellings (A B C & D)
G) Loans On Manufactured Home Dwelling (A B C & D)
Number
Average Value
Number
Average Value
Number
Average Value
Number
Average Value
Number
Average Value
Number
Average Value
LOANS ORIGINATED
2
$168,555
18
$113,533
23
$119,015
8
$54,609
6
$104,252
7
$43,746
APPLICATIONS APPROVED, NOT ACCEPTED
0
$0
4
$118,910
5
$89,896
1
$28,530
1
$44,130
2
$73,285
APPLICATIONS DENIED
1
$55,000
9
$74,002
20
$103,252
5
$48,666
1
$128,760
9
$51,536
APPLICATIONS WITHDRAWN
0
$0
4
$119,815
7
$96,429
1
$213,550
1
$78,480
1
$86,840
FILES CLOSED FOR INCOMPLETENESS
0
$0
1
$119,150
6
$98,553
0
$0
0
$0
1
$76,280
Aggregated Statistics For Year 2004 (Based on 2 partial tracts)
A) FHA, FSA/RHS & VA Home Purchase Loans
B) Conventional Home Purchase Loans
C) Refinancings
D) Home Improvement Loans
F) Non-occupant Loans on < 5 Family Dwellings (A B C & D)
G) Loans On Manufactured Home Dwelling (A B C & D)
Number
Average Value
Number
Average Value
Number
Average Value
Number
Average Value
Number
Average Value
Number
Average Value
LOANS ORIGINATED
2
$111,500
16
$99,830
23
$105,201
5
$41,574
3
$64,983
8
$46,414
APPLICATIONS APPROVED, NOT ACCEPTED
0
$0
6
$78,432
3
$133,173
0
$0
0
$0
3
$57,680
APPLICATIONS DENIED
2
$81,715
12
$65,338
20
$89,422
4
$34,632
1
$95,820
14
$54,384
APPLICATIONS WITHDRAWN
0
$0
2
$145,780
7
$118,403
1
$33,250
0
$0
0
$0
FILES CLOSED FOR INCOMPLETENESS
0
$0
1
$106,060
4
$105,198
0
$0
0
$0
1
$51,850
Aggregated Statistics For Year 2003 (Based on 2 partial tracts)
A) FHA, FSA/RHS & VA Home Purchase Loans
B) Conventional Home Purchase Loans
C) Refinancings
D) Home Improvement Loans
F) Non-occupant Loans on < 5 Family Dwellings (A B C & D)
Number
Average Value
Number
Average Value
Number
Average Value
Number
Average Value
Number
Average Value
LOANS ORIGINATED
2
$73,050
12
$96,241
48
$105,290
4
$14,380
4
$67,375
APPLICATIONS APPROVED, NOT ACCEPTED
1
$34,200
8
$56,618
8
$86,522
1
$31,050
0
$0
APPLICATIONS DENIED
3
$57,103
30
$51,777
17
$79,319
2
$35,145
1
$45,230
APPLICATIONS WITHDRAWN
0
$0
1
$85,580
7
$96,496
0
$0
0
$0
FILES CLOSED FOR INCOMPLETENESS
0
$0
1
$76,750
2
$143,970
0
$0
0
$0
Aggregated Statistics For Year 2002 (Based on 2 partial tracts)
A) FHA, FSA/RHS & VA Home Purchase Loans
B) Conventional Home Purchase Loans
C) Refinancings
D) Home Improvement Loans
F) Non-occupant Loans on < 5 Family Dwellings (A B C & D)
Number
Average Value
Number
Average Value
Number
Average Value
Number
Average Value
Number
Average Value
LOANS ORIGINATED
2
$189,595
18
$104,244
39
$100,383
3
$18,280
5
$72,432
APPLICATIONS APPROVED, NOT ACCEPTED
0
$0
4
$68,712
5
$93,898
0
$0
0
$0
APPLICATIONS DENIED
0
$0
10
$48,541
16
$89,300
2
$17,020
0
$0
APPLICATIONS WITHDRAWN
0
$0
2
$86,285
6
$93,982
0
$0
0
$0
FILES CLOSED FOR INCOMPLETENESS
0
$0
0
$0
2
$83,055
0
$0
0
$0
Aggregated Statistics For Year 2001 (Based on 2 partial tracts)
A) FHA, FSA/RHS & VA Home Purchase Loans
B) Conventional Home Purchase Loans
C) Refinancings
D) Home Improvement Loans
F) Non-occupant Loans on < 5 Family Dwellings (A B C & D)
Number
Average Value
Number
Average Value
Number
Average Value
Number
Average Value
Number
Average Value
LOANS ORIGINATED
2
$109,770
16
$80,376
28
$94,442
8
$10,126
3
$51,797
APPLICATIONS APPROVED, NOT ACCEPTED
0
$0
5
$53,268
5
$72,528
0
$0
0
$0
APPLICATIONS DENIED
0
$0
18
$47,919
18
$83,677
4
$13,002
1
$44,440
APPLICATIONS WITHDRAWN
0
$0
2
$100,865
8
$82,149
1
$21,910
0
$0
FILES CLOSED FOR INCOMPLETENESS
0
$0
0
$0
2
$79,510
0
$0
0
$0
Aggregated Statistics For Year 2000 (Based on 2 partial tracts)
A) FHA, FSA/RHS & VA Home Purchase Loans
B) Conventional Home Purchase Loans
C) Refinancings
D) Home Improvement Loans
F) Non-occupant Loans on < 5 Family Dwellings (A B C & D)
Number
Average Value
Number
Average Value
Number
Average Value
Number
Average Value
Number
Average Value
LOANS ORIGINATED
1
$104,330
18
$69,432
15
$64,984
5
$10,150
4
$41,450
APPLICATIONS APPROVED, NOT ACCEPTED
1
$32,310
7
$50,837
5
$77,444
1
$23,640
0
$0
APPLICATIONS DENIED
1
$30,100
29
$46,568
15
$64,868
2
$23,955
1
$70,450
APPLICATIONS WITHDRAWN
0
$0
2
$67,845
5
$54,372
0
$0
0
$0
FILES CLOSED FOR INCOMPLETENESS
0
$0
1
$49,640
1
$76,120
0
$0
0
$0
Aggregated Statistics For Year 1999 (Based on 1 partial tract)
B) Conventional Home Purchase Loans
C) Refinancings
D) Home Improvement Loans
F) Non-occupant Loans on < 5 Family Dwellings (A B C & D)


 Nearest zip codes: 29461, 29436, 29468, 29431, 29479, 29483.