Estimated zip code population in 2022: 27,373
Zip code population in 2010: 25,685
Zip code population in 2000: 23,337
Houses and condos: 11,907
Renter-occupied apartments: 3,719
% of renters here:
33%State:
28%
March 2022 cost of living index in zip code 29617: 86.5
(less than average, U.S. average is 100)
Land area: 23.2
sq. mi.
Water area: 0.3
sq. mi.
Population density: 1,178 people per square mile (low).
OSM Map
General Map
Google Map
MSN Map
OSM Map
General Map
Google Map
MSN Map
OSM Map
General Map
Google Map
MSN Map
OSM Map
General Map
Google Map
MSN Map
Please wait while loading the map...
Real estate property taxes paid for housing units in 2022:
This zip code:
0.6% ($1,252)South Carolina:
0.5% ($1,185)
Median real estate property taxes paid for housing units with mortgages in 2022: $1,339 (0.6%)
Median real estate property taxes paid for housing units with no mortgage in 2022: $1,080 (0.5%)
Profiles of local businesses
Business Search - 14 Million verified businesses
Males: 13,191 Females: 14,183
For population 25 years and over in 29617:
High school or higher: 81.6%Bachelor's degree or higher: 26.7%Graduate or professional degree: 9.5%Unemployed: 4.6%Mean travel time to work (commute): 27.6 minutes
For population 15 years and over in 29617:
Never married: 32.3%Now married: 48.1%Separated: 2.3%Widowed: 7.3%Divorced: 10.0%
Zip code 29617 compared to state average:
Black race population percentage below state average. Hispanic race population percentage significantly above state average. Foreign-born population percentage significantly above state average. Length of stay since moving in significantly above state average. 15,830 57.8% White 6,355 23.2% Hispanic or Latino 3,995 14.6% Black 763 2.8% Two or more races 293 1.1% Asian 85 0.3% Some other race 50 0.2% American Indian
Data:
Median household income ($)
Median household income (% change since 2000)
Household income diversity
Ratio of average income to average house value (%)
Ratio of average income to average rent
Median household income ($) - White
Median household income ($) - Black or African American
Median household income ($) - Asian
Median household income ($) - Hispanic or Latino
Median household income ($) - American Indian and Alaska Native
Median household income ($) - Multirace
Median household income ($) - Other Race
Median household income for houses/condos with a mortgage ($)
Median household income for apartments without a mortgage ($)
Races - White alone (%)
Races - White alone (% change since 2000)
Races - Black alone (%)
Races - Black alone (% change since 2000)
Races - American Indian alone (%)
Races - American Indian alone (% change since 2000)
Races - Asian alone (%)
Races - Asian alone (% change since 2000)
Races - Hispanic (%)
Races - Hispanic (% change since 2000)
Races - Native Hawaiian and Other Pacific Islander alone (%)
Races - Native Hawaiian and Other Pacific Islander alone (% change since 2000)
Races - Two or more races (%)
Races - Two or more races (% change since 2000)
Races - Other race alone (%)
Races - Other race alone (% change since 2000)
Racial diversity
Unemployment (%)
Unemployment (% change since 2000)
Unemployment (%) - White
Unemployment (%) - Black or African American
Unemployment (%) - Asian
Unemployment (%) - Hispanic or Latino
Unemployment (%) - American Indian and Alaska Native
Unemployment (%) - Multirace
Unemployment (%) - Other Race
Population density (people per square mile)
Population - Males (%)
Population - Females (%)
Population - Males (%) - White
Population - Males (%) - Black or African American
Population - Males (%) - Asian
Population - Males (%) - Hispanic or Latino
Population - Males (%) - American Indian and Alaska Native
Population - Males (%) - Multirace
Population - Males (%) - Other Race
Population - Females (%) - White
Population - Females (%) - Black or African American
Population - Females (%) - Asian
Population - Females (%) - Hispanic or Latino
Population - Females (%) - American Indian and Alaska Native
Population - Females (%) - Multirace
Population - Females (%) - Other Race
Coronavirus confirmed cases (Apr 19, 2024)
Deaths caused by coronavirus (Apr 19, 2024)
Coronavirus confirmed cases (per 100k population) (Apr 19, 2024)
Deaths caused by coronavirus (per 100k population) (Apr 19, 2024)
Daily increase in number of cases (Apr 19, 2024)
Weekly increase in number of cases (Apr 19, 2024)
Cases doubled (in days) (Apr 19, 2024)
Hospitalized patients (Apr 18, 2022)
Negative test results (Apr 18, 2022)
Total test results (Apr 18, 2022)
COVID Vaccine doses distributed (per 100k population) (Sep 19, 2023)
COVID Vaccine doses administered (per 100k population) (Sep 19, 2023)
COVID Vaccine doses distributed (Sep 19, 2023)
COVID Vaccine doses administered (Sep 19, 2023)
Likely homosexual households (%)
Likely homosexual households (% change since 2000)
Likely homosexual households - Lesbian couples (%)
Likely homosexual households - Lesbian couples (% change since 2000)
Likely homosexual households - Gay men (%)
Likely homosexual households - Gay men (% change since 2000)
Cost of living index
Median gross rent ($)
Median contract rent ($)
Median monthly housing costs ($)
Median house or condo value ($)
Median house or condo value ($ change since 2000)
Mean house or condo value by units in structure - 1, detached ($)
Mean house or condo value by units in structure - 1, attached ($)
Mean house or condo value by units in structure - 2 ($)
Mean house or condo value by units in structure by units in structure - 3 or 4 ($)
Mean house or condo value by units in structure - 5 or more ($)
Mean house or condo value by units in structure - Boat, RV, van, etc. ($)
Mean house or condo value by units in structure - Mobile home ($)
Median house or condo value ($) - White
Median house or condo value ($) - Black or African American
Median house or condo value ($) - Asian
Median house or condo value ($) - Hispanic or Latino
Median house or condo value ($) - American Indian and Alaska Native
Median house or condo value ($) - Multirace
Median house or condo value ($) - Other Race
Median resident age
Resident age diversity
Median resident age - Males
Median resident age - Females
Median resident age - White
Median resident age - Black or African American
Median resident age - Asian
Median resident age - Hispanic or Latino
Median resident age - American Indian and Alaska Native
Median resident age - Multirace
Median resident age - Other Race
Median resident age - Males - White
Median resident age - Males - Black or African American
Median resident age - Males - Asian
Median resident age - Males - Hispanic or Latino
Median resident age - Males - American Indian and Alaska Native
Median resident age - Males - Multirace
Median resident age - Males - Other Race
Median resident age - Females - White
Median resident age - Females - Black or African American
Median resident age - Females - Asian
Median resident age - Females - Hispanic or Latino
Median resident age - Females - American Indian and Alaska Native
Median resident age - Females - Multirace
Median resident age - Females - Other Race
Commute - mean travel time to work (minutes)
Travel time to work - Less than 5 minutes (%)
Travel time to work - Less than 5 minutes (% change since 2000)
Travel time to work - 5 to 9 minutes (%)
Travel time to work - 5 to 9 minutes (% change since 2000)
Travel time to work - 10 to 19 minutes (%)
Travel time to work - 10 to 19 minutes (% change since 2000)
Travel time to work - 20 to 29 minutes (%)
Travel time to work - 20 to 29 minutes (% change since 2000)
Travel time to work - 30 to 39 minutes (%)
Travel time to work - 30 to 39 minutes (% change since 2000)
Travel time to work - 40 to 59 minutes (%)
Travel time to work - 40 to 59 minutes (% change since 2000)
Travel time to work - 60 to 89 minutes (%)
Travel time to work - 60 to 89 minutes (% change since 2000)
Travel time to work - 90 or more minutes (%)
Travel time to work - 90 or more minutes (% change since 2000)
Marital status - Never married (%)
Marital status - Now married (%)
Marital status - Separated (%)
Marital status - Widowed (%)
Marital status - Divorced (%)
Median family income ($)
Median family income (% change since 2000)
Median non-family income ($)
Median non-family income (% change since 2000)
Median per capita income ($)
Median per capita income (% change since 2000)
Median family income ($) - White
Median family income ($) - Black or African American
Median family income ($) - Asian
Median family income ($) - Hispanic or Latino
Median family income ($) - American Indian and Alaska Native
Median family income ($) - Multirace
Median family income ($) - Other Race
Median year house/condo built
Median year apartment built
Year house built - Built 2005 or later (%)
Year house built - Built 2000 to 2004 (%)
Year house built - Built 1990 to 1999 (%)
Year house built - Built 1980 to 1989 (%)
Year house built - Built 1970 to 1979 (%)
Year house built - Built 1960 to 1969 (%)
Year house built - Built 1950 to 1959 (%)
Year house built - Built 1940 to 1949 (%)
Year house built - Built 1939 or earlier (%)
Average household size
Household density (households per square mile)
Average household size - White
Average household size - Black or African American
Average household size - Asian
Average household size - Hispanic or Latino
Average household size - American Indian and Alaska Native
Average household size - Multirace
Average household size - Other Race
Occupied housing units (%)
Vacant housing units (%)
Owner occupied housing units (%)
Renter occupied housing units (%)
Vacancy status - For rent (%)
Vacancy status - For sale only (%)
Vacancy status - Rented or sold, not occupied (%)
Vacancy status - For seasonal, recreational, or occasional use (%)
Vacancy status - For migrant workers (%)
Vacancy status - Other vacant (%)
Residents with income below the poverty level (%)
Residents with income below 50% of the poverty level (%)
Children below poverty level (%)
Poor families by family type - Married-couple family (%)
Poor families by family type - Male, no wife present (%)
Poor families by family type - Female, no husband present (%)
Poverty status for native-born residents (%)
Poverty status for foreign-born residents (%)
Poverty among high school graduates not in families (%)
Poverty among people who did not graduate high school not in families (%)
Residents with income below the poverty level (%) - White
Residents with income below the poverty level (%) - Black or African American
Residents with income below the poverty level (%) - Asian
Residents with income below the poverty level (%) - Hispanic or Latino
Residents with income below the poverty level (%) - American Indian and Alaska Native
Residents with income below the poverty level (%) - Multirace
Residents with income below the poverty level (%) - Other Race
Air pollution - Air Quality Index (AQI)
Air pollution - CO
Air pollution - NO2
Air pollution - SO2
Air pollution - Ozone
Air pollution - PM10
Air pollution - PM25
Air pollution - Pb
Crime - Murders per 100,000 population
Crime - Rapes per 100,000 population
Crime - Robberies per 100,000 population
Crime - Assaults per 100,000 population
Crime - Burglaries per 100,000 population
Crime - Thefts per 100,000 population
Crime - Auto thefts per 100,000 population
Crime - Arson per 100,000 population
Crime - City-data.com crime index
Crime - Violent crime index
Crime - Property crime index
Crime - Murders per 100,000 population (5 year average)
Crime - Rapes per 100,000 population (5 year average)
Crime - Robberies per 100,000 population (5 year average)
Crime - Assaults per 100,000 population (5 year average)
Crime - Burglaries per 100,000 population (5 year average)
Crime - Thefts per 100,000 population (5 year average)
Crime - Auto thefts per 100,000 population (5 year average)
Crime - Arson per 100,000 population (5 year average)
Crime - City-data.com crime index (5 year average)
Crime - Violent crime index (5 year average)
Crime - Property crime index (5 year average)
1996 Presidential Elections Results (%) - Democratic Party (Clinton)
1996 Presidential Elections Results (%) - Republican Party (Dole)
1996 Presidential Elections Results (%) - Other
2000 Presidential Elections Results (%) - Democratic Party (Gore)
2000 Presidential Elections Results (%) - Republican Party (Bush)
2000 Presidential Elections Results (%) - Other
2004 Presidential Elections Results (%) - Democratic Party (Kerry)
2004 Presidential Elections Results (%) - Republican Party (Bush)
2004 Presidential Elections Results (%) - Other
2008 Presidential Elections Results (%) - Democratic Party (Obama)
2008 Presidential Elections Results (%) - Republican Party (McCain)
2008 Presidential Elections Results (%) - Other
2012 Presidential Elections Results (%) - Democratic Party (Obama)
2012 Presidential Elections Results (%) - Republican Party (Romney)
2012 Presidential Elections Results (%) - Other
2016 Presidential Elections Results (%) - Democratic Party (Clinton)
2016 Presidential Elections Results (%) - Republican Party (Trump)
2016 Presidential Elections Results (%) - Other
2020 Presidential Elections Results (%) - Democratic Party (Biden)
2020 Presidential Elections Results (%) - Republican Party (Trump)
2020 Presidential Elections Results (%) - Other
Ancestries Reported - Arab (%)
Ancestries Reported - Czech (%)
Ancestries Reported - Danish (%)
Ancestries Reported - Dutch (%)
Ancestries Reported - English (%)
Ancestries Reported - French (%)
Ancestries Reported - French Canadian (%)
Ancestries Reported - German (%)
Ancestries Reported - Greek (%)
Ancestries Reported - Hungarian (%)
Ancestries Reported - Irish (%)
Ancestries Reported - Italian (%)
Ancestries Reported - Lithuanian (%)
Ancestries Reported - Norwegian (%)
Ancestries Reported - Polish (%)
Ancestries Reported - Portuguese (%)
Ancestries Reported - Russian (%)
Ancestries Reported - Scotch-Irish (%)
Ancestries Reported - Scottish (%)
Ancestries Reported - Slovak (%)
Ancestries Reported - Subsaharan African (%)
Ancestries Reported - Swedish (%)
Ancestries Reported - Swiss (%)
Ancestries Reported - Ukrainian (%)
Ancestries Reported - United States (%)
Ancestries Reported - Welsh (%)
Ancestries Reported - West Indian (%)
Ancestries Reported - Other (%)
Educational Attainment - No schooling completed (%)
Educational Attainment - Less than high school (%)
Educational Attainment - High school or equivalent (%)
Educational Attainment - Less than 1 year of college (%)
Educational Attainment - 1 or more years of college (%)
Educational Attainment - Associate degree (%)
Educational Attainment - Bachelor's degree (%)
Educational Attainment - Master's degree (%)
Educational Attainment - Professional school degree (%)
Educational Attainment - Doctorate degree (%)
School Enrollment - Nursery, preschool (%)
School Enrollment - Kindergarten (%)
School Enrollment - Grade 1 to 4 (%)
School Enrollment - Grade 5 to 8 (%)
School Enrollment - Grade 9 to 12 (%)
School Enrollment - College undergrad (%)
School Enrollment - Graduate or professional (%)
School Enrollment - Not enrolled in school (%)
School enrollment - Public schools (%)
School enrollment - Private schools (%)
School enrollment - Not enrolled (%)
Median number of rooms in houses and condos
Median number of rooms in apartments
Housing units lacking complete plumbing facilities (%)
Housing units lacking complete kitchen facilities (%)
Density of houses
Urban houses (%)
Rural houses (%)
Households with people 60 years and over (%)
Households with people 65 years and over (%)
Households with people 75 years and over (%)
Households with one or more nonrelatives (%)
Households with no nonrelatives (%)
Population in households (%)
Family households (%)
Nonfamily households (%)
Population in families (%)
Family households with own children (%)
Median number of bedrooms in owner occupied houses
Mean number of bedrooms in owner occupied houses
Median number of bedrooms in renter occupied houses
Mean number of bedrooms in renter occupied houses
Median number of vehichles in owner occupied houses
Mean number of vehichles in owner occupied houses
Median number of vehichles in renter occupied houses
Mean number of vehichles in renter occupied houses
Mortgage status - with mortgage (%)
Mortgage status - with second mortgage (%)
Mortgage status - with home equity loan (%)
Mortgage status - with both second mortgage and home equity loan (%)
Mortgage status - without a mortgage (%)
Average family size
Average family size - White
Average family size - Black or African American
Average family size - Asian
Average family size - Hispanic or Latino
Average family size - American Indian and Alaska Native
Average family size - Multirace
Average family size - Other Race
Geographical mobility - Same house 1 year ago (%)
Geographical mobility - Moved within same county (%)
Geographical mobility - Moved from different county within same state (%)
Geographical mobility - Moved from different state (%)
Geographical mobility - Moved from abroad (%)
Place of birth - Born in state of residence (%)
Place of birth - Born in other state (%)
Place of birth - Native, outside of US (%)
Place of birth - Foreign born (%)
Housing units in structures - 1, detached (%)
Housing units in structures - 1, attached (%)
Housing units in structures - 2 (%)
Housing units in structures - 3 or 4 (%)
Housing units in structures - 5 to 9 (%)
Housing units in structures - 10 to 19 (%)
Housing units in structures - 20 to 49 (%)
Housing units in structures - 50 or more (%)
Housing units in structures - Mobile home (%)
Housing units in structures - Boat, RV, van, etc. (%)
House/condo owner moved in on average (years ago)
Renter moved in on average (years ago)
Year householder moved into unit - Moved in 1999 to March 2000 (%)
Year householder moved into unit - Moved in 1995 to 1998 (%)
Year householder moved into unit - Moved in 1990 to 1994 (%)
Year householder moved into unit - Moved in 1980 to 1989 (%)
Year householder moved into unit - Moved in 1970 to 1979 (%)
Year householder moved into unit - Moved in 1969 or earlier (%)
Means of transportation to work - Drove car alone (%)
Means of transportation to work - Carpooled (%)
Means of transportation to work - Public transportation (%)
Means of transportation to work - Bus or trolley bus (%)
Means of transportation to work - Streetcar or trolley car (%)
Means of transportation to work - Subway or elevated (%)
Means of transportation to work - Railroad (%)
Means of transportation to work - Ferryboat (%)
Means of transportation to work - Taxicab (%)
Means of transportation to work - Motorcycle (%)
Means of transportation to work - Bicycle (%)
Means of transportation to work - Walked (%)
Means of transportation to work - Other means (%)
Working at home (%)
Industry diversity
Most Common Industries - Agriculture, forestry, fishing and hunting, and mining (%)
Most Common Industries - Agriculture, forestry, fishing and hunting (%)
Most Common Industries - Mining, quarrying, and oil and gas extraction (%)
Most Common Industries - Construction (%)
Most Common Industries - Manufacturing (%)
Most Common Industries - Wholesale trade (%)
Most Common Industries - Retail trade (%)
Most Common Industries - Transportation and warehousing, and utilities (%)
Most Common Industries - Transportation and warehousing (%)
Most Common Industries - Utilities (%)
Most Common Industries - Information (%)
Most Common Industries - Finance and insurance, and real estate and rental and leasing (%)
Most Common Industries - Finance and insurance (%)
Most Common Industries - Real estate and rental and leasing (%)
Most Common Industries - Professional, scientific, and management, and administrative and waste management services (%)
Most Common Industries - Professional, scientific, and technical services (%)
Most Common Industries - Management of companies and enterprises (%)
Most Common Industries - Administrative and support and waste management services (%)
Most Common Industries - Educational services, and health care and social assistance (%)
Most Common Industries - Educational services (%)
Most Common Industries - Health care and social assistance (%)
Most Common Industries - Arts, entertainment, and recreation, and accommodation and food services (%)
Most Common Industries - Arts, entertainment, and recreation (%)
Most Common Industries - Accommodation and food services (%)
Most Common Industries - Other services, except public administration (%)
Most Common Industries - Public administration (%)
Occupation diversity
Most Common Occupations - Management, business, science, and arts occupations (%)
Most Common Occupations - Management, business, and financial occupations (%)
Most Common Occupations - Management occupations (%)
Most Common Occupations - Business and financial operations occupations (%)
Most Common Occupations - Computer, engineering, and science occupations (%)
Most Common Occupations - Computer and mathematical occupations (%)
Most Common Occupations - Architecture and engineering occupations (%)
Most Common Occupations - Life, physical, and social science occupations (%)
Most Common Occupations - Education, legal, community service, arts, and media occupations (%)
Most Common Occupations - Community and social service occupations (%)
Most Common Occupations - Legal occupations (%)
Most Common Occupations - Education, training, and library occupations (%)
Most Common Occupations - Arts, design, entertainment, sports, and media occupations (%)
Most Common Occupations - Healthcare practitioners and technical occupations (%)
Most Common Occupations - Health diagnosing and treating practitioners and other technical occupations (%)
Most Common Occupations - Health technologists and technicians (%)
Most Common Occupations - Service occupations (%)
Most Common Occupations - Healthcare support occupations (%)
Most Common Occupations - Protective service occupations (%)
Most Common Occupations - Fire fighting and prevention, and other protective service workers including supervisors (%)
Most Common Occupations - Law enforcement workers including supervisors (%)
Most Common Occupations - Food preparation and serving related occupations (%)
Most Common Occupations - Building and grounds cleaning and maintenance occupations (%)
Most Common Occupations - Personal care and service occupations (%)
Most Common Occupations - Sales and office occupations (%)
Most Common Occupations - Sales and related occupations (%)
Most Common Occupations - Office and administrative support occupations (%)
Most Common Occupations - Natural resources, construction, and maintenance occupations (%)
Most Common Occupations - Farming, fishing, and forestry occupations (%)
Most Common Occupations - Construction and extraction occupations (%)
Most Common Occupations - Installation, maintenance, and repair occupations (%)
Most Common Occupations - Production, transportation, and material moving occupations (%)
Most Common Occupations - Production occupations (%)
Most Common Occupations - Transportation occupations (%)
Most Common Occupations - Material moving occupations (%)
People in Group quarters - Institutionalized population (%)
People in Group quarters - Correctional institutions (%)
People in Group quarters - Federal prisons and detention centers (%)
People in Group quarters - Halfway houses (%)
People in Group quarters - Local jails and other confinement facilities (including police lockups) (%)
People in Group quarters - Military disciplinary barracks (%)
People in Group quarters - State prisons (%)
People in Group quarters - Other types of correctional institutions (%)
People in Group quarters - Nursing homes (%)
People in Group quarters - Hospitals/wards, hospices, and schools for the handicapped (%)
People in Group quarters - Hospitals/wards and hospices for chronically ill (%)
People in Group quarters - Hospices or homes for chronically ill (%)
People in Group quarters - Military hospitals or wards for chronically ill (%)
People in Group quarters - Other hospitals or wards for chronically ill (%)
People in Group quarters - Hospitals or wards for drug/alcohol abuse (%)
People in Group quarters - Mental (Psychiatric) hospitals or wards (%)
People in Group quarters - Schools, hospitals, or wards for the mentally retarded (%)
People in Group quarters - Schools, hospitals, or wards for the physically handicapped (%)
People in Group quarters - Institutions for the deaf (%)
People in Group quarters - Institutions for the blind (%)
People in Group quarters - Orthopedic wards and institutions for the physically handicapped (%)
People in Group quarters - Wards in general hospitals for patients who have no usual home elsewhere (%)
People in Group quarters - Wards in military hospitals for patients who have no usual home elsewhere (%)
People in Group quarters - Juvenile institutions (%)
People in Group quarters - Long-term care (%)
People in Group quarters - Homes for abused, dependent, and neglected children (%)
People in Group quarters - Residential treatment centers for emotionally disturbed children (%)
People in Group quarters - Training schools for juvenile delinquents (%)
People in Group quarters - Short-term care, detention or diagnostic centers for delinquent children (%)
People in Group quarters - Type of juvenile institution unknown (%)
People in Group quarters - Noninstitutionalized population (%)
People in Group quarters - College dormitories (includes college quarters off campus) (%)
People in Group quarters - Military quarters (%)
People in Group quarters - On base (%)
People in Group quarters - Barracks, unaccompanied personnel housing (UPH), (Enlisted/Officer), ;and similar group living quarters for military personnel (%)
People in Group quarters - Transient quarters for temporary residents (%)
People in Group quarters - Military ships (%)
People in Group quarters - Group homes (%)
People in Group quarters - Homes or halfway houses for drug/alcohol abuse (%)
People in Group quarters - Homes for the mentally ill (%)
People in Group quarters - Homes for the mentally retarded (%)
People in Group quarters - Homes for the physically handicapped (%)
People in Group quarters - Other group homes (%)
People in Group quarters - Religious group quarters (%)
People in Group quarters - Dormitories (%)
People in Group quarters - Agriculture workers' dormitories on farms (%)
People in Group quarters - Job Corps and vocational training facilities (%)
People in Group quarters - Other workers' dormitories (%)
People in Group quarters - Crews of maritime vessels (%)
People in Group quarters - Other nonhousehold living situations (%)
People in Group quarters - Other noninstitutional group quarters (%)
Residents speaking English at home (%)
Residents speaking English at home - Born in the United States (%)
Residents speaking English at home - Native, born elsewhere (%)
Residents speaking English at home - Foreign born (%)
Residents speaking Spanish at home (%)
Residents speaking Spanish at home - Born in the United States (%)
Residents speaking Spanish at home - Native, born elsewhere (%)
Residents speaking Spanish at home - Foreign born (%)
Residents speaking other language at home (%)
Residents speaking other language at home - Born in the United States (%)
Residents speaking other language at home - Native, born elsewhere (%)
Residents speaking other language at home - Foreign born (%)
Class of Workers - Employee of private company (%)
Class of Workers - Self-employed in own incorporated business (%)
Class of Workers - Private not-for-profit wage and salary workers (%)
Class of Workers - Local government workers (%)
Class of Workers - State government workers (%)
Class of Workers - Federal government workers (%)
Class of Workers - Self-employed workers in own not incorporated business and Unpaid family workers (%)
House heating fuel used in houses and condos - Utility gas (%)
House heating fuel used in houses and condos - Bottled, tank, or LP gas (%)
House heating fuel used in houses and condos - Electricity (%)
House heating fuel used in houses and condos - Fuel oil, kerosene, etc. (%)
House heating fuel used in houses and condos - Coal or coke (%)
House heating fuel used in houses and condos - Wood (%)
House heating fuel used in houses and condos - Solar energy (%)
House heating fuel used in houses and condos - Other fuel (%)
House heating fuel used in houses and condos - No fuel used (%)
House heating fuel used in apartments - Utility gas (%)
House heating fuel used in apartments - Bottled, tank, or LP gas (%)
House heating fuel used in apartments - Electricity (%)
House heating fuel used in apartments - Fuel oil, kerosene, etc. (%)
House heating fuel used in apartments - Coal or coke (%)
House heating fuel used in apartments - Wood (%)
House heating fuel used in apartments - Solar energy (%)
House heating fuel used in apartments - Other fuel (%)
House heating fuel used in apartments - No fuel used (%)
Armed forces status - In Armed Forces (%)
Armed forces status - Civilian (%)
Armed forces status - Civilian - Veteran (%)
Armed forces status - Civilian - Nonveteran (%)
Fatal accidents locations in years 2005-2021
Fatal accidents locations in 2005
Fatal accidents locations in 2006
Fatal accidents locations in 2007
Fatal accidents locations in 2008
Fatal accidents locations in 2009
Fatal accidents locations in 2010
Fatal accidents locations in 2011
Fatal accidents locations in 2012
Fatal accidents locations in 2013
Fatal accidents locations in 2014
Fatal accidents locations in 2015
Fatal accidents locations in 2016
Fatal accidents locations in 2017
Fatal accidents locations in 2018
Fatal accidents locations in 2019
Fatal accidents locations in 2020
Fatal accidents locations in 2021
Alcohol use - People drinking some alcohol every month (%)
Alcohol use - People not drinking at all (%)
Alcohol use - Average days/month drinking alcohol
Alcohol use - Average drinks/week
Alcohol use - Average days/year people drink much
Audiometry - Average condition of hearing (%)
Audiometry - People that can hear a whisper from across a quiet room (%)
Audiometry - People that can hear normal voice from across a quiet room (%)
Audiometry - Ears ringing, roaring, buzzing (%)
Audiometry - Had a job exposure to loud noise (%)
Audiometry - Had off-work exposure to loud noise (%)
Blood Pressure & Cholesterol - Has high blood pressure (%)
Blood Pressure & Cholesterol - Checking blood pressure at home (%)
Blood Pressure & Cholesterol - Frequently checking blood cholesterol (%)
Blood Pressure & Cholesterol - Has high cholesterol level (%)
Consumer Behavior - Money monthly spent on food at supermarket/grocery store
Consumer Behavior - Money monthly spent on food at other stores
Consumer Behavior - Money monthly spent on eating out
Consumer Behavior - Money monthly spent on carryout/delivered foods
Consumer Behavior - Income spent on food at supermarket/grocery store (%)
Consumer Behavior - Income spent on food at other stores (%)
Consumer Behavior - Income spent on eating out (%)
Consumer Behavior - Income spent on carryout/delivered foods (%)
Current Health Status - General health condition (%)
Current Health Status - Blood donors (%)
Current Health Status - Has blood ever tested for HIV virus (%)
Current Health Status - Left-handed people (%)
Dermatology - People using sunscreen (%)
Diabetes - Diabetics (%)
Diabetes - Had a blood test for high blood sugar (%)
Diabetes - People taking insulin (%)
Diet Behavior & Nutrition - Diet health (%)
Diet Behavior & Nutrition - Milk product consumption (# of products/month)
Diet Behavior & Nutrition - Meals not home prepared (#/week)
Diet Behavior & Nutrition - Meals from fast food or pizza place (#/week)
Diet Behavior & Nutrition - Ready-to-eat foods (#/month)
Diet Behavior & Nutrition - Frozen meals/pizza (#/month)
Drug Use - People that ever used marijuana or hashish (%)
Drug Use - Ever used hard drugs (%)
Drug Use - Ever used any form of cocaine (%)
Drug Use - Ever used heroin (%)
Drug Use - Ever used methamphetamine (%)
Health Insurance - People covered by health insurance (%)
Kidney Conditions-Urology - Avg. # of times urinating at night
Medical Conditions - People with asthma (%)
Medical Conditions - People with anemia (%)
Medical Conditions - People with psoriasis (%)
Medical Conditions - People with overweight (%)
Medical Conditions - Elderly people having difficulties in thinking or remembering (%)
Medical Conditions - People who ever received blood transfusion (%)
Medical Conditions - People having trouble seeing even with glass/contacts (%)
Medical Conditions - People with arthritis (%)
Medical Conditions - People with gout (%)
Medical Conditions - People with congestive heart failure (%)
Medical Conditions - People with coronary heart disease (%)
Medical Conditions - People with angina pectoris (%)
Medical Conditions - People who ever had heart attack (%)
Medical Conditions - People who ever had stroke (%)
Medical Conditions - People with emphysema (%)
Medical Conditions - People with thyroid problem (%)
Medical Conditions - People with chronic bronchitis (%)
Medical Conditions - People with any liver condition (%)
Medical Conditions - People who ever had cancer or malignancy (%)
Mental Health - People who have little interest in doing things (%)
Mental Health - People feeling down, depressed, or hopeless (%)
Mental Health - People who have trouble sleeping or sleeping too much (%)
Mental Health - People feeling tired or having little energy (%)
Mental Health - People with poor appetite or overeating (%)
Mental Health - People feeling bad about themself (%)
Mental Health - People who have trouble concentrating on things (%)
Mental Health - People moving or speaking slowly or too fast (%)
Mental Health - People having thoughts they would be better off dead (%)
Oral Health - Average years since last visit a dentist
Oral Health - People embarrassed because of mouth (%)
Oral Health - People with gum disease (%)
Oral Health - General health of teeth and gums (%)
Oral Health - Average days a week using dental floss/device
Oral Health - Average days a week using mouthwash for dental problem
Oral Health - Average number of teeth
Pesticide Use - Households using pesticides to control insects (%)
Pesticide Use - Households using pesticides to kill weeds (%)
Physical Activity - People doing vigorous-intensity work activities (%)
Physical Activity - People doing moderate-intensity work activities (%)
Physical Activity - People walking or bicycling (%)
Physical Activity - People doing vigorous-intensity recreational activities (%)
Physical Activity - People doing moderate-intensity recreational activities (%)
Physical Activity - Average hours a day doing sedentary activities
Physical Activity - Average hours a day watching TV or videos
Physical Activity - Average hours a day using computer
Physical Functioning - People having limitations keeping them from working (%)
Physical Functioning - People limited in amount of work they can do (%)
Physical Functioning - People that need special equipment to walk (%)
Physical Functioning - People experiencing confusion/memory problems (%)
Physical Functioning - People requiring special healthcare equipment (%)
Prescription Medications - Average number of prescription medicines taking
Preventive Aspirin Use - Adults 40+ taking low-dose aspirin (%)
Reproductive Health - Vaginal deliveries (%)
Reproductive Health - Cesarean deliveries (%)
Reproductive Health - Deliveries resulted in a live birth (%)
Reproductive Health - Pregnancies resulted in a delivery (%)
Reproductive Health - Women breastfeeding newborns (%)
Reproductive Health - Women that had a hysterectomy (%)
Reproductive Health - Women that had both ovaries removed (%)
Reproductive Health - Women that have ever taken birth control pills (%)
Reproductive Health - Women taking birth control pills (%)
Reproductive Health - Women that have ever used Depo-Provera or injectables (%)
Reproductive Health - Women that have ever used female hormones (%)
Sexual Behavior - People 18+ that ever had sex (vaginal, anal, or oral) (%)
Sexual Behavior - Males 18+ that ever had vaginal sex with a woman (%)
Sexual Behavior - Males 18+ that ever performed oral sex on a woman (%)
Sexual Behavior - Males 18+ that ever had anal sex with a woman (%)
Sexual Behavior - Males 18+ that ever had any sex with a man (%)
Sexual Behavior - Females 18+ that ever had vaginal sex with a man (%)
Sexual Behavior - Females 18+ that ever performed oral sex on a man (%)
Sexual Behavior - Females 18+ that ever had anal sex with a man (%)
Sexual Behavior - Females 18+ that ever had any kind of sex with a woman (%)
Sexual Behavior - Average age people first had sex
Sexual Behavior - Average number of female sex partners in lifetime (males 18+)
Sexual Behavior - Average number of female vaginal sex partners in lifetime (males 18+)
Sexual Behavior - Average age people first performed oral sex on a woman (18+)
Sexual Behavior - Average number of woman performed oral sex on in lifetime (18+)
Sexual Behavior - Average number of male sex partners in lifetime (males 18+)
Sexual Behavior - Average number of male anal sex partners in lifetime (males 18+)
Sexual Behavior - Average age people first performed oral sex on a man (18+)
Sexual Behavior - Average number of male oral sex partners in lifetime (18+)
Sexual Behavior - People using protection when performing oral sex (%)
Sexual Behavior - Average number of times people have vaginal or anal sex a year
Sexual Behavior - People having sex without condom (%)
Sexual Behavior - Average number of male sex partners in lifetime (females 18+)
Sexual Behavior - Average number of male vaginal sex partners in lifetime (females 18+)
Sexual Behavior - Average number of female sex partners in lifetime (females 18+)
Sexual Behavior - Circumcised males 18+ (%)
Sleep Disorders - Average hours sleeping at night
Sleep Disorders - People that has trouble sleeping (%)
Smoking-Cigarette Use - People smoking cigarettes (%)
Taste & Smell - People 40+ having problems with smell (%)
Taste & Smell - People 40+ having problems with taste (%)
Taste & Smell - People 40+ that ever had wisdom teeth removed (%)
Taste & Smell - People 40+ that ever had tonsils teeth removed (%)
Taste & Smell - People 40+ that ever had a loss of consciousness because of a head injury (%)
Taste & Smell - People 40+ that ever had a broken nose or other serious injury to face or skull (%)
Taste & Smell - People 40+ that ever had two or more sinus infections (%)
Weight - Average height (inches)
Weight - Average weight (pounds)
Weight - Average BMI
Weight - People that are obese (%)
Weight - People that ever were obese (%)
Weight - People trying to lose weight (%)
Urban population: 25,387
Rural population: 1,985
Estimated median house/condo value in 2022: $221,156
29617:
$221,156South Carolina:
$254,600
According to our research of South Carolina and other state lists, there were 6 registered sex offenders living in 29617 zip code as of April 19, 2024 . The ratio of all residents to sex offenders in zip code 29617 is 4,581 to 1.The ratio of registered sex offenders to all residents in this zip code is much lower than the state average.
Median resident age: This zip code:
41.2 yearsSouth Carolina median age:
40.5 years
Average household size: This zip code:
2.4 peopleSouth Carolina:
2.4 people
Averages for the 2020 tax year for zip code 29617, filed in 2021:
Average Adjusted Gross Income (AGI) in 2020: $51,670 (Individual Income Tax Returns) Here:
$51,670State:
$65,754
Salary/wage: $42,423 (reported on 78.5% of returns )Here:
$42,423State:
$52,566
(% of AGI for various income ranges: 1201.7% for AGIs below $25k , 3796.4% for AGIs $25k-50k , 6922.9% for AGIs $50k-75k , 9651.8% for AGIs $75k-100k , 16428.4% for AGIs $100k-200k , 66507.1% for AGIs over 200k ) Taxable interest for individuals: $1,632 (reported on 21.2% of returns )This zip code:
$1,632South Carolina:
$1,749
(% of AGI for various income ranges: 10.4% for AGIs below $25k , 15.7% for AGIs $25k-50k , 36.7% for AGIs $50k-75k , 66.6% for AGIs $75k-100k , 175.5% for AGIs $100k-200k , 2490.0% for AGIs over 200k ) Ordinary dividends: $7,218 (reported on 14.2% of returns )(% of AGI for various income ranges: 18.3% for AGIs below $25k , 31.8% for AGIs $25k-50k , 105.1% for AGIs $50k-75k , 218.8% for AGIs $75k-100k , 631.1% for AGIs $100k-200k , 7597.1% for AGIs over 200k ) Net capital gain/loss in AGI: +$14,229 (reported on 12.7% of returns )Here:
+$14,229State:
+$24,194
(% of AGI for various income ranges: 5.3% for AGIs below $25k , 22.2% for AGIs $25k-50k , 88.9% for AGIs $50k-75k , 237.7% for AGIs $75k-100k , 798.2% for AGIs $100k-200k , 21065.7% for AGIs over 200k ) Profit/loss from business: +$10,152 (reported on 20.0% of returns )Here:
+$10,152State:
+$11,253
(% of AGI for various income ranges: 212.9% for AGIs below $25k , 210.6% for AGIs $25k-50k , 254.0% for AGIs $50k-75k , 281.8% for AGIs $75k-100k , 718.2% for AGIs $100k-200k , 5138.6% for AGIs over 200k ) Taxable individual retirement arrangement distribution: $21,194 (reported on 8.9% of returns )29617:
$21,194South Carolina:
$21,604
(% of AGI for various income ranges: 55.5% for AGIs below $25k , 95.3% for AGIs $25k-50k , 262.5% for AGIs $50k-75k , 537.1% for AGIs $75k-100k , 1459.8% for AGIs $100k-200k , 6782.9% for AGIs over 200k ) Total itemized deductions: $38,862 (reported on 5.8% of returns )Here:
$38,862State:
$35,199
(% of AGI for various income ranges: 32.6% for AGIs below $25k , 90.3% for AGIs $25k-50k , 299.1% for AGIs $50k-75k , 560.2% for AGIs $75k-100k , 1462.4% for AGIs $100k-200k , 13772.9% for AGIs over 200k ) Charity contributions: $15,087 (reported on 4.9% of returns )Here:
$15,087State:
$14,319
(% of AGI for various income ranges: 3.5% for AGIs below $25k , 15.9% for AGIs $25k-50k , 54.6% for AGIs $50k-75k , 104.1% for AGIs $75k-100k , 461.3% for AGIs $100k-200k , 6852.9% for AGIs over 200k ) Taxes paid: $6,470 (reported on 5.8% of returns )(% of AGI for various income ranges: 2.3% for AGIs below $25k , 12.8% for AGIs $25k-50k , 50.0% for AGIs $50k-75k , 95.9% for AGIs $75k-100k , 320.9% for AGIs $100k-200k , 1902.9% for AGIs over 200k ) Earned income credit: $2,439 (reported on 22.2% of returns )(% of AGI for various income ranges: 125.2% for AGIs below $25k , 83.8% for AGIs $25k-50k , 1.3% for AGIs $50k-75k ) Percentage of individuals using paid preparers for their 2020 taxes: 90.8%(% for various income ranges: 87.5% for AGIs below $25k , 92.2% for AGIs $25k-50k , 92.4% for AGIs $50k-75k , 94.5% for AGIs $75k-100k , 94.4% for AGIs $100k-200k , 96.2% for AGIs over 200k )
Averages for the 2012 tax year for zip code 29617, filed in 2013:
Average Adjusted Gross Income (AGI) in 2012: $38,832 (Individual Income Tax Returns) Here:
$38,832State:
$51,133
Salary/wage: $33,652 (reported on 84.0% of returns )Here:
$33,652State:
$42,173
(% of AGI for various income ranges: 79.1% for AGIs below $25k , 83.5% for AGIs $25k-50k , 75.9% for AGIs $50k-75k , 71.8% for AGIs $75k-100k , 65.9% for AGIs $100k-200k , 45.2% for AGIs over 200k ) Taxable interest for individuals: $1,243 (reported on 19.9% of returns )This zip code:
$1,243South Carolina:
$1,468
(% of AGI for various income ranges: 0.7% for AGIs below $25k , 0.3% for AGIs $25k-50k , 0.5% for AGIs $50k-75k , 0.5% for AGIs $75k-100k , 0.9% for AGIs $100k-200k , 1.2% for AGIs over 200k ) Ordinary dividends: $7,299 (reported on 11.9% of returns )(% of AGI for various income ranges: 0.8% for AGIs below $25k , 0.7% for AGIs $25k-50k , 1.5% for AGIs $50k-75k , 1.5% for AGIs $75k-100k , 2.6% for AGIs $100k-200k , 9.3% for AGIs over 200k ) Net capital gain/loss in AGI: +$6,015 (reported on 9.1% of returns )Here:
+$6,015State:
+$13,061
(% of AGI for various income ranges: 0.5% for AGIs $50k-75k , 0.8% for AGIs $75k-100k , 1.5% for AGIs $100k-200k , 8.6% for AGIs over 200k ) Profit/loss from business: +$8,207 (reported on 15.4% of returns )Here:
+$8,207State:
+$10,167
(% of AGI for various income ranges: 9.2% for AGIs below $25k , 2.4% for AGIs $25k-50k , 2.1% for AGIs $50k-75k , 1.5% for AGIs $75k-100k , 2.1% for AGIs $100k-200k , 1.6% for AGIs over 200k ) Taxable individual retirement arrangement distribution: $14,440 (reported on 9.0% of returns )29617:
$14,440South Carolina:
$17,019
(% of AGI for various income ranges: 2.3% for AGIs below $25k , 2.4% for AGIs $25k-50k , 3.5% for AGIs $50k-75k , 5.1% for AGIs $75k-100k , 4.9% for AGIs $100k-200k , 2.6% for AGIs over 200k ) Self-employment retirement plans: $14,750 (reported on 0.2% of returns )29617:
$14,750South Carolina:
$21,023
Total itemized deductions: $20,349 (24% of AGI, reported on 22.2% of returns )Here:
$20,349State:
$22,890
Here:
24.1% of AGIState:
21.4% of AGI
(% of AGI for various income ranges: 4.8% for AGIs below $25k , 9.6% for AGIs $25k-50k , 12.2% for AGIs $50k-75k , 15.1% for AGIs $75k-100k , 16.3% for AGIs $100k-200k , 14.6% for AGIs over 200k ) Charity contributions: $5,737 (reported on 19.0% of returns )(% of AGI for various income ranges: 0.7% for AGIs below $25k , 2.5% for AGIs $25k-50k , 2.4% for AGIs $50k-75k , 3.3% for AGIs $75k-100k , 3.9% for AGIs $100k-200k , 4.9% for AGIs over 200k ) Taxes paid: $6,144 (reported on 21.5% of returns )(% of AGI for various income ranges: 0.8% for AGIs below $25k , 1.8% for AGIs $25k-50k , 3.2% for AGIs $50k-75k , 4.8% for AGIs $75k-100k , 5.9% for AGIs $100k-200k , 6.0% for AGIs over 200k ) Earned income credit: $2,535 (reported on 25.3% of returns )(% of AGI for various income ranges: 8.2% for AGIs below $25k , 1.2% for AGIs $25k-50k ) Percentage of individuals using paid preparers for their 2012 taxes: 55.6%(% for various income ranges: 55.2% for AGIs below $25k , 54.1% for AGIs $25k-50k , 56.9% for AGIs $50k-75k , 55.7% for AGIs $75k-100k , 60.0% for AGIs $100k-200k , 81.8% for AGIs over 200k )
Averages for the 2004 tax year for zip code 29617, filed in 2005:
Average Adjusted Gross Income (AGI) in 2004: $34,451 (Individual Income Tax Returns) Here:
$34,451State:
$41,965
Salary/wage: $30,462 (reported on 85.8% of returns )Here:
$30,462State:
$35,695
(% of AGI for various income ranges: 102.0% for AGIs below $10k , 80.3% for AGIs $10k-25k , 84.4% for AGIs $25k-50k , 82.3% for AGIs $50k-75k , 78.8% for AGIs $75k-100k , 51.1% for AGIs over 100k ) Taxable interest for individuals: $1,564 (reported on 30.9% of returns )This zip code:
$1,564South Carolina:
$1,623
(% of AGI for various income ranges: 6.4% for AGIs below $10k , 1.2% for AGIs $10k-25k , 0.9% for AGIs $25k-50k , 0.9% for AGIs $50k-75k , 1.3% for AGIs $75k-100k , 2.2% for AGIs over 100k ) Taxable dividends: $3,131 (reported on 15.4% of returns )(% of AGI for various income ranges: 2.2% for AGIs below $10k , 1.0% for AGIs $10k-25k , 0.8% for AGIs $25k-50k , 0.7% for AGIs $50k-75k , 1.1% for AGIs $75k-100k , 3.2% for AGIs over 100k ) Net capital gain/loss: +$7,969 (reported on 11.5% of returns )Here:
+$7,969State:
+$13,100
(% of AGI for various income ranges: -0.1% for AGIs below $10k , 0.4% for AGIs $10k-25k , 0.2% for AGIs $25k-50k , 0.6% for AGIs $50k-75k , 1.5% for AGIs $75k-100k , 10.3% for AGIs over 100k ) Profit/loss from business: +$7,102 (reported on 14.1% of returns )Here:
+$7,102State:
+$9,144
(% of AGI for various income ranges: 6.1% for AGIs below $10k , 5.2% for AGIs $10k-25k , 2.2% for AGIs $25k-50k , 1.4% for AGIs $50k-75k , 1.3% for AGIs $75k-100k , 4.2% for AGIs over 100k ) IRA payment deduction: $2,545 (reported on 1.8% of returns )29617:
$2,545South Carolina:
$2,972
(% of AGI for various income ranges: 0.1% for AGIs $10k-25k , 0.2% for AGIs $25k-50k , 0.2% for AGIs $50k-75k , 0.1% for AGIs over 100k ) Self-employed pension: $9,696 (reported on 0.3% of returns )Here:
$9,696South Carolina:
$15,117
Total itemized deductions: $16,559 (24% of AGI, reported on 28.7% of returns )Here:
$16,559State:
$19,039
Here:
24.4% of AGIState:
22.8% of AGI
(% of AGI for various income ranges: 8.0% for AGIs below $10k , 6.7% for AGIs $10k-25k , 12.3% for AGIs $25k-50k , 16.6% for AGIs $50k-75k , 18.1% for AGIs $75k-100k , 16.4% for AGIs over 100k ) Charity contributions deductions: $4,146 (6% of AGI, reported on 25.4% of returns )Here:
5.8% of AGIState:
5.0% of AGI
(% of AGI for various income ranges: 0.8% for AGIs below $10k , 1.2% for AGIs $10k-25k , 2.3% for AGIs $25k-50k , 3.6% for AGIs $50k-75k , 4.0% for AGIs $75k-100k , 4.6% for AGIs over 100k ) Total tax: $4,572 (reported on 68.0% of returns )(% of AGI for various income ranges: 3.4% for AGIs below $10k , 3.4% for AGIs $10k-25k , 6.1% for AGIs $25k-50k , 8.3% for AGIs $50k-75k , 10.1% for AGIs $75k-100k , 17.6% for AGIs over 100k ) Earned income credit: $1,852 (reported on 22.6% of returns )Percentage of individuals using paid preparers for their 2004 taxes: 68.5%(% for various income ranges: 63.2% for AGIs below $10k , 72.5% for AGIs $10k-25k , 67.9% for AGIs $25k-50k , 68.9% for AGIs $50k-75k , 63.5% for AGIs $75k-100k , 73.3% for AGIs over 100k )
Estimated median household income in 2022: This zip code:
$51,370South Carolina:
$64,115
Nearest zip codes: 29613 ,
29609 ,
29611 ,
29601 ,
29614 ,
29640 .
Travelers Rest Zip Code Map
Percentage of family households: This zip code:
41.2%South Carolina:
44.7%
Percentage of households with unmarried partners: This zip code:
6.8%South Carolina:
47.7%
Likely homosexual households (counted as self-reported same-sex unmarried-partner households)
Lesbian couples: 0.3% of all households Gay men: 0.3% of all households
Household received Food Stamps/SNAP in the past 12 months: 1,270Household did not receive Food Stamps/SNAP in the past 12 months: 10,174
Women who had a birth in the past 12 months: 437 (195 now married , 229 unmarried) Women who did not have a birth in the past 12 months: 5,238 (2,058 now married , 3,173 unmarried)
Housing units in zip code 29617 with a mortgage: 4,325 (367
second mortgage , 317
both second mortgage and home equity loan )
Houses without a mortgage: 131
Median monthly owner costs for units with a mortgage: $1,141
Median monthly owner costs for units without a mortgage: $360
Residents with income below the poverty level in 2022:
This zip code:
17.0%Whole state:
14.0%
Residents with income below 50% of the poverty level in 2022:
This zip code:
10.0%Whole state:
7.3%
Median number of rooms in houses and condos: Median number of rooms in apartments: Notable locations in this zip code not listed on our city pages
Click to draw/clear zip code borders Notable locations in zip code 29617: (A) , Green Valley Country Club (B) , Holly Ridge Golf Course (C) , Berea Fire Department Old Hunt's Bridge (D) . Display/hide their locations on the map
Shopping Centers: (1) , Cedar Lane Shopping Center (2) , Centre West Shopping Center (3) , University Square Shopping Center (4) , Westowne Shopping Center (5) , Westwood Shopping Center (6) . Display/hide their locations on the map
Churches in zip code 29617 include: (A) , Forestville Church (B) , Union Bleachery Baptist Church (C) , Arlington Memorial Methodist Church (D) , Mount Sinai Church (E) , Reedy River Church (F) . Display/hide their locations on the map
Cemetery: (1) . Display/hide its location on the map
Lakes and reservoirs: (A) , Hunts Lake (B) , Rich Pond (C) , Belue Lake (D) , Huffs Lake (E) , Cone Mill Pond (F) , Twin Lakes (G) . Display/hide their locations on the map
Creeks: (A) , Little Creek (B) , Coopers Creek (C) , Armstrong Creek (D) . Display/hide their locations on the map
Park in zip code 29617: (1) . Display/hide its location on the map
Tourist attraction (not listed on the city page) : (1) . Display/hide its approximate location on the map
Year house built (houses)
130 2020 or later1,502 2010 to 20192,031 2000 to 20091,151 1990 to 19991,311 1980 to 19891,819 1970 to 19791,791 1960 to 19691,187 1950 to 1959366 1940 to 1949269 1939 or earlier
Zip code 29617 household income distribution in 2022 691 Less than $10,000790 $10,000 to $14,999539 $15,000 to $19,999372 $20,000 to $24,999458 $25,000 to $29,999900 $30,000 to $34,999536 $35,000 to $39,999771 $40,000 to $44,999516 $45,000 to $49,999831 $50,000 to $59,9991,017 $60,000 to $74,9991,819 $75,000 to $99,999664 $100,000 to $124,999479 $125,000 to $149,999629 $150,000 to $199,999458 $200,000 or moreEstimate of home value of owner-occupied houses/condos in 2022 in zip code 29617 107 Less than $10,00060 $10,000 to $14,99965 $15,000 to $19,99988 $20,000 to $24,99976 $25,000 to $29,99939 $30,000 to $34,99923 $35,000 to $39,99937 $40,000 to $49,999107 $50,000 to $59,99973 $60,000 to $69,99914 $70,000 to $79,999124 $80,000 to $89,999196 $90,000 to $99,999629 $100,000 to $124,999313 $125,000 to $149,999707 $150,000 to $174,999820 $175,000 to $199,999950 $200,000 to $249,999838 $250,000 to $299,999752 $300,000 to $399,999405 $400,000 to $499,999298 $500,000 to $749,999400 $750,000 to $999,99936 $1,000,000 to $1,499,99933 $2,000,000 or moreRent paid by renters in 2022 in zip code 29617 9 $100 to $149117 $150 to $19966 $200 to $24916 $250 to $29979 $350 to $399112 $400 to $44951 $450 to $499153 $500 to $549142 $550 to $599233 $600 to $649172 $650 to $699508 $700 to $749209 $750 to $799664 $800 to $899434 $900 to $999318 $1,000 to $1,2498 $1,250 to $1,499103 $1,500 to $1,99948 $2,000 to $2,49947 $3,500 or more107 No cash rent
Median gross rent in 2022: $992.
Median price asked for vacant for-sale houses and condos in 2022: $540,623.
Estimated median house (or condo) value in 2022 for: White Non-Hispanic householders: $229,428Black or African American householders: $262,794American Indian or Alaska Native householders: $206,816Asian householders: $218,949Some other race householders: $218,949Two or more races householders: $236,598Hispanic or Latino householders: $305,812Estimated median house or condo value in 2022: $221,156
29617:
$221,156South Carolina:
$254,600
Lower value quartile - upper value quartile: $146,046 - $307,793
Mean price in 2022: Detached houses: $379,504Here:
$379,504State:
$368,255
Townhouses or other attached units: $205,887Here:
$205,887State:
$292,023
In 2-unit structures: $170,935Here:
$170,935State:
$358,283
In 3-to-4-unit structures: $288,960Here:
$288,960State:
$230,702
In 5-or-more-unit structures: $589,421Here:
$589,421State:
$326,361
Mobile homes: $137,022Here:
$137,022State:
$102,531
Occupied boats, RVs, vans, etc.: $23,186Here:
$23,186State:
$132,484
Housing units in structures:
One, detached: 7,967One, attached: 464Two: 3423 or 4: 3235 to 9: 60810 to 19: 50920 to 49: 27450 or more: 243Mobile homes: 1,160Boats, RVs, vans, etc.: 12Unemployment : 4.6%
Means of transportation to work in zip code 29617 69.7% 8,957 Drove a car alone15.1% 1,947 Carpooled0.4% 53 Bus or trolley bus0.0% 1 Taxi0.5% 68 Walked2.9% 368 Other means12.0% 1,545 Worked at homeTravel time to work (commute) in zip code 29617 132 Less than 5 minutes614 5 to 9 minutes1,807 10 to 14 minutes1,413 15 to 19 minutes2,001 20 to 24 minutes719 25 to 29 minutes2,595 30 to 34 minutes198 35 to 39 minutes473 40 to 44 minutes699 45 to 59 minutes369 60 to 89 minutes308 90 or more minutes
Percentage of zip code residents living and working in this county: 86.4%
Household type by relationship:
Households: 27,373
Male householders: 5,904 (1,272 living alone ), Female householders: 5,527 (2,100 living alone )4,751 spouses (4,710 opposite-sex spouses ), 1,095 unmarried partners , (1,064 opposite-sex unmarried partners ), 6,673 children (6,074 natural , 139 adopted , 467 stepchildren ), 480 grandchildren , 344 brothers or sisters , 772 parents , 0 foster children , 514 other relatives , 829 non-relatives In group quarters: 421 (-1 institutionalized population )
Size of family households: 3,416 2-persons , 1,512 3-persons , 1,440 4-persons , 533 5-persons , 189 6-persons , 97 7-or-more-persons
Size of nonfamily households: 3,375 1-person , 730 2-persons , 113 3-persons , 17 4-persons
2,687 married couples with children. single-parent households (831 men , 1,262 women ).
77.8% of residents of 29617 zip code speak English at home. of residents speak Spanish at home (39% very well, 19% well, 27% not well, 15% not at all ).of residents speak other Indo-European language at home (78% very well, 15% well, 6% not well ).of residents speak Asian or Pacific Island language at home (44% very well, 19% well, 37% not well ).of residents speak other language at home (17% very well, 41% well, 24% not well, 19% not at all ).
Foreign born population: 3,854 (14.1%)
(17.0%
of them are naturalized citizens )
This zip code:
14.1%Whole state:
5.2%
32% Honduras 20% Chile 17% Guatemala 13% El Salvador 2% Togo 1% Malaysia 1% Sweden 16% American 9% English 5% Irish 3% Scottish 2% Scotch-Irish 1% German 1% Italian
Year of entry for the foreign-born population
1,855 2010 or later 1,293 2000 to 2009 939 1990 to 1999 407 Before 1990
There are
25 Medical Specialists in Zip Code 29617 .
Facilities with environmental interests located in this zip code:
CAROLINAS RECYCLING GROUP LLC BEREA (7 PINSLEY CIR in GREENVILLE, SC)
Large Quantity Generators, more that 1000 kg of hazardous waste/month (Resource Conservation and Recovery Act (tracking hazardous waste)) STATE MASTER (South Carolina database) - AIR PROGRAM, National Pollutant Discharge Elimination System Permit Alternative names: CAROLINAS RECYCLING GROUP PINSLEY CIR FA
AMERICAN WOOD WORKS (1 EAST MAIN STREET in GREENVILLE, SC)
AIR MINOR (AIRS/AFS) STATE MASTER (South Carolina database) - AIR MAJOR, AIR PROGRAM, Business SIC classification: WOOD OFFICE AND STORE FIXTURES, PARTITIONS, SHELVING, AND LOCKERS; SERVICESAlternative names: AMERICAN WOODWORKS - GREENVILLE
BEREA ELEMENTARY SCHOOL (100 BEREA DRIVE in GREENVILLE, SC)
(Geographic Names Information System) (National Center for Education Statistics) - STATE ID-2301036 Organizations: GREENVILLE COUNTY SCHOOL DISTRICT (SCHOOL DISTRICT)
Housing units lacking complete plumbing facilities: 0.5%
Housing units lacking complete kitchen facilities: 1.0%
63.8% Electricity 32.5% Utility gas 2.1% Bottled, tank, or LP gas 0.6% Fuel oil, kerosene, etc.
Place of birth for U.S.-born residents:
This state: 15,141Northeast: 2,061Midwest: 1,466South: 3,524West: 582
57% of the 29617 zip code residents lived in the same house 5 years ago.
Out of people who lived in different houses, 64% lived in this county.
Out of people who lived in different counties, 50% lived in South Carolina.
89% of the 29617 zip code residents lived in the same house 1 year ago.
Out of people who lived in different houses, 55% moved from this county.
Out of people who lived in different houses, 13% moved from different county within same state.
Out of people who lived in different houses, 21% moved from different state.
Out of people who lived in different houses, 5% moved from abroad.
Private vs. public school enrollment:
Students in private schools in grades 1 to 8 (elementary and middle school): 448
Here:
20.7%South Carolina:
14.4%
Students in private schools in grades 9 to 12 (high school): 244
Here:
18.0%South Carolina:
11.1%
Students in private undergraduate colleges: 270
Here:
42.0%South Carolina:
21.9%
Occupation by median earnings in the past 12 months ($)
108,740 Legal occupations 97,931 Computer and mathematical occupations 66,871 Law enforcement workers including supervisors 64,132 Architecture and engineering occupations 56,256 Health diagnosing and treating practitioners and other technical occupations 54,637 Management occupations
Companies with federal contracts located in this zip code:
COMMUNICATION SERVICE CENTER, (4 SULPHUR SPRINGS ROAD in GREENVILLE, SC; small business) employees , $0 revenue . : $50,002 in 2 contracts in 2004
$25,001 with Army for Installation of Equipment -- Musical Instruments, Phonographs, and Home-Type Radios. Taking place in GA. Signed on 2004-11-19. Completion date: 2004-12-30.
with U.S. Army Corps of Engineers - civil program financing only for Installation of Equipment -- Musical Instruments, Phonographs, and Home-Type Radios. Taking place in GA. Signed on 2004-11-19. Completion date: 2004-12-30.
Top industries in this zip code by the number of employees in 2005:
Health Care and Social Assistance: Nursing Care Facilities (100-249 employees: 2 establishments)Other Services (except Public Administration): Religious Organizations (20-49: 1, 10-19: 5, 5-9: 4, 1-4: 6)Accommodation and Food Services: Full-Service Restaurants (20-49: 2, 5-9: 3, 1-4: 5)Accommodation and Food Services: Limited-Service Restaurants (20-49: 1, 10-19: 2, 5-9: 1, 1-4: 2)Arts, Entertainment, and Recreation: Golf Courses and Country Clubs (50-99: 1)Construction: Plumbing, Heating, and Air-Conditioning Contractors (10-19: 2, 5-9: 3, 1-4: 7)Construction: Commercial and Institutional Building Construction (20-49: 1, 10-19: 1, 5-9: 1)Administrative and Support and Waste Management and Remediation Services: Landscaping Services (20-49: 1, 1-4: 7)Construction: Electrical Contractors (20-49: 1, 5-9: 1, 1-4: 3)
People in group quarters in 2010:
239 people in nursing facilities/skilled-nursing facilities
14 people in group homes for juveniles (non-correctional)
12 people in group homes intended for adults
People in group quarters in 2000:
246 people in nursing homes
21 people in homes for the mentally ill
17 people in other noninstitutional group quarters
Fatal accident statistics in 2014:
Fatal accident count: 5Vehicles involved in fatal accidents: 6Fatal accidents caused by drunken drivers: 2Fatalities: 6Persons involved in fatal accidents: 7Pedestrians involved in fatal accidents: 2
Fatal accident statistics in 2013:
Fatal accident count: 5Vehicles involved in fatal accidents: 9Fatal accidents caused by drunken drivers: 1Fatalities: 5Persons involved in fatal accidents: 12Pedestrians involved in fatal accidents: 1
Home Mortgage Disclosure Act Aggregated Statistics For Year 2009(Based on 4 full and 10 partial tracts) A) FHA, FSA/RHS & VA B) Conventional C) Refinancings D) Home Improvement Loans E) Loans on Dwellings For 5+ Families F) Non-occupant Loans on G) Loans On Manufactured Number Average Value Number Average Value Number Average Value Number Average Value Number Average Value Number Average Value Number Average Value
LOANS ORIGINATED 236 $119,338 167 $124,335 564 $126,328 14 $53,507 1 $11,379,880 83 $75,663 5 $23,582 APPLICATIONS APPROVED, NOT ACCEPTED 8 $87,189 9 $123,040 56 $121,662 3 $21,797 0 $0 4 $62,862 3 $59,443 APPLICATIONS DENIED 57 $118,415 28 $111,761 295 $114,397 25 $30,452 0 $0 22 $91,960 6 $73,902 APPLICATIONS WITHDRAWN 34 $120,158 27 $178,967 148 $115,964 10 $64,795 4 $11,276,970 16 $71,571 0 $0 FILES CLOSED FOR INCOMPLETENESS 9 $95,151 2 $128,000 41 $126,470 6 $81,098 0 $0 8 $130,131 0 $0
Aggregated Statistics For Year 2008(Based on 4 full and 10 partial tracts) A) FHA, FSA/RHS & VA B) Conventional C) Refinancings D) Home Improvement Loans E) Loans on Dwellings For 5+ Families F) Non-occupant Loans on G) Loans On Manufactured Number Average Value Number Average Value Number Average Value Number Average Value Number Average Value Number Average Value Number Average Value
LOANS ORIGINATED 169 $128,451 351 $120,693 495 $111,546 34 $64,367 3 $241,513 170 $84,765 10 $64,347 APPLICATIONS APPROVED, NOT ACCEPTED 4 $104,650 36 $133,045 85 $89,621 3 $40,660 0 $0 8 $110,022 2 $86,095 APPLICATIONS DENIED 49 $116,965 64 $85,791 418 $107,851 63 $42,041 0 $0 38 $62,478 9 $59,690 APPLICATIONS WITHDRAWN 14 $88,855 61 $127,270 166 $105,224 21 $89,991 0 $0 23 $66,130 0 $0 FILES CLOSED FOR INCOMPLETENESS 0 $0 10 $95,504 39 $118,697 1 $11,470 0 $0 2 $60,950 0 $0
Aggregated Statistics For Year 2007(Based on 4 full and 10 partial tracts) A) FHA, FSA/RHS & VA B) Conventional C) Refinancings D) Home Improvement Loans E) Loans on Dwellings For 5+ Families F) Non-occupant Loans on G) Loans On Manufactured Number Average Value Number Average Value Number Average Value Number Average Value Number Average Value Number Average Value Number Average Value
LOANS ORIGINATED 80 $124,298 759 $114,198 602 $94,271 49 $25,381 11 $1,104,945 240 $82,429 20 $64,800 APPLICATIONS APPROVED, NOT ACCEPTED 4 $135,772 86 $119,792 116 $88,681 22 $26,424 0 $0 27 $77,849 5 $54,484 APPLICATIONS DENIED 26 $135,168 172 $137,228 624 $101,345 96 $55,903 2 $199,640 86 $82,652 17 $55,248 APPLICATIONS WITHDRAWN 7 $163,634 61 $86,915 277 $99,082 31 $81,426 2 $398,440 51 $76,792 0 $0 FILES CLOSED FOR INCOMPLETENESS 4 $130,040 29 $87,514 48 $103,566 3 $42,353 2 $398,440 4 $78,025 0 $0
Aggregated Statistics For Year 2006(Based on 4 full and 10 partial tracts) A) FHA, FSA/RHS & VA B) Conventional C) Refinancings D) Home Improvement Loans E) Loans on Dwellings For 5+ Families F) Non-occupant Loans on G) Loans On Manufactured Number Average Value Number Average Value Number Average Value Number Average Value Number Average Value Number Average Value Number Average Value
LOANS ORIGINATED 43 $112,463 866 $94,324 649 $79,185 105 $37,282 2 $454,995 327 $79,700 25 $47,736 APPLICATIONS APPROVED, NOT ACCEPTED 4 $40,005 110 $85,119 142 $83,616 23 $40,151 0 $0 54 $74,852 15 $65,324 APPLICATIONS DENIED 11 $97,906 230 $86,639 583 $93,802 119 $39,969 0 $0 90 $81,750 30 $58,453 APPLICATIONS WITHDRAWN 7 $110,550 80 $78,127 268 $99,069 43 $94,620 1 $114,660 55 $74,616 8 $70,741 FILES CLOSED FOR INCOMPLETENESS 0 $0 48 $107,985 80 $103,093 0 $0 0 $0 7 $94,373 2 $54,900
Aggregated Statistics For Year 2005(Based on 4 full and 10 partial tracts) A) FHA, FSA/RHS & VA B) Conventional C) Refinancings D) Home Improvement Loans E) Loans on Dwellings For 5+ Families F) Non-occupant Loans on G) Loans On Manufactured Number Average Value Number Average Value Number Average Value Number Average Value Number Average Value Number Average Value Number Average Value
LOANS ORIGINATED 62 $97,532 867 $81,368 665 $85,452 89 $39,142 7 $1,071,300 365 $67,294 27 $46,478 APPLICATIONS APPROVED, NOT ACCEPTED 7 $112,457 117 $88,455 105 $74,583 7 $15,996 0 $0 16 $43,378 10 $36,616 APPLICATIONS DENIED 14 $105,246 237 $85,125 549 $95,543 116 $48,705 0 $0 59 $64,571 63 $54,845 APPLICATIONS WITHDRAWN 6 $113,687 110 $92,374 320 $99,944 53 $115,541 0 $0 53 $84,906 5 $56,532 FILES CLOSED FOR INCOMPLETENESS 4 $90,475 49 $93,602 111 $105,407 4 $88,452 0 $0 19 $79,764 6 $96,763
Aggregated Statistics For Year 2004(Based on 4 full and 10 partial tracts) A) FHA, FSA/RHS & VA B) Conventional C) Refinancings D) Home Improvement Loans E) Loans on Dwellings For 5+ Families F) Non-occupant Loans on G) Loans On Manufactured Number Average Value Number Average Value Number Average Value Number Average Value Number Average Value Number Average Value Number Average Value
LOANS ORIGINATED 90 $99,609 610 $85,946 725 $87,757 59 $38,607 9 $158,257 224 $60,306 36 $47,901 APPLICATIONS APPROVED, NOT ACCEPTED 4 $71,268 74 $81,109 126 $77,998 6 $18,720 0 $0 12 $53,514 25 $41,510 APPLICATIONS DENIED 24 $91,986 190 $78,992 467 $92,417 56 $24,961 0 $0 59 $82,321 60 $63,778 APPLICATIONS WITHDRAWN 7 $109,474 87 $85,640 237 $98,308 10 $74,627 0 $0 30 $60,057 9 $56,843 FILES CLOSED FOR INCOMPLETENESS 1 $42,740 20 $62,578 67 $98,027 5 $28,648 0 $0 12 $47,428 2 $59,890
Aggregated Statistics For Year 2003(Based on 4 full and 10 partial tracts) A) FHA, FSA/RHS & VA B) Conventional C) Refinancings D) Home Improvement Loans E) Loans on Dwellings For 5+ Families F) Non-occupant Loans on Number Average Value Number Average Value Number Average Value Number Average Value Number Average Value Number Average Value
LOANS ORIGINATED 152 $105,499 566 $92,750 1,321 $92,640 28 $32,679 7 $1,134,267 228 $62,579 APPLICATIONS APPROVED, NOT ACCEPTED 2 $97,620 67 $76,069 175 $87,664 16 $34,609 0 $0 16 $63,656 APPLICATIONS DENIED 28 $97,505 160 $91,841 470 $84,313 54 $13,647 0 $0 33 $55,951 APPLICATIONS WITHDRAWN 17 $105,614 65 $93,017 252 $95,227 2 $13,410 0 $0 26 $51,648 FILES CLOSED FOR INCOMPLETENESS 5 $92,836 8 $100,802 54 $85,145 0 $0 0 $0 6 $53,283
Aggregated Statistics For Year 2002(Based on 4 full and 10 partial tracts) A) FHA, FSA/RHS & VA B) Conventional C) Refinancings D) Home Improvement Loans F) Non-occupant Loans on Number Average Value Number Average Value Number Average Value Number Average Value Number Average Value
LOANS ORIGINATED 93 $97,707 552 $85,637 1,042 $84,645 50 $24,516 256 $69,765 APPLICATIONS APPROVED, NOT ACCEPTED 2 $119,015 77 $57,942 188 $91,176 8 $51,728 13 $49,178 APPLICATIONS DENIED 23 $93,230 200 $62,623 446 $79,530 48 $13,612 27 $60,381 APPLICATIONS WITHDRAWN 27 $104,831 55 $117,832 253 $92,004 0 $0 12 $67,862 FILES CLOSED FOR INCOMPLETENESS 1 $55,250 32 $87,610 83 $79,830 1 $29,190 20 $84,338
Aggregated Statistics For Year 2001(Based on 4 full and 10 partial tracts) A) FHA, FSA/RHS & VA B) Conventional C) Refinancings D) Home Improvement Loans E) Loans on Dwellings For 5+ Families F) Non-occupant Loans on Number Average Value Number Average Value Number Average Value Number Average Value Number Average Value Number Average Value
LOANS ORIGINATED 128 $96,670 506 $90,278 907 $83,810 71 $18,976 5 $1,413,564 146 $81,575 APPLICATIONS APPROVED, NOT ACCEPTED 5 $85,456 80 $68,699 126 $62,411 21 $17,365 0 $0 14 $44,225 APPLICATIONS DENIED 14 $79,240 222 $55,677 515 $63,627 92 $13,679 2 $28,605 30 $50,806 APPLICATIONS WITHDRAWN 5 $109,704 56 $89,864 242 $79,069 14 $26,501 0 $0 14 $74,213 FILES CLOSED FOR INCOMPLETENESS 0 $0 15 $98,417 49 $78,045 2 $120,395 0 $0 4 $32,615
Aggregated Statistics For Year 2000(Based on 4 full and 10 partial tracts) A) FHA, FSA/RHS & VA B) Conventional C) Refinancings D) Home Improvement Loans E) Loans on Dwellings For 5+ Families F) Non-occupant Loans on Number Average Value Number Average Value Number Average Value Number Average Value Number Average Value Number Average Value
LOANS ORIGINATED 99 $83,629 507 $75,748 366 $64,033 91 $17,834 4 $601,132 120 $58,693 APPLICATIONS APPROVED, NOT ACCEPTED 17 $54,759 76 $58,017 122 $63,279 20 $18,912 0 $0 13 $65,855 APPLICATIONS DENIED 43 $63,364 337 $50,277 554 $57,591 104 $10,161 0 $0 29 $44,194 APPLICATIONS WITHDRAWN 21 $74,066 41 $91,805 201 $53,533 11 $18,595 0 $0 8 $32,690 FILES CLOSED FOR INCOMPLETENESS 2 $56,315 29 $73,627 56 $68,733 5 $31,634 0 $0 6 $50,662
Aggregated Statistics For Year 1999(Based on 2 full and 5 partial tracts) A) FHA, FSA/RHS & VA B) Conventional C) Refinancings D) Home Improvement Loans E) Loans on Dwellings For 5+ Families F) Non-occupant Loans on Number Average Value Number Average Value Number Average Value Number Average Value Number Average Value Number Average Value
LOANS ORIGINATED 58 $82,003 239 $74,701 352 $68,276 59 $16,389 2 $542,150 58 $74,461 APPLICATIONS APPROVED, NOT ACCEPTED 3 $99,187 79 $90,610 94 $57,441 13 $16,309 0 $0 4 $41,312 APPLICATIONS DENIED 8 $76,899 252 $55,778 235 $67,514 42 $14,846 0 $0 8 $45,382 APPLICATIONS WITHDRAWN 3 $73,433 40 $54,522 109 $69,336 3 $35,533 0 $0 2 $33,835 FILES CLOSED FOR INCOMPLETENESS 2 $95,120 8 $70,816 27 $57,537 0 $0 0 $0 1 $18,030
Private Mortgage Insurance Companies Aggregated Statistics For Year 2009(Based on 4 full and 8 partial tracts) A) Conventional B) Refinancings C) Non-occupant Loans on Number Average Value Number Average Value Number Average Value
LOANS ORIGINATED 21 $149,621 25 $145,302 0 $0 APPLICATIONS APPROVED, NOT ACCEPTED 15 $115,984 8 $87,779 2 $67,735 APPLICATIONS DENIED 4 $139,875 2 $112,060 0 $0 APPLICATIONS WITHDRAWN 0 $0 2 $134,085 0 $0 FILES CLOSED FOR INCOMPLETENESS 0 $0 0 $0 0 $0
Aggregated Statistics For Year 2008(Based on 4 full and 10 partial tracts) A) Conventional B) Refinancings C) Non-occupant Loans on Number Average Value Number Average Value Number Average Value
LOANS ORIGINATED 146 $114,281 54 $123,296 9 $66,274 APPLICATIONS APPROVED, NOT ACCEPTED 21 $119,496 26 $133,420 4 $102,522 APPLICATIONS DENIED 14 $87,587 3 $71,577 7 $69,694 APPLICATIONS WITHDRAWN 2 $59,765 3 $112,410 2 $59,765 FILES CLOSED FOR INCOMPLETENESS 4 $59,570 4 $98,072 4 $66,045
Aggregated Statistics For Year 2007(Based on 4 full and 10 partial tracts) A) Conventional B) Refinancings C) Non-occupant Loans on D) Loans On Manufactured Number Average Value Number Average Value Number Average Value Number Average Value
LOANS ORIGINATED 331 $104,344 93 $126,681 50 $93,869 2 $29,715 APPLICATIONS APPROVED, NOT ACCEPTED 43 $105,978 20 $108,200 5 $42,166 0 $0 APPLICATIONS DENIED 6 $99,657 3 $149,320 1 $52,120 0 $0 APPLICATIONS WITHDRAWN 17 $89,159 8 $96,511 0 $0 0 $0 FILES CLOSED FOR INCOMPLETENESS 2 $76,700 0 $0 0 $0 0 $0
Aggregated Statistics For Year 2006(Based on 4 full and 10 partial tracts) A) Conventional B) Refinancings C) Non-occupant Loans on Number Average Value Number Average Value Number Average Value
LOANS ORIGINATED 252 $102,769 71 $118,065 55 $92,570 APPLICATIONS APPROVED, NOT ACCEPTED 30 $85,499 13 $106,097 13 $70,192 APPLICATIONS DENIED 20 $110,630 0 $0 0 $0 APPLICATIONS WITHDRAWN 16 $93,914 15 $161,376 6 $125,737 FILES CLOSED FOR INCOMPLETENESS 1 $67,760 4 $134,682 2 $67,155
Aggregated Statistics For Year 2005(Based on 4 full and 10 partial tracts) A) Conventional B) Refinancings C) Non-occupant Loans on D) Loans On Manufactured Number Average Value Number Average Value Number Average Value Number Average Value
LOANS ORIGINATED 191 $90,574 86 $109,736 66 $67,019 1 $90,690 APPLICATIONS APPROVED, NOT ACCEPTED 33 $89,452 8 $98,501 4 $67,860 0 $0 APPLICATIONS DENIED 12 $71,182 0 $0 1 $74,010 0 $0 APPLICATIONS WITHDRAWN 24 $108,718 12 $95,592 9 $87,332 2 $41,145 FILES CLOSED FOR INCOMPLETENESS 2 $87,320 0 $0 0 $0 0 $0
Aggregated Statistics For Year 2004(Based on 4 full and 10 partial tracts) A) Conventional B) Refinancings C) Non-occupant Loans on D) Loans On Manufactured Number Average Value Number Average Value Number Average Value Number Average Value
LOANS ORIGINATED 189 $99,421 100 $108,507 40 $63,476 3 $60,443 APPLICATIONS APPROVED, NOT ACCEPTED 35 $114,599 23 $113,574 7 $59,613 0 $0 APPLICATIONS DENIED 14 $74,192 4 $116,918 4 $30,392 2 $27,430 APPLICATIONS WITHDRAWN 13 $80,945 13 $115,682 4 $45,690 0 $0 FILES CLOSED FOR INCOMPLETENESS 2 $57,210 0 $0 0 $0 0 $0
Aggregated Statistics For Year 2003(Based on 4 full and 10 partial tracts) A) Conventional B) Refinancings C) Non-occupant Loans on Number Average Value Number Average Value Number Average Value
LOANS ORIGINATED 257 $102,702 287 $103,243 34 $76,613 APPLICATIONS APPROVED, NOT ACCEPTED 95 $95,762 113 $102,344 11 $68,335 APPLICATIONS DENIED 7 $74,450 13 $82,824 3 $77,170 APPLICATIONS WITHDRAWN 10 $104,953 18 $97,041 3 $80,430 FILES CLOSED FOR INCOMPLETENESS 3 $49,640 3 $108,190 0 $0
Aggregated Statistics For Year 2002(Based on 4 full and 10 partial tracts) A) Conventional B) Refinancings C) Non-occupant Loans on Number Average Value Number Average Value Number Average Value
LOANS ORIGINATED 220 $100,939 237 $98,110 33 $73,882 APPLICATIONS APPROVED, NOT ACCEPTED 67 $94,002 66 $98,624 11 $47,637 APPLICATIONS DENIED 11 $85,655 15 $96,705 2 $54,530 APPLICATIONS WITHDRAWN 5 $86,018 16 $78,982 0 $0 FILES CLOSED FOR INCOMPLETENESS 10 $83,653 4 $97,395 0 $0
Aggregated Statistics For Year 2001(Based on 4 full and 10 partial tracts) A) Conventional B) Refinancings C) Non-occupant Loans on Number Average Value Number Average Value Number Average Value
LOANS ORIGINATED 216 $97,009 183 $102,503 19 $60,823 APPLICATIONS APPROVED, NOT ACCEPTED 34 $97,282 44 $107,457 5 $47,134 APPLICATIONS DENIED 16 $92,571 7 $77,901 2 $38,570 APPLICATIONS WITHDRAWN 6 $100,850 7 $88,710 0 $0 FILES CLOSED FOR INCOMPLETENESS 4 $95,200 2 $68,830 0 $0
Aggregated Statistics For Year 2000(Based on 4 full and 10 partial tracts) A) Conventional B) Refinancings C) Non-occupant Loans on Number Average Value Number Average Value Number Average Value
LOANS ORIGINATED 188 $93,936 52 $77,759 23 $53,190 APPLICATIONS APPROVED, NOT ACCEPTED 31 $88,454 4 $78,760 2 $92,610 APPLICATIONS DENIED 6 $66,650 14 $114,279 0 $0 APPLICATIONS WITHDRAWN 16 $93,922 3 $100,570 1 $28,140 FILES CLOSED FOR INCOMPLETENESS 14 $71,168 3 $82,457 0 $0
Aggregated Statistics For Year 1999(Based on 2 full and 5 partial tracts) A) Conventional B) Refinancings C) Non-occupant Loans on Number Average Value Number Average Value Number Average Value
LOANS ORIGINATED 85 $97,101 51 $78,355 2 $56,395 APPLICATIONS APPROVED, NOT ACCEPTED 5 $100,196 7 $97,404 0 $0 APPLICATIONS DENIED 9 $92,323 4 $74,928 0 $0 APPLICATIONS WITHDRAWN 3 $119,690 1 $103,350 1 $93,950 FILES CLOSED FOR INCOMPLETENESS 1 $78,700 1 $68,110 0 $0
2002 - 2018 National Fire Incident Reporting System (NFIRS) incidents See full 2006 National Fire Incident Reporting System statistics for zip code 29617, South Carolina
Most common first names in zip code 29617 among deceased individuals Name Count Lived (average)
James 98 74.8 years William 60 75.5 years Charles 52 73.9 years Mary 50 80.5 years John 39 77.1 years Robert 38 73.1 years George 30 76.7 years Helen 29 82.8 years Margaret 26 75.5 years Frances 24 78.6 years
Most common last names in zip code 29617 among deceased individuals Last name Count Lived (average)
Smith 38 74.6 years Jones 22 72.7 years Johnson 21 78.5 years Davis 21 79.6 years Brown 19 72.9 years Williams 18 71.1 years Wilson 18 78.3 years Campbell 16 81.5 years Bishop 15 77.0 years Watson 13 80.9 years
Businesses in zip code 29617
Name Count Name Count
AutoZone 1 H&R Block 2 Blockbuster 1 Hardee's 1 CVS 1 Kmart 1 Curves 1 Papa John's Pizza 1 FedEx 1 Publix Super Markets 1 GNC 1 UPS 1 Goodwill 1 Waffle House 1
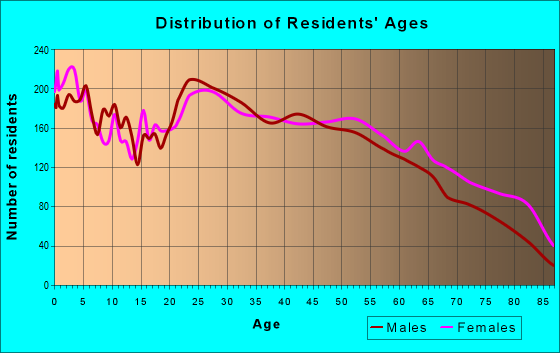
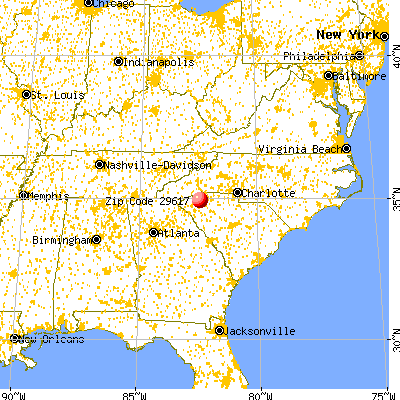


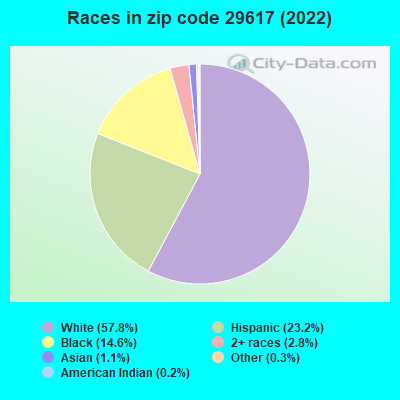


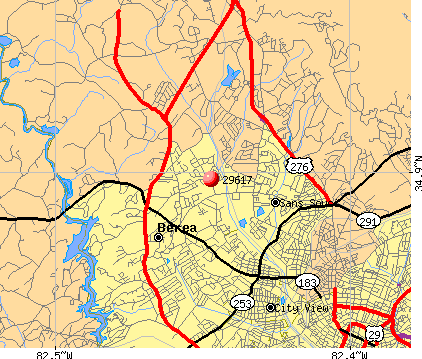 Nearest zip codes: 29613, 29609, 29611, 29601, 29614, 29640.
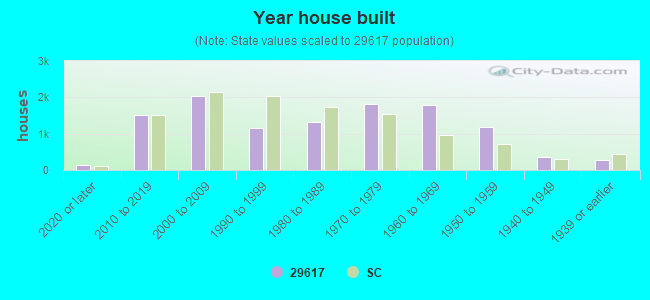
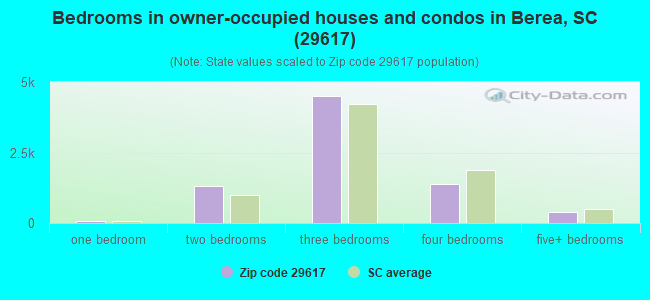
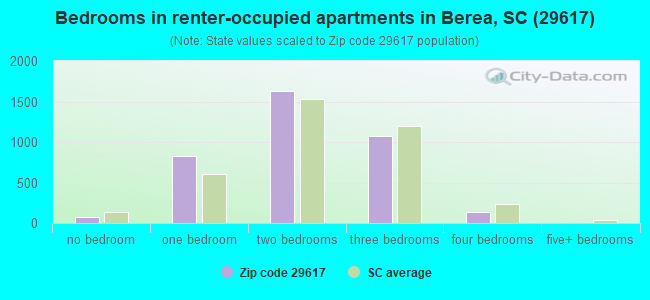
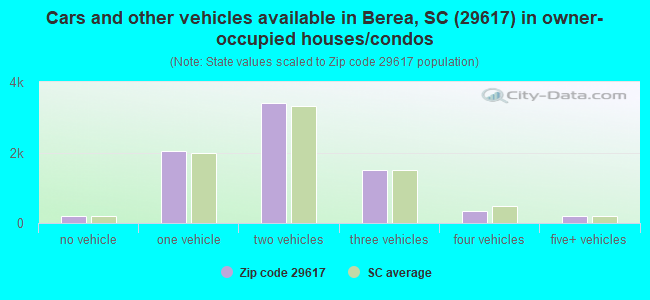
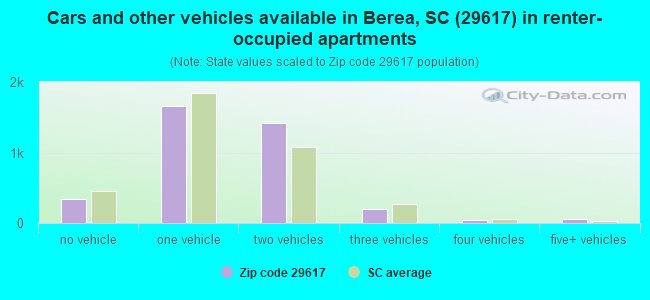


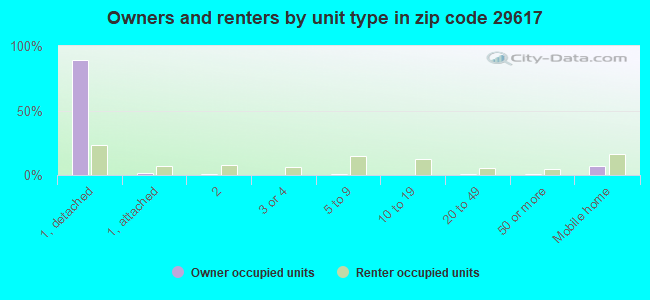
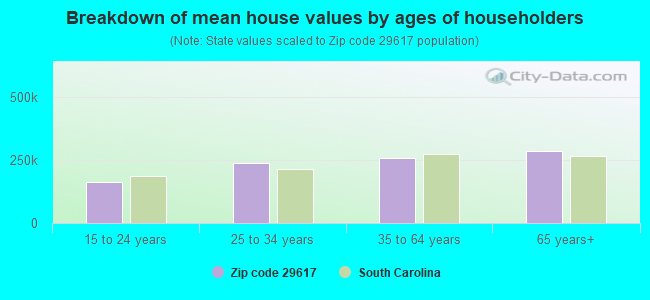


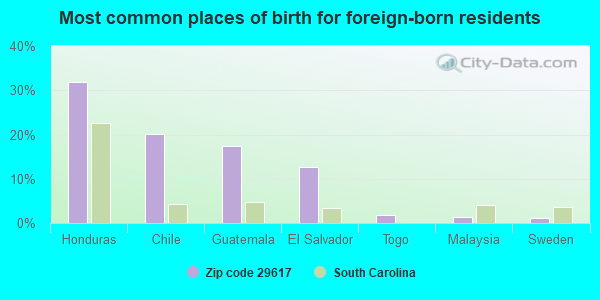
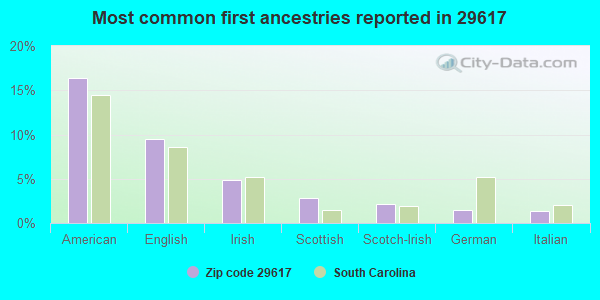
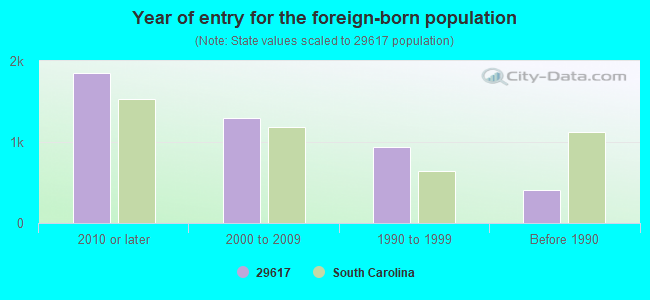


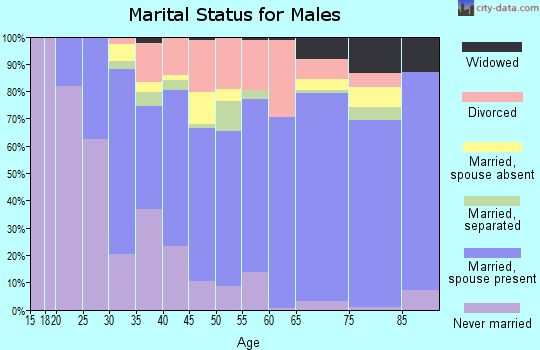
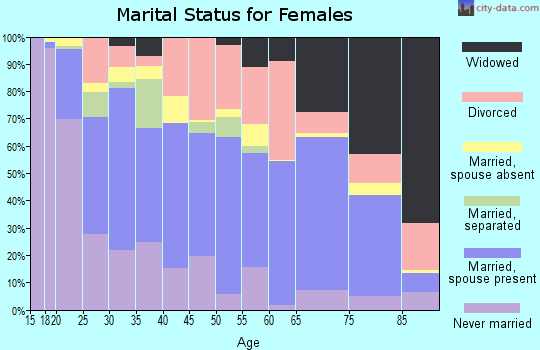
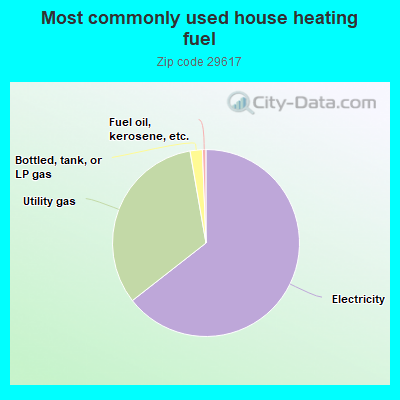
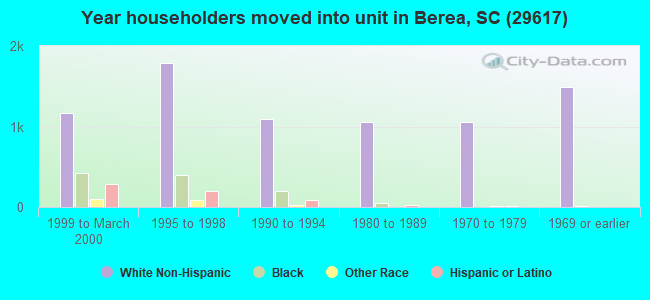
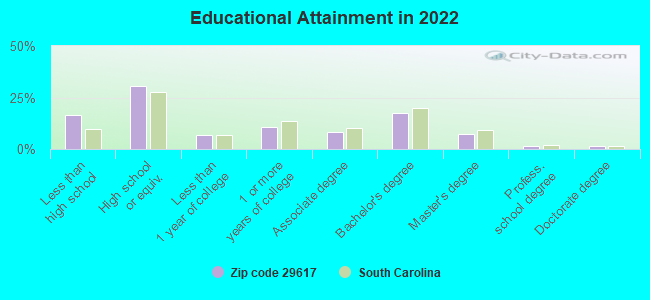
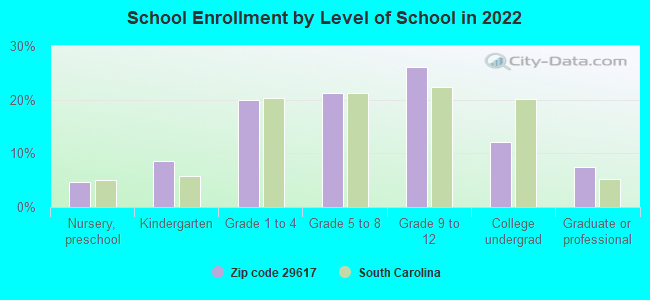
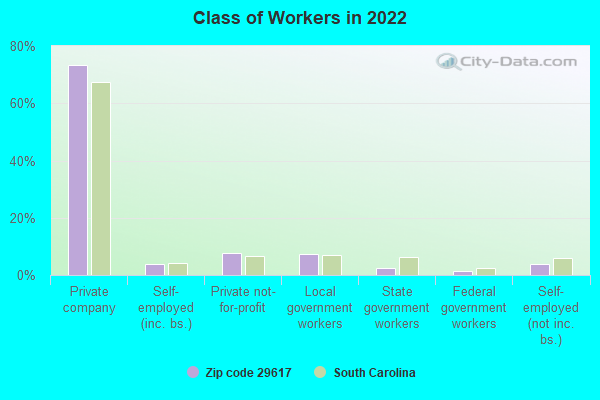
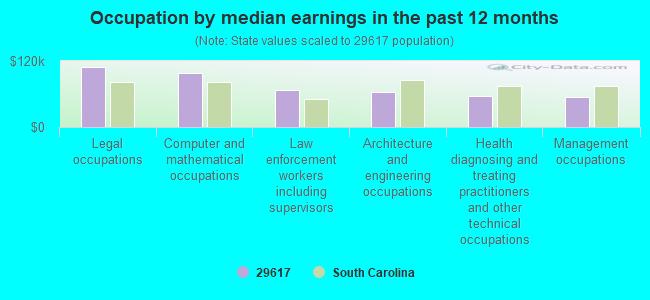
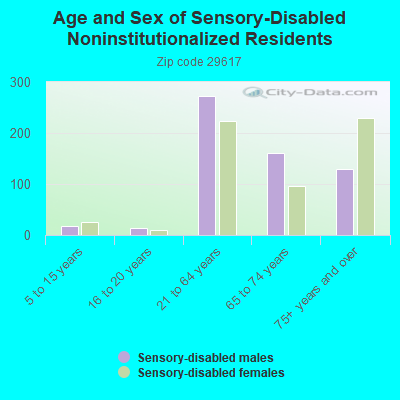
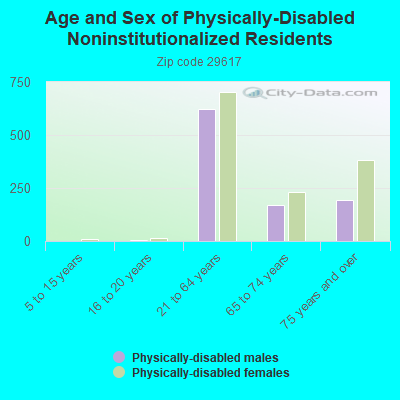
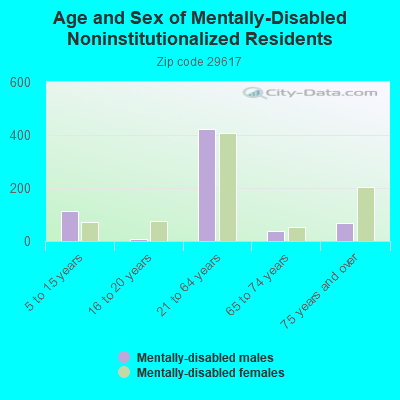
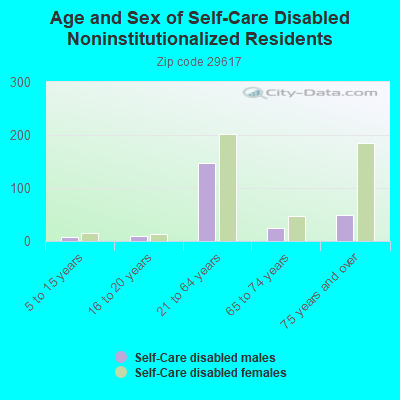
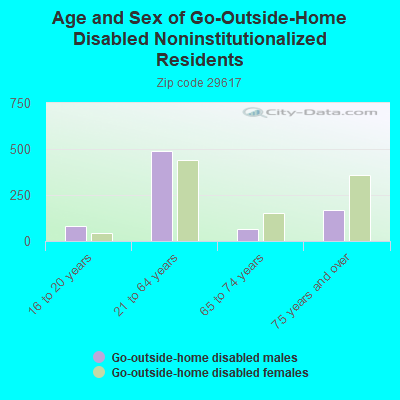
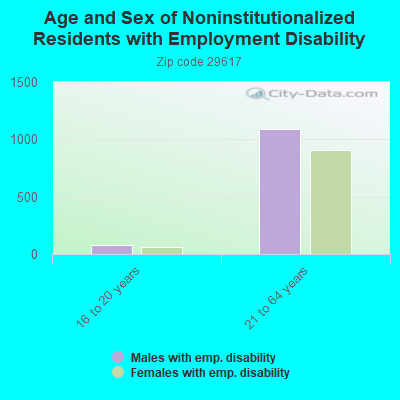
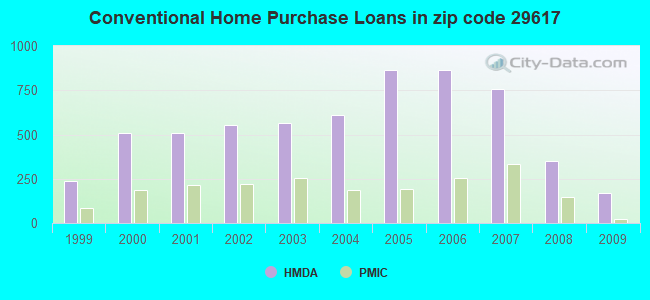
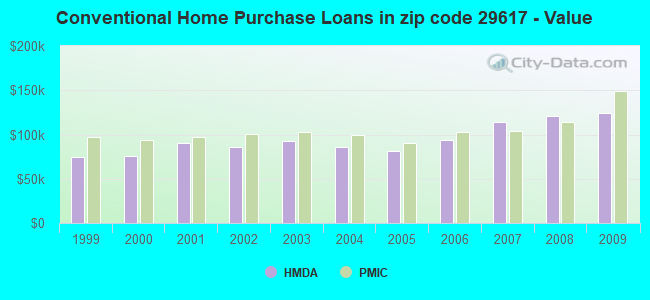
 Based on the data from the years 2002 - 2018 the average number of fires per year is 63. The highest number of fire incidents - 124 took place in 2018, and the least - 18 in 2009. The data has a growing trend.
 When looking into fire subcategories, the most incidents belonged to: Structure Fires (37.1%), and Outside Fires (37.0%).