Estimated zip code population in 2022: 30,968 Zip code population in 2010: 26,778 Zip code population in 2000: 25,898
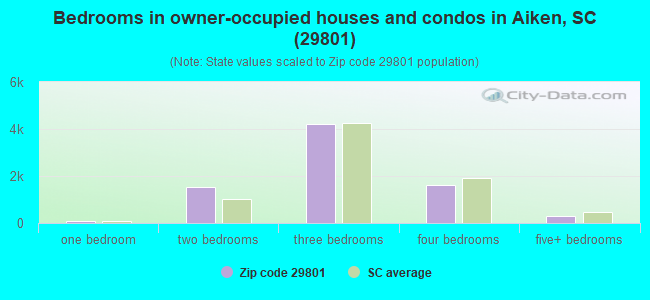
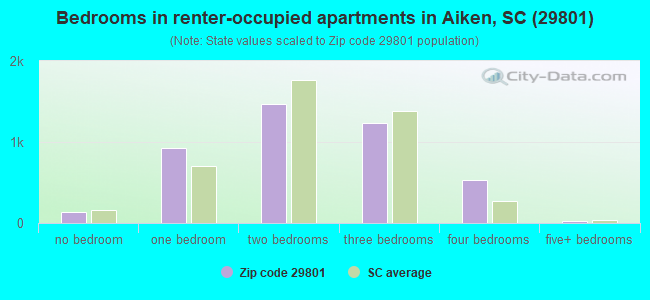
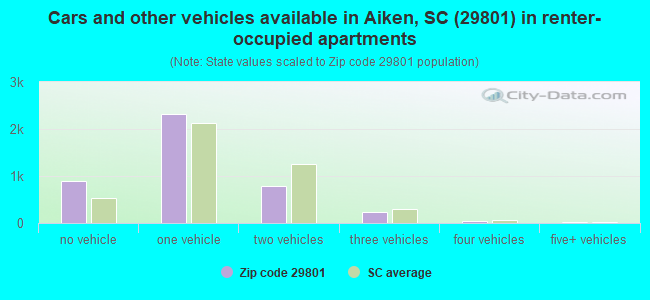
Houses and condos: 14,099 Renter-occupied apartments: 4,300
% of renters here:
35%
State:
28%
March 2022 cost of living index in zip code 29801: 90.1 (less than average, U.S. average is 100)
Land area: 87.6 sq. mi. Water area: 0.4 sq. mi.
Population density: 354 people per square mile
(very low).
OSM Map
General Map
Google Map
MSN Map
OSM Map
General Map
Google Map
MSN Map
OSM Map
General Map
Google Map
MSN Map
OSM Map
General Map
Google Map
MSN Map
Please wait while loading the map...
Real estate property taxes paid for housing units in 2022:
This zip code:
0.4% ($656)
South Carolina:
0.5% ($1,185)
Median real estate property taxes paid for housing units with mortgages in 2022: $821 (0.4%) Median real estate property taxes paid for housing units with no mortgage in 2022: $524 (0.4%)
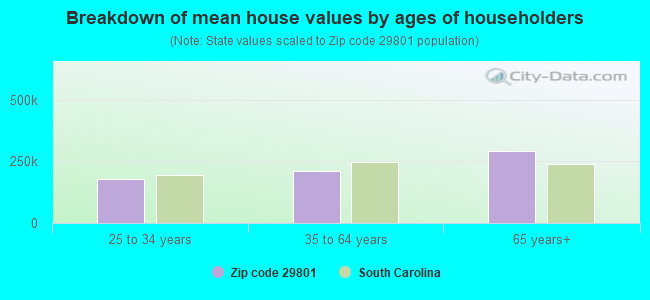
Estimated median house/condo value in 2022: $171,814
29801:
$171,814
South Carolina:
$254,600
According to our research of South Carolina and other state lists, there were 4 registered sex offenders living in 29801 zip code as of April 24, 2024. The ratio of all residents to sex offenders in zip code 29801 is 6,985 to 1. The ratio of registered sex offenders to all residents in this zip code is much lower than the state average.
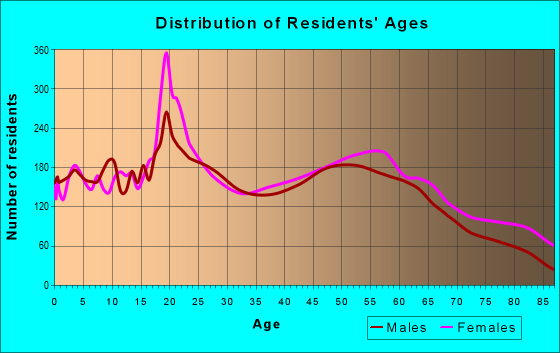
Median resident age:
This zip code:
40.2 years
South Carolina median age:
40.5 years
Average household size:
This zip code:
2.4 people
South Carolina:
2.4 people
Averages for the 2020 tax year for zip code 29801, filed in 2021:
Average Adjusted Gross Income (AGI) in 2020: $56,409 (Individual Income Tax Returns)
Here:
$56,409
State:
$65,754
Salary/wage: $43,921 (reported on 81.1% of returns)
Here:
$43,921
State:
$52,566
(% of AGI for various income ranges: 1185.1% for AGIs below $25k, 3655.1% for AGIs $25k-50k, 6629.8% for AGIs $50k-75k, 9761.5% for AGIs $75k-100k, 17137.0% for AGIs $100k-200k, 87555.0% for AGIs over 200k)
Taxable interest for individuals: $1,880 (reported on 22.4% of returns)
This zip code:
$1,880
South Carolina:
$1,749
(% of AGI for various income ranges: 8.1% for AGIs below $25k, 22.7% for AGIs $25k-50k, 39.2% for AGIs $50k-75k, 87.8% for AGIs $75k-100k, 171.4% for AGIs $100k-200k, 2877.5% for AGIs over 200k)
Ordinary dividends: $11,605 (reported on 15.2% of returns)
Here:
$11,605
State:
$8,783
(% of AGI for various income ranges: 16.8% for AGIs below $25k, 41.9% for AGIs $25k-50k, 138.9% for AGIs $50k-75k, 260.6% for AGIs $75k-100k, 858.9% for AGIs $100k-200k, 14367.5% for AGIs over 200k)
Net capital gain/loss in AGI: +$26,211 (reported on 13.7% of returns)
Here:
+$26,211
State:
+$24,194
(% of AGI for various income ranges: 4.9% for AGIs below $25k, 19.8% for AGIs $25k-50k, 115.3% for AGIs $50k-75k, 417.8% for AGIs $75k-100k, 988.4% for AGIs $100k-200k, 41693.8% for AGIs over 200k)
Profit/loss from business: +$8,076 (reported on 16.3% of returns)
Here:
+$8,076
State:
+$11,253
(% of AGI for various income ranges: 105.2% for AGIs below $25k, 76.1% for AGIs $25k-50k, 114.3% for AGIs $50k-75k, 388.9% for AGIs $75k-100k, 541.2% for AGIs $100k-200k, 4245.0% for AGIs over 200k)
Taxable individual retirement arrangement distribution: $20,705 (reported on 8.6% of returns)
29801:
$20,705
South Carolina:
$21,604
(% of AGI for various income ranges: 40.1% for AGIs below $25k, 94.1% for AGIs $25k-50k, 274.4% for AGIs $50k-75k, 538.7% for AGIs $75k-100k, 1098.9% for AGIs $100k-200k, 6486.2% for AGIs over 200k)
Self-employed (Keogh) retirement plans: $23,267 (reported on 0.2% of returns)
29801:
$23,267
South Carolina:
$25,038
(% of AGI for various income ranges: 109.1% for AGIs $100k-200k)
Total itemized deductions: $34,571 (reported on 6.5% of returns)
Here:
$34,571
State:
$35,199
(% of AGI for various income ranges: 27.9% for AGIs below $25k, 90.4% for AGIs $25k-50k, 300.6% for AGIs $50k-75k, 439.1% for AGIs $75k-100k, 1306.6% for AGIs $100k-200k, 12840.0% for AGIs over 200k)
Charity contributions: $15,335 (reported on 5.6% of returns)
Here:
$15,335
State:
$14,319
(% of AGI for various income ranges: 1.4% for AGIs below $25k, 26.3% for AGIs $25k-50k, 71.6% for AGIs $50k-75k, 97.2% for AGIs $75k-100k, 431.2% for AGIs $100k-200k, 7161.2% for AGIs over 200k)
Taxes paid: $6,730 (reported on 6.5% of returns)
29801:
$6,730
State:
$7,486
(% of AGI for various income ranges: 2.2% for AGIs below $25k, 12.1% for AGIs $25k-50k, 56.6% for AGIs $50k-75k, 116.9% for AGIs $75k-100k, 331.9% for AGIs $100k-200k, 2017.5% for AGIs over 200k)
Earned income credit: $2,548 (reported on 26.3% of returns)
Here:
$2,548
State:
$2,397
(% of AGI for various income ranges: 150.9% for AGIs below $25k, 92.4% for AGIs $25k-50k, 1.4% for AGIs $50k-75k)
Percentage of individuals using paid preparers for their 2020 taxes: 93.8%
Here:
94%
State:
93%
(% for various income ranges: 94.4% for AGIs below $25k, 93.4% for AGIs $25k-50k, 93.3% for AGIs $50k-75k, 92.0% for AGIs $75k-100k, 93.7% for AGIs $100k-200k, 94.4% for AGIs over 200k)
Averages for the 2012 tax year for zip code 29801, filed in 2013:
Average Adjusted Gross Income (AGI) in 2012: $45,048 (Individual Income Tax Returns)
Here:
$45,048
State:
$51,133
Salary/wage: $36,244 (reported on 82.4% of returns)
Here:
$36,244
State:
$42,173
(% of AGI for various income ranges: 77.5% for AGIs below $25k, 78.5% for AGIs $25k-50k, 73.1% for AGIs $50k-75k, 69.2% for AGIs $75k-100k, 69.5% for AGIs $100k-200k, 35.2% for AGIs over 200k)
Taxable interest for individuals: $1,857 (reported on 24.4% of returns)
This zip code:
$1,857
South Carolina:
$1,468
(% of AGI for various income ranges: 0.8% for AGIs below $25k, 0.7% for AGIs $25k-50k, 1.0% for AGIs $50k-75k, 0.7% for AGIs $75k-100k, 0.9% for AGIs $100k-200k, 1.7% for AGIs over 200k)
Ordinary dividends: $11,138 (reported on 15.8% of returns)
Here:
$11,138
State:
$6,511
(% of AGI for various income ranges: 1.2% for AGIs below $25k, 1.3% for AGIs $25k-50k, 1.8% for AGIs $50k-75k, 2.4% for AGIs $75k-100k, 3.1% for AGIs $100k-200k, 12.1% for AGIs over 200k)
Net capital gain/loss in AGI: +$21,367 (reported on 11.9% of returns)
Here:
+$21,367
State:
+$13,061
(% of AGI for various income ranges: 0.8% for AGIs $25k-50k, 0.7% for AGIs $50k-75k, 1.0% for AGIs $75k-100k, 1.9% for AGIs $100k-200k, 26.0% for AGIs over 200k)
Profit/loss from business: +$8,758 (reported on 14.7% of returns)
Here:
+$8,758
State:
+$10,167
(% of AGI for various income ranges: 6.8% for AGIs below $25k, 1.8% for AGIs $25k-50k, 1.1% for AGIs $50k-75k, 1.6% for AGIs $75k-100k, 1.9% for AGIs $100k-200k, 4.3% for AGIs over 200k)
Taxable individual retirement arrangement distribution: $14,436 (reported on 10.2% of returns)
29801:
$14,436
South Carolina:
$17,019
(% of AGI for various income ranges: 2.5% for AGIs below $25k, 2.9% for AGIs $25k-50k, 3.4% for AGIs $50k-75k, 3.5% for AGIs $75k-100k, 4.2% for AGIs $100k-200k, 2.8% for AGIs over 200k)
Self-employment retirement plans: $26,750 (reported on 0.2% of returns)
29801:
$26,750
South Carolina:
$21,023
Total itemized deductions: $22,780 (22% of AGI, reported on 24.6% of returns)
Here:
$22,780
State:
$22,890
Here:
22.1% of AGI
State:
21.4% of AGI
(% of AGI for various income ranges: 5.2% for AGIs below $25k, 9.4% for AGIs $25k-50k, 12.1% for AGIs $50k-75k, 13.4% for AGIs $75k-100k, 15.4% for AGIs $100k-200k, 17.0% for AGIs over 200k)
Charity contributions: $6,163 (reported on 21.5% of returns)
Here:
$6,163
State:
$5,169
(% of AGI for various income ranges: 0.7% for AGIs below $25k, 1.9% for AGIs $25k-50k, 2.8% for AGIs $50k-75k, 3.2% for AGIs $75k-100k, 3.6% for AGIs $100k-200k, 4.9% for AGIs over 200k)
Taxes paid: $7,384 (reported on 24.4% of returns)
29801:
$7,384
State:
$7,644
(% of AGI for various income ranges: 0.8% for AGIs below $25k, 1.7% for AGIs $25k-50k, 3.2% for AGIs $50k-75k, 4.2% for AGIs $75k-100k, 5.8% for AGIs $100k-200k, 7.0% for AGIs over 200k)
Earned income credit: $2,531 (reported on 31.5% of returns)
Here:
$2,531
State:
$2,418
(% of AGI for various income ranges: 10.7% for AGIs below $25k, 1.5% for AGIs $25k-50k)
Percentage of individuals using paid preparers for their 2012 taxes: 55.9%
Here:
56%
State:
57%
(% for various income ranges: 53.1% for AGIs below $25k, 55.6% for AGIs $25k-50k, 59.6% for AGIs $50k-75k, 60.0% for AGIs $75k-100k, 60.3% for AGIs $100k-200k, 80.0% for AGIs over 200k)
Averages for the 2004 tax year for zip code 29801, filed in 2005:
Average Adjusted Gross Income (AGI) in 2004: $37,047 (Individual Income Tax Returns)
Here:
$37,047
State:
$41,965
Salary/wage: $31,906 (reported on 82.9% of returns)
Here:
$31,906
State:
$35,695
(% of AGI for various income ranges: 98.0% for AGIs below $10k, 79.4% for AGIs $10k-25k, 77.6% for AGIs $25k-50k, 75.2% for AGIs $50k-75k, 76.8% for AGIs $75k-100k, 56.1% for AGIs over 100k)
Taxable interest for individuals: $1,847 (reported on 33.9% of returns)
This zip code:
$1,847
South Carolina:
$1,623
(% of AGI for various income ranges: 2.9% for AGIs below $10k, 1.3% for AGIs $10k-25k, 1.5% for AGIs $25k-50k, 1.6% for AGIs $50k-75k, 1.5% for AGIs $75k-100k, 2.0% for AGIs over 100k)
Taxable dividends: $6,258 (reported on 18.8% of returns)
Here:
$6,258
State:
$3,999
(% of AGI for various income ranges: 2.3% for AGIs below $10k, 1.1% for AGIs $10k-25k, 1.4% for AGIs $25k-50k, 2.1% for AGIs $50k-75k, 2.3% for AGIs $75k-100k, 6.5% for AGIs over 100k)
Net capital gain/loss: +$11,864 (reported on 14.4% of returns)
Here:
+$11,864
State:
+$13,100
(% of AGI for various income ranges: -0.1% for AGIs below $10k, 0.0% for AGIs $10k-25k, 0.7% for AGIs $25k-50k, 1.6% for AGIs $50k-75k, 2.0% for AGIs $75k-100k, 12.9% for AGIs over 100k)
Profit/loss from business: +$6,537 (reported on 13.4% of returns)
Here:
+$6,537
State:
+$9,144
(% of AGI for various income ranges: 3.6% for AGIs below $10k, 4.0% for AGIs $10k-25k, 2.1% for AGIs $25k-50k, 0.6% for AGIs $50k-75k, 1.7% for AGIs $75k-100k, 3.1% for AGIs over 100k)
IRA payment deduction: $2,703 (reported on 1.6% of returns)
29801:
$2,703
South Carolina:
$2,972
(% of AGI for various income ranges: 0.2% for AGIs below $10k, 0.1% for AGIs $10k-25k, 0.2% for AGIs $25k-50k, 0.1% for AGIs $50k-75k, 0.1% for AGIs $75k-100k, 0.1% for AGIs over 100k)
Self-employed pension: $12,882 (reported on 0.4% of returns)
Here:
$12,882
South Carolina:
$15,117
Total itemized deductions: $18,323 (22% of AGI, reported on 26.3% of returns)
Here:
$18,323
State:
$19,039
Here:
22.3% of AGI
State:
22.8% of AGI
(% of AGI for various income ranges: 6.7% for AGIs below $10k, 5.9% for AGIs $10k-25k, 11.0% for AGIs $25k-50k, 14.4% for AGIs $50k-75k, 16.8% for AGIs $75k-100k, 15.8% for AGIs over 100k)
Charity contributions deductions: $4,978 (6% of AGI, reported on 24.2% of returns)
Here:
$4,978
State:
$4,305
Here:
5.8% of AGI
State:
5.0% of AGI
(% of AGI for various income ranges: 0.5% for AGIs below $10k, 1.0% for AGIs $10k-25k, 2.4% for AGIs $25k-50k, 3.5% for AGIs $50k-75k, 4.3% for AGIs $75k-100k, 4.6% for AGIs over 100k)
Total tax: $5,751 (reported on 65.0% of returns)
29801:
$5,751
State:
$6,497
(% of AGI for various income ranges: 2.4% for AGIs below $10k, 3.1% for AGIs $10k-25k, 6.4% for AGIs $25k-50k, 8.8% for AGIs $50k-75k, 9.9% for AGIs $75k-100k, 17.6% for AGIs over 100k)
Earned income credit: $1,967 (reported on 29.0% of returns)
Here:
$1,967
State:
$1,882
Percentage of individuals using paid preparers for their 2004 taxes: 69.5%
Here:
69%
State:
66%
(% for various income ranges: 66.3% for AGIs below $10k, 75.1% for AGIs $10k-25k, 68.5% for AGIs $25k-50k, 67.9% for AGIs $50k-75k, 60.6% for AGIs $75k-100k, 68.0% for AGIs over 100k)
Likely homosexual households (counted as self-reported same-sex unmarried-partner households)
Lesbian couples: 0.3% of all households
Gay men: 0.8% of all households
Household received Food Stamps/SNAP in the past 12 months: 2,148 Household did not receive Food Stamps/SNAP in the past 12 months: 10,055
Women who had a birth in the past 12 months: 378 (76 now married, 278 unmarried) Women who did not have a birth in the past 12 months: 7,138 (2,490 now married, 4,627 unmarried)
Housing units in zip code 29801 with a mortgage: 3,759 (204 second mortgage, 13 home equity loan, 140 both second mortgage and home equity loan) Houses without a mortgage: 142
Median monthly owner costs for units with a mortgage: $1,128 Median monthly owner costs for units without a mortgage: $349
Residents with income below the poverty level in 2022:
This zip code:
19.5%
Whole state:
14.0%
Residents with income below 50% of the poverty level in 2022:
This zip code:
11.4%
Whole state:
7.3%
Median number of rooms in houses and condos:
Here:
6.3
State:
6.4
Median number of rooms in apartments:
Here:
4.6
State:
4.5
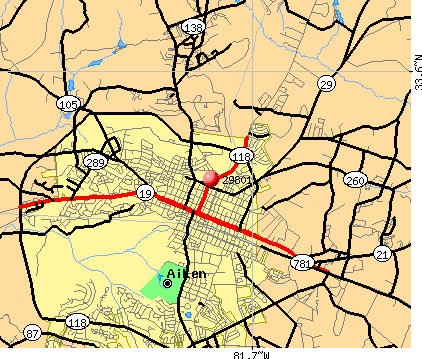
Notable locations in this zip code not listed on our city pages
Notable locations in zip code 29801: Whitney Polo Field (A), Harriman Polo Field (B), Highland Park Country Club (C), Camp NeKia (D), Powderhouse Polo Field (E), Jumping Branch Farm (F), Post Polo Ranch (G), Aiken Mile Track (H), Aiken Sewage Disposal (I), Aiken Waterworks (J), Palmetto Golf Club (K), Aiken Youth Center (L), Montmorenci Fire Department (M), Aiken Public Safety Headquarters (N), Couchton Fire Department Headquarters (O), Aiken Public Safety Station 3 (P), Aiken City Hall (Q), Aiken County Courthouse (R), Aiken County Jail (S), Aiken County Library (T). Display/hide their locations on the map
Shopping Centers: The Market Place Shopping Center (1), Kalmia Plaza Shopping Center (2), Northside Plaza Shopping Center (3). Display/hide their locations on the map
Churches in zip code 29801 include: Second Baptist Church (A), North Aiken Baptist Church (B), Wayside Church (C), Mount Hill Memorial Baptist Church (D), First Baptist Church (E), Darien Baptist Church (F), Cumberland Church (G), Marion Street Baptist Church (H), Adath Yeshurum Synagogue (I). Display/hide their locations on the map
Cemeteries: Scott Cemetery (1), Wrights Cemetery (2), Aiken Memorial Cemetery (3), Needham Brown Cemetery (4), Saint Thaddeus Cemetery (5), Bethany Cemetery (6), Saint Marys Cemetery (7). Display/hide their locations on the map
Lakes and reservoirs: Johnson Millpond (A), Oak Ridge Hunting Preserve Pond (B), Cedar Lake (C), Outing Lake (D), Camp Gravatt Pond (E), Reynolds Pond (F), Cedar Lake (G), Reynolds Pond (H). Display/hide their locations on the map
Streams, rivers, and creeks: Chavous Creek (A), Redds Branch (B), Little Horse Creek (C), Cedar Branch (D), Dairy Branch (E), Gopher Branch (F), Kines Fork (G), Brogdon Branch (H), Bridge Creek (I). Display/hide their locations on the map
2,442 married couples with children.
1,889 single-parent households (212 men, 1,677 women).
93.1% of residents of 29801 zip code speak English at home.
4.6% of residents speak Spanish at home (76% very well, 12% well, 12% not well).
1.4% of residents speak other Indo-European language at home (71% very well, 24% well, 4% not well).
0.5% of residents speak Asian or Pacific Island language at home (63% very well, 25% well, 12% not well).
0.5% of residents speak other language at home (52% very well, 48% well).
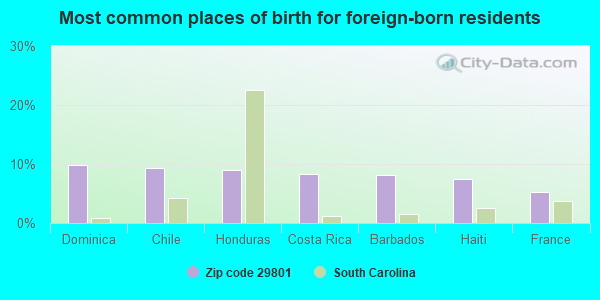
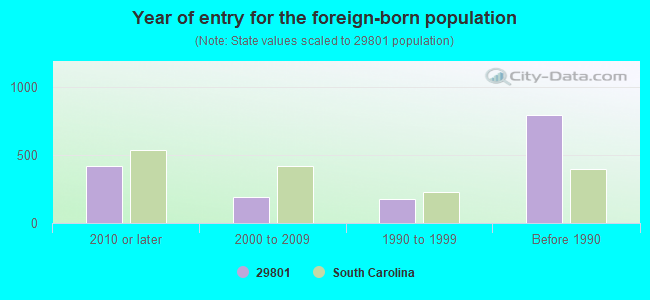
Foreign born population: 1,249 (4.0%) (73.1% of them are naturalized citizens)
Major facilities with environmental interests located in this zip code:
ADVANCED GLASSFIBER YARNS L L C (2556 WAGENER RD. in AIKEN, SC)
AIR MAJOR (AIRS/AFS) ENFORCEMENT/COMPLIANCE ACTIVITY (Integrated Compliance Information System) - ICIS-04-1998-0043, FORMAL ENFORCEMENT ACTION (Integrated Compliance Information System) - ICIS-04-1998-0043, FORMAL ENFORCEMENT ACTION CRITERIA AND HAZARDOUS AIR POLLUTANT INVENTORY (Inventory of air pollution sources) National Pollutant Discharge Elimination System NON-MAJOR (Tracking pollutant discharge elimination systems) - permit HAZARDOUS WASTE BIENNIAL REPORTER (Resource Conservation and Recovery Act (tracking hazardous waste)) Large Quantity Generators, more that 1000 kg of hazardous waste/month (Resource Conservation and Recovery Act (tracking hazardous waste)) - notification STATE MASTER (South Carolina database) - AIR PROGRAM, HAZARDOUS WASTE PROGRAM, TRI REPORTER, AIR MAJOR, ASBESTOS ABATEMENT PROGRAM, STATE MASTER (South Carolina database) - LABORATORY CERTIFICATION TRI REPORTER (Tracking of toxic chemicals releasing facilities) Business SIC and NAICS classification: PRESSED AND BLOWN GLASS AND GLASSWARE Organizations: AGY HOLDINGS CORP (CONTACT/OPERATOR)
, ADVANCED GLASSFIBER YARNS LLC (CONTACT/OWNER)
Alternative names: ADVANCED GLASSFIBER YARNS LLC, AGY, AGY AIKEN LLC, OWENS CORNING, AIKEN PLANT - LINE 1
AIKEN COUNTY (828 RICHLAND AVE W in AIKEN, SC)
National Pollutant Discharge Elimination System NON-MAJOR (Tracking pollutant discharge elimination systems) - permit National Pollutant Discharge Elimination System NON-MAJOR (Tracking pollutant discharge elimination systems) - permit National Pollutant Discharge Elimination System NON-MAJOR (Tracking pollutant discharge elimination systems) - permit National Pollutant Discharge Elimination System NON-MAJOR (Tracking pollutant discharge elimination systems) - permit STATE MASTER (South Carolina database) - REFUSE DISPOSAL, UNDERGROUND STORAGE TANK PROGRAM, MATERIAL RECYCLING, MINE OPERATING PERMIT, OIL CONTROL, DRINKING WATER PROGRAM STATE MASTER (South Carolina database) - 401 CERTIFICATION, MINE OPERATING PERMIT, DRINKING WATER PROGRAM STATE MASTER (South Carolina database) - 401 CERTIFICATION, UNDERGROUND STORAGE TANK PROGRAM, DAM SITE Business SIC classification: LOCAL TRUCKING WITH STORAGE; SANITARY SERVICES Organizations: JOHNSON LASCHOBER & ASSOCIATES PE (AGENT / PUBLIC NOTICE APPLICANT)
, DAVIS & FLOYD (CONTACT/ENGINEERING/CONSULTING FIRM)
Alternative names: AIKEN COUNTY ADMINISTRATIVE COMPLEX, AIKEN COUNTY GOVERNMENT, AIKEN COUNTY PUBLIC WORKS
ASCO VALVE MANUFACTURING (1561 COLUMBIA HIGHWAY in AIKEN, SC)
AIR MINOR (AIRS/AFS) CRITERIA AND HAZARDOUS AIR POLLUTANT INVENTORY (Inventory of air pollution sources) National Pollutant Discharge Elimination System NON-MAJOR (Tracking pollutant discharge elimination systems) - permit Small Quantity Generators, between 100 kg and 1000 kg of hazardous waste/month (Resource Conservation and Recovery Act (tracking hazardous waste)) STATE MASTER (South Carolina database) - AIR PROGRAM, TRI REPORTER, HAZARDOUS WASTE PROGRAM, AIR PROGRAM STATE MASTER (South Carolina database) - UNDERGROUND STORAGE TANK PROGRAM TRI REPORTER (Tracking of toxic chemicals releasing facilities) Business SIC classification: INDUSTRIAL VALVES; FLUID POWER VALVES AND HOSE FITTINGS Business NAICS classification: INDUSTRIAL VALVE MANUFACTURING.; FLUID POWER VALVE AND HOSE FITTING MANUFACTURING.; RELAY AND INDUSTRIAL CONTROL MANUFACTURING. Organizations: WILLIAM H BROWN (CONTACT/ENGINEERING/CONSULTING FIRM)
, ASCO VALUE MFG INC (CONTACT/OWNER)
Alternative names: ASCO VALUE MFG INC, ASCO VALVE MFG. INC., AUTOMATIC SWITCH CO., AUTOMATIC SWITCH THERMODISC
DEPOT FOOD STORE 101 (1850 WHISKEY RD in AIKEN, SC)
(Resource Conservation and Recovery Act (tracking hazardous waste)) STATE MASTER (South Carolina database) - HAZARDOUS WASTE PROGRAM STATE MASTER (South Carolina database) - UNDERGROUND STORAGE TANK PROGRAM Organizations: THE PANTRY INC (CONTACT/OWNER)
Alternative names: DEPOT 101, DEPOT STORE 101
AIKEN MIDDLE SCHOOL (101 GATOR LANE in AIKEN, SC)
(National Center for Education Statistics) - STATE ID-0201057 Conditionally Exempt Small Quantity Generators, less than 100 kg/month of hazardous waste (Resource Conservation and Recovery Act (tracking hazardous waste)) - notification STATE MASTER (South Carolina database) - HAZARDOUS WASTE PROGRAM STATE MASTER (South Carolina database) - DRINKING WATER PROGRAM Organizations: AIKEN COUNTY SCHOOL DISTRICT (CONTACT/OWNER)
CHEMPHAR INC (2969 WAGENER RD in AIKEN, SC)
COMPLIANCE ACTIVITY (Tracking inspections of insecticide, fungicide, and rodenticide, and toxic substances) STATE MASTER (New Jersey environmental info) - NJEMS-002526, PESTICIDES - MANUFACTURE (Resource Conservation and Recovery Act (tracking hazardous waste)) STATE MASTER (South Carolina database) - HAZARDOUS WASTE PROGRAM Organizations: ALCHEMISTS INC, EQUINE AMERICA, BRUCE SNIPES (CONTACT/OWNER)
FAST FARE SC 682 (2390 WHISKEY ROAD in AIKEN, SC)
(Resource Conservation and Recovery Act (tracking hazardous waste)) STATE MASTER (South Carolina database) - HAZARDOUS WASTE PROGRAM STATE MASTER (South Carolina database) - UNDERGROUND STORAGE TANK PROGRAM Organizations: CROWN CENTRAL PETROLEUM CORP (CONTACT/OWNER)
Alternative names: FAST FARE SC 682 DEACTIVATED, SC682
DEPOT FOOD STORE 103 (1107 YORK ST in AIKEN, SC)
(Resource Conservation and Recovery Act (tracking hazardous waste)) STATE MASTER (South Carolina database) - HAZARDOUS WASTE PROGRAM STATE MASTER (South Carolina database) - UNDERGROUND STORAGE TANK PROGRAM Organizations: THE PANTRY INC (CONTACT/OWNER)
Alternative names: PANTRY 3246 DBA DEPOT
AIKEN MACHINE AND FABRICATIONS (1563 EDGEFIELD HWY in AIKEN, SC)
(Resource Conservation and Recovery Act (tracking hazardous waste)) - ICIS-, ENFORCEMENT/COMPLIANCE ACTIVITY STATE MASTER (South Carolina database) - HAZARDOUS WASTE PROGRAM Organizations: BUSINESS DEVELOPMENT CORP (CONTACT/OWNER)
DEPOT FOOD STORE 108 (318 HAMPTON AVENUE in AIKEN, SC)
(Resource Conservation and Recovery Act (tracking hazardous waste)) STATE MASTER (South Carolina database) - HAZARDOUS WASTE PROGRAM STATE MASTER (South Carolina database) - UNDERGROUND STORAGE TANK PROGRAM Organizations: THE PANTRY INC (CONTACT/OWNER)
Alternative names: DEPOT 108
AIKEN SCHOOL BUS SHOP (1574 COLUMBIA HWY N in AIKEN, SC)
Conditionally Exempt Small Quantity Generators, less than 100 kg/month of hazardous waste (Resource Conservation and Recovery Act (tracking hazardous waste)) - notification STATE MASTER (South Carolina database) - HAZARDOUS WASTE PROGRAM STATE MASTER (South Carolina database) - National Pollutant Discharge Elimination System Permit Organizations: OPERNAME (CONTACT/OPERATOR)
, SC DEPT. OF EDUCATION (CONTACT/OWNER)
Alternative names: SC DEPT OF ED/AIKEN BUS SHOP
BELLSOUTH TELECOMMUNICATIONS INC - AIKEN (231 LAURENS ST in AIKEN, SC)
AIR MINOR (AIRS/AFS) STATE MASTER (South Carolina database) - AIR PROGRAM STATE MASTER (South Carolina database) - UNDERGROUND STORAGE TANK PROGRAM Business SIC classification: SERVICES Alternative names: AIKEN CENTRAL OFFICE, BELLSOUTH:AIKEN-LAURENS ST
AMERADA HESS STATION 40248 (1224 RICHLAND AVE in AIKEN, SC)
Conditionally Exempt Small Quantity Generators, less than 100 kg/month of hazardous waste (Resource Conservation and Recovery Act (tracking hazardous waste)) - notification STATE MASTER (South Carolina database) - HAZARDOUS WASTE PROGRAM STATE MASTER (South Carolina database) - UNDERGROUND STORAGE TANK PROGRAM Organizations: AMERADA HESS CORP (CONTACT/OWNER)
Housing units lacking complete plumbing facilities: 3.5% Housing units lacking complete kitchen facilities: 4.1%
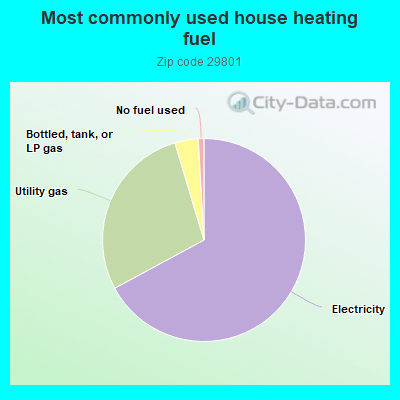
66.8%Electricity
28.1%Utility gas
3.7%Bottled, tank, or LP gas
0.9%No fuel used
Population in 1990: 51,233.
Place of birth for U.S.-born residents:
This state: 14,980
Northeast: 2,495
Midwest: 1,607
South: 9,518
West: 717
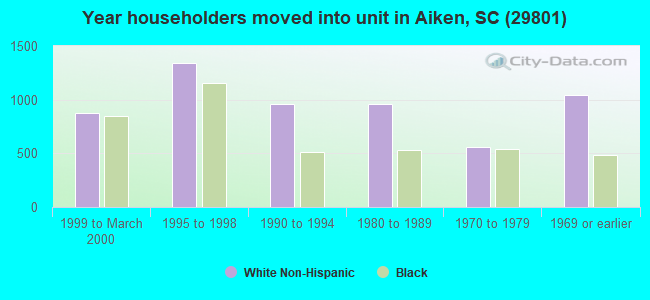
59% of the 29801 zip code residents lived in the same house 5 years ago. Out of people who lived in different houses, 66% lived in this county. Out of people who lived in different counties, 50% lived in South Carolina.
85% of the 29801 zip code residents lived in the same house 1 year ago. Out of people who lived in different houses, 46% moved from this county. Out of people who lived in different houses, 15% moved from different county within same state. Out of people who lived in different houses, 38% moved from different state. Out of people who lived in different houses, 1% moved from abroad.
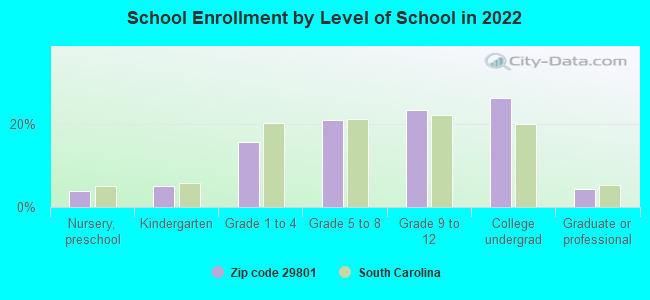
Private vs. public school enrollment:
Students in private schools in grades 1 to 8 (elementary and middle school): 755
Here:
25.0%
South Carolina:
14.4%
Students in private schools in grades 9 to 12 (high school): 406
Here:
21.3%
South Carolina:
11.1%
Students in private undergraduate colleges: 472
Here:
22.3%
South Carolina:
21.9%
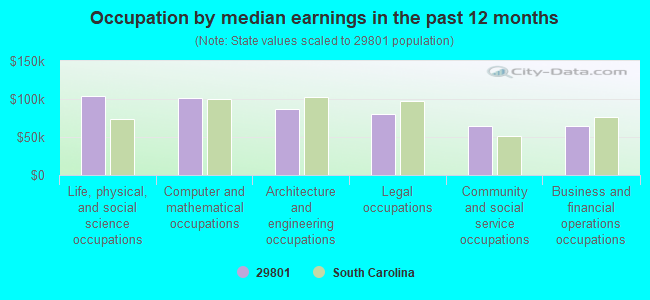
Occupation by median earnings in the past 12 months ($)
104,510Life, physical, and social science occupations
101,564Computer and mathematical occupations
86,765Architecture and engineering occupations
79,966Legal occupations
64,386Community and social service occupations
64,112Business and financial operations occupations
Companies with federal contracts located in this zip code (AIKEN, SC):
TETRA TECH EM INC (235 BARWELL AVE , NW) : $292,697 in 6 contractsin 2000
Contracts for Architect - Engineer Services (including landscaping, interior layout, and designing) by Navy Signed by year:2000: $292,697; 2001: $0; 2002: $0; 2003: $0; 2004: $0; 2005: $0; 2006: $0.
Biggest contracts:
$116,101 with Navy for Architect - Engineer Services (including landscaping, interior layout, and designing). Taking place in FL. Signed on 2000-09-28. Completion date: 2001-09-30.
$51,257, same as above.Signed on 2000-09-29. Completion date: 2001-05-30.
$47,490, same as above.Signed on 2000-09-22. Completion date: 2001-04-15.
$36,971, same as above.Signed on 2000-10-01. Completion date: 2001-03-01.
ANNE GRIFFITH PT (1033 HAYNE AVE SW; small business) : $199,902 in 8 contractsfrom 2000 to 2004
Contracts for Education Services, Medical/Psychiatric Consultation Services, Physical Medicine and Rehabilitation Services by Department of Defense, Department of Defense Education Activity, Army Signed by year:2000: $49,984; 2001: $0; 2002: $91,665; 2003: $0; 2004: $58,253; 2005: $0; 2006: $0.
Biggest contracts:
$54,000 with Department of Defense for Education Services. Signed on 2002-03-01. Completion date: 2002-07-31.
$49,984, same as above.Signed on 2000-12-01. Completion date: 2001-09-30.
$49,815 with Department of Defense Education Activity for Medical/Psychiatric Consultation Services. Signed on 2004-08-05. Completion date: 2005-07-29.
$37,665 with Department of Defense for Education Services. Signed on 2002-12-12. Completion date: 2003-09-09.
REMOTE TOOLS, INC. (1120 EDGEFIELD HIGHWAY; small business)
$69,914 with Navy for Defense Ships -- Applied Research and Exploratory Development (R&D). Signed on 2000-05-10. Completion date: 2000-11-10.
MARKET PLACE ART (115 NEWBERRY ST NW; small business)
$24,933 with Army for Office Furniture. Taking place in GA. Signed on 2004-09-20. Completion date: 2004-10-29.
A & A ELECTRIC MOTOR & REPAIR (1928 PARK AVE SE; small business)
$3,045 with Army for Miscellaneous Electrical and Electronic Components. Signed on 2003-06-11. Completion date: 2003-07-18.
AIKEN PEST CONTROL, INC (2739 WAGNER RD; small business) : $600 in 2 contractsin 2003
$600 with Army for Insect and Rodent Control Services. Signed on 2003-08-01. Completion date: 2004-07-31.
$0, same as above.Signed on 2003-08-01. Completion date: 2004-07-31.
Top industries in this zip code by the number of employees in 2005:
2003 - 2018 National Fire Incident Reporting System (NFIRS) incidents
According to the data from the years 2003 - 2018 the average number of fires per year is 167. The highest number of fires - 239 took place in 2017, and the least - 59 in 2003. The data has an increasing trend.
When looking into fire subcategories, the most incidents belonged to: Structure Fires (42.9%), and Outside Fires (38.6%).
Fire incident types reported to NFIRS in Zip Code 29801


 Nearest zip codes: 29805, 29803, 29850, 29851, 29828, 29829.
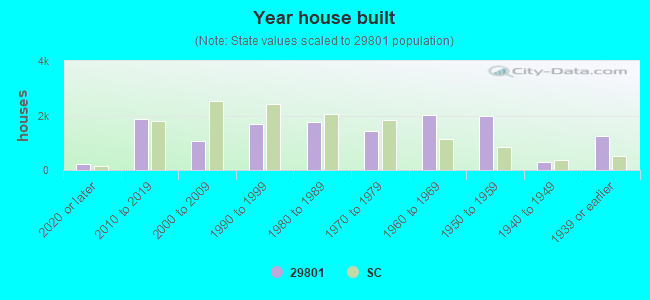


 According to the data from the years 2003 - 2018 the average number of fires per year is 167. The highest number of fires - 239 took place in 2017, and the least - 59 in 2003. The data has an increasing trend.
 When looking into fire subcategories, the most incidents belonged to: Structure Fires (42.9%), and Outside Fires (38.6%).