Estimated zip code population in 2022: 4,274 Zip code population in 2010: 3,892 Zip code population in 2000: 3,692
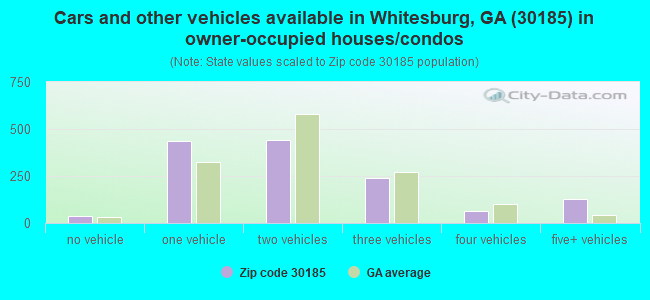
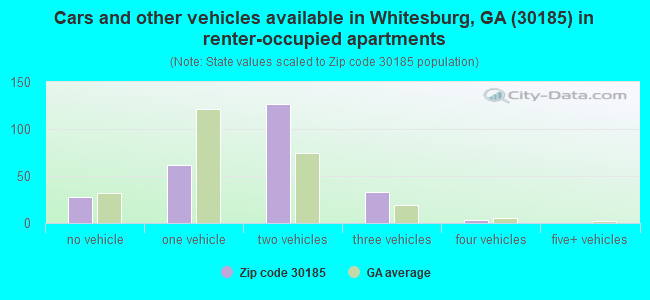
Houses and condos: 1,727 Renter-occupied apartments: 250
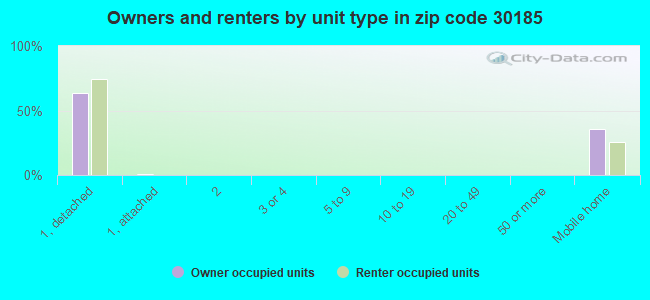
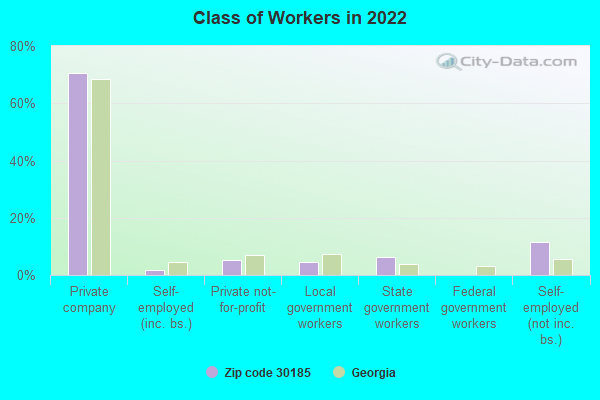
% of renters here:
16%
State:
34%
March 2022 cost of living index in zip code 30185: 87.8 (less than average, U.S. average is 100)
Land area: 63.3 sq. mi. Water area: 0.6 sq. mi.
Population density: 68 people per square mile
(very low).
OSM Map
General Map
Google Map
MSN Map
OSM Map
General Map
Google Map
MSN Map
OSM Map
General Map
Google Map
MSN Map
OSM Map
General Map
Google Map
MSN Map
Please wait while loading the map...
Real estate property taxes paid for housing units in 2022:
This zip code:
0.5% ($903)
Georgia:
0.7% ($2,160)
Median real estate property taxes paid for housing units with mortgages in 2022: $1,525 (0.7%) Median real estate property taxes paid for housing units with no mortgage in 2022: $476 (0.4%)
Averages for the 2020 tax year for zip code 30185, filed in 2021:
Average Adjusted Gross Income (AGI) in 2020: $65,772 (Individual Income Tax Returns)
Here:
$65,772
State:
$70,847
Salary/wage: $53,696 (reported on 82.8% of returns)
Here:
$53,696
State:
$59,126
(% of AGI for various income ranges: 1081.9% for AGIs below $25k, 3700.5% for AGIs $25k-50k, 6549.1% for AGIs $50k-75k, 9725.8% for AGIs $75k-100k, 18166.2% for AGIs $100k-200k)
Taxable interest for individuals: $862 (reported on 20.3% of returns)
This zip code:
$862
Georgia:
$2,011
(% of AGI for various income ranges: 13.8% for AGIs below $25k, 7.4% for AGIs $25k-50k, 18.2% for AGIs $50k-75k, 45.8% for AGIs $75k-100k, 70.0% for AGIs $100k-200k)
Ordinary dividends: $3,064 (reported on 13.0% of returns)
Here:
$3,064
State:
$8,996
(% of AGI for various income ranges: 23.0% for AGIs below $25k, 19.7% for AGIs $25k-50k, 51.4% for AGIs $50k-75k, 96.7% for AGIs $75k-100k, 125.6% for AGIs $100k-200k)
Net capital gain/loss in AGI: +$14,130 (reported on 10.4% of returns)
Here:
+$14,130
State:
+$28,402
(% of AGI for various income ranges: 1.9% for AGIs below $25k, 15.0% for AGIs $25k-50k, 65.0% for AGIs $50k-75k, 100.8% for AGIs $75k-100k, 318.1% for AGIs $100k-200k)
Profit/loss from business: +$6,779 (reported on 17.2% of returns)
Here:
+$6,779
State:
+$6,707
(% of AGI for various income ranges: 127.7% for AGIs below $25k, 146.1% for AGIs $25k-50k, 166.8% for AGIs $50k-75k, 57.5% for AGIs $75k-100k, 403.7% for AGIs $100k-200k)
Taxable individual retirement arrangement distribution: $21,471 (reported on 7.3% of returns)
30185:
$21,471
Georgia:
$20,525
(% of AGI for various income ranges: 35.3% for AGIs below $25k, 71.8% for AGIs $25k-50k, 167.3% for AGIs $50k-75k, 380.0% for AGIs $75k-100k, 1089.4% for AGIs $100k-200k)
Total itemized deductions: $38,700 (reported on 7.3% of returns)
Here:
$38,700
State:
$34,001
(% of AGI for various income ranges: 146.6% for AGIs $25k-50k, 412.5% for AGIs $75k-100k, 1295.6% for AGIs $100k-200k)
Charity contributions: $13,142 (reported on 6.2% of returns)
Here:
$13,142
State:
$14,164
(% of AGI for various income ranges: 104.1% for AGIs $50k-75k, 397.5% for AGIs $100k-200k)
Taxes paid: $7,186 (reported on 7.3% of returns)
30185:
$7,186
State:
$7,540
(% of AGI for various income ranges: 24.7% for AGIs $25k-50k, 100.0% for AGIs $75k-100k, 276.9% for AGIs $100k-200k)
Earned income credit: $2,214 (reported on 19.3% of returns)
Here:
$2,214
State:
$2,530
(% of AGI for various income ranges: 98.1% for AGIs below $25k, 94.2% for AGIs $25k-50k)
Percentage of individuals using paid preparers for their 2020 taxes: 93.2%
Here:
93%
State:
93%
(% for various income ranges: 93.3% for AGIs below $25k, 91.7% for AGIs $25k-50k, 93.5% for AGIs $50k-75k, 94.7% for AGIs $75k-100k, 92.9% for AGIs $100k-200k, 100.0% for AGIs over 200k)
Averages for the 2012 tax year for zip code 30185, filed in 2013:
Average Adjusted Gross Income (AGI) in 2012: $45,973 (Individual Income Tax Returns)
Here:
$45,973
State:
$56,131
Salary/wage: $41,508 (reported on 86.3% of returns)
Here:
$41,508
State:
$47,942
(% of AGI for various income ranges: 72.2% for AGIs below $25k, 84.8% for AGIs $25k-50k, 78.0% for AGIs $50k-75k, 78.1% for AGIs $75k-100k, 75.4% for AGIs $100k-200k)
Taxable interest for individuals: $680 (reported on 21.7% of returns)
This zip code:
$680
Georgia:
$1,706
(% of AGI for various income ranges: 0.5% for AGIs below $25k, 0.4% for AGIs $25k-50k, 0.3% for AGIs $50k-75k, 0.4% for AGIs $75k-100k, 0.2% for AGIs $100k-200k)
Ordinary dividends: $1,877 (reported on 13.7% of returns)
Here:
$1,877
State:
$7,265
(% of AGI for various income ranges: 0.7% for AGIs below $25k, 0.2% for AGIs $25k-50k, 0.7% for AGIs $50k-75k, 0.9% for AGIs $75k-100k, 0.4% for AGIs $100k-200k)
Profit/loss from business: +$4,321 (reported on 17.4% of returns)
Here:
+$4,321
State:
+$7,583
(% of AGI for various income ranges: 9.4% for AGIs below $25k, 1.3% for AGIs $50k-75k, 0.3% for AGIs $75k-100k, 0.9% for AGIs $100k-200k)
Taxable individual retirement arrangement distribution: $14,808 (reported on 8.1% of returns)
30185:
$14,808
Georgia:
$17,199
(% of AGI for various income ranges: 1.6% for AGIs below $25k, 2.2% for AGIs $25k-50k, 2.7% for AGIs $50k-75k, 7.7% for AGIs $75k-100k)
Total itemized deductions: $19,669 (25% of AGI, reported on 31.7% of returns)
Here:
$19,669
State:
$23,886
Here:
24.8% of AGI
State:
21.5% of AGI
(% of AGI for various income ranges: 7.8% for AGIs below $25k, 11.6% for AGIs $25k-50k, 13.5% for AGIs $50k-75k, 15.1% for AGIs $75k-100k, 16.0% for AGIs $100k-200k)
Charity contributions: $4,600 (reported on 25.5% of returns)
Here:
$4,600
State:
$5,507
(% of AGI for various income ranges: 1.1% for AGIs below $25k, 2.2% for AGIs $25k-50k, 2.2% for AGIs $50k-75k, 2.9% for AGIs $75k-100k, 3.3% for AGIs $100k-200k)
Taxes paid: $5,612 (reported on 31.7% of returns)
30185:
$5,612
State:
$7,838
(% of AGI for various income ranges: 1.0% for AGIs below $25k, 1.9% for AGIs $25k-50k, 3.4% for AGIs $50k-75k, 4.6% for AGIs $75k-100k, 6.0% for AGIs $100k-200k)
Earned income credit: $2,426 (reported on 24.2% of returns)
Here:
$2,426
State:
$2,589
(% of AGI for various income ranges: 8.5% for AGIs below $25k, 1.6% for AGIs $25k-50k)
Percentage of individuals using paid preparers for their 2012 taxes: 52.8%
Here:
53%
State:
55%
(% for various income ranges: 49.2% for AGIs below $25k, 47.6% for AGIs $25k-50k, 63.6% for AGIs $50k-75k, 62.5% for AGIs $75k-100k, 56.2% for AGIs $100k-200k)
Averages for the 2004 tax year for zip code 30185, filed in 2005:
Average Adjusted Gross Income (AGI) in 2004: $42,372 (Individual Income Tax Returns)
Here:
$42,372
State:
$47,553
Salary/wage: $38,120 (reported on 86.7% of returns)
Here:
$38,120
State:
$42,178
(% of AGI for various income ranges: 101.8% for AGIs below $10k, 76.4% for AGIs $10k-25k, 88.6% for AGIs $25k-50k, 87.5% for AGIs $50k-75k, 85.3% for AGIs $75k-100k, 55.4% for AGIs over 100k)
Taxable interest for individuals: $901 (reported on 32.3% of returns)
This zip code:
$901
Georgia:
$1,772
(% of AGI for various income ranges: 2.9% for AGIs below $10k, 1.7% for AGIs $10k-25k, 0.5% for AGIs $25k-50k, 0.4% for AGIs $50k-75k, 0.4% for AGIs $75k-100k, 0.8% for AGIs over 100k)
Taxable dividends: $1,581 (reported on 17.4% of returns)
Here:
$1,581
State:
$4,283
(% of AGI for various income ranges: 2.5% for AGIs below $10k, 0.8% for AGIs $10k-25k, 0.4% for AGIs $25k-50k, 0.5% for AGIs $50k-75k, 0.8% for AGIs $75k-100k, 0.7% for AGIs over 100k)
Net capital gain/loss: +$12,301 (reported on 10.6% of returns)
Here:
+$12,301
State:
+$16,461
(% of AGI for various income ranges: 1.1% for AGIs below $10k, 0.1% for AGIs $10k-25k, -0.0% for AGIs $25k-50k, 0.4% for AGIs $50k-75k, 1.6% for AGIs $75k-100k, 10.1% for AGIs over 100k)
Profit/loss from business: +$3,587 (reported on 18.0% of returns)
Here:
+$3,587
State:
+$8,201
(% of AGI for various income ranges: 12.8% for AGIs below $10k, 11.6% for AGIs $10k-25k, 1.6% for AGIs $25k-50k, -0.7% for AGIs $50k-75k, -1.1% for AGIs $75k-100k, 0.7% for AGIs over 100k)
IRA payment deduction: $3,118 (reported on 1.1% of returns)
30185:
$3,118
Georgia:
$2,969
Total itemized deductions: $18,306 (25% of AGI, reported on 33.8% of returns)
Here:
$18,306
State:
$19,944
Here:
24.6% of AGI
State:
22.6% of AGI
(% of AGI for various income ranges: 11.1% for AGIs below $10k, 7.1% for AGIs $10k-25k, 12.9% for AGIs $25k-50k, 15.9% for AGIs $50k-75k, 16.6% for AGIs $75k-100k, 16.5% for AGIs over 100k)
Charity contributions deductions: $3,131 (4% of AGI, reported on 29.9% of returns)
Here:
$3,131
State:
$4,354
Here:
4.5% of AGI
State:
4.7% of AGI
(% of AGI for various income ranges: 1.1% for AGIs $10k-25k, 1.9% for AGIs $25k-50k, 2.6% for AGIs $50k-75k, 3.4% for AGIs $75k-100k, 1.9% for AGIs over 100k)
Total tax: $5,135 (reported on 75.0% of returns)
30185:
$5,135
State:
$8,223
(% of AGI for various income ranges: 3.6% for AGIs below $10k, 4.7% for AGIs $10k-25k, 6.0% for AGIs $25k-50k, 7.8% for AGIs $50k-75k, 10.1% for AGIs $75k-100k, 14.0% for AGIs over 100k)
Earned income credit: $1,777 (reported on 20.1% of returns)
Here:
$1,777
State:
$1,986
Percentage of individuals using paid preparers for their 2004 taxes: 61.6%
Here:
62%
State:
62%
(% for various income ranges: 53.0% for AGIs below $10k, 64.3% for AGIs $10k-25k, 62.9% for AGIs $25k-50k, 64.7% for AGIs $50k-75k, 63.9% for AGIs $75k-100k, 60.2% for AGIs over 100k)
Household received Food Stamps/SNAP in the past 12 months: 325 Household did not receive Food Stamps/SNAP in the past 12 months: 1,270
Women who had a birth in the past 12 months: 116 (84 now married, 31 unmarried) Women who did not have a birth in the past 12 months: 1,024 (466 now married, 557 unmarried)
Housing units in zip code 30185 with a mortgage: 636 (28 second mortgage, 30 both second mortgage and home equity loan) Median monthly owner costs for units with a mortgage: $1,187 Median monthly owner costs for units without a mortgage: $358
Residents with income below the poverty level in 2022:
This zip code:
18.7%
Whole state:
12.7%
Residents with income below 50% of the poverty level in 2022:
This zip code:
16.1%
Whole state:
6.3%
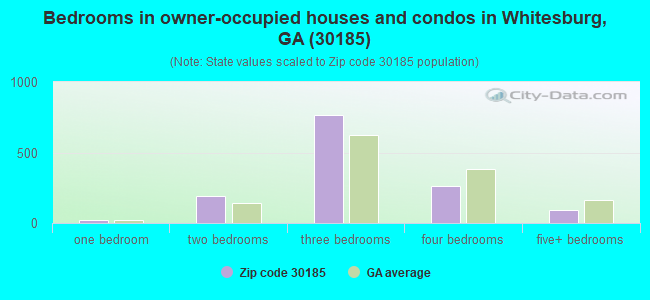
Median number of rooms in houses and condos:
Here:
6.2
State:
6.8
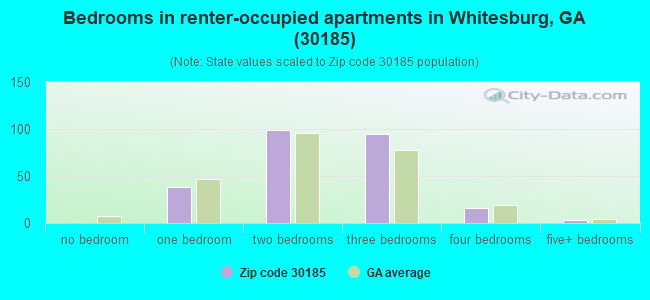
Median number of rooms in apartments:
Here:
5.0
State:
4.6
Notable locations in this zip code not listed on our city pages
Churches in zip code 30185 include: Antioch Church (A), Whitesburg Baptist Church (B), Mount Calvary Church (C), Mount Sinai Church (D), Mount Zion Church (E), Rotherwood Church (F), Saint Pauls Church (G), Ephesus Church (H), County Line Primitive Baptist Church (I). Display/hide their locations on the map
Cemeteries: Springer Cemetery (1), Mount Avery Cemetery (2), Mount Calvary Cemetery (3), Saint Paul Cemetery (4), Whitesburg Cemetery (5), Wilson Cemetery (6), Antioch Cemetery (7). Display/hide their locations on the map
Creeks: Wolf Creek (A), Stovall Creek (B), Jacks Creek (C), Hurricane Creek (D), Snake Creek (E), Guthrie Creek (F), Crews Creek (G), Acorn Creek (H), Mill Creek (I). Display/hide their locations on the map
Size of family households: 440 2-persons, 297 3-persons, 257 4-persons, 25 5-persons, 40 6-persons, 51 7-or-more-persons
Size of nonfamily households: 358 1-person, 105 2-persons, 11 3-persons
335 married couples with children.
88 single-parent households (25 men, 63 women).
97.8% of residents of 30185 zip code speak English at home.
2.0% of residents speak Spanish at home (91% very well, 9% well).
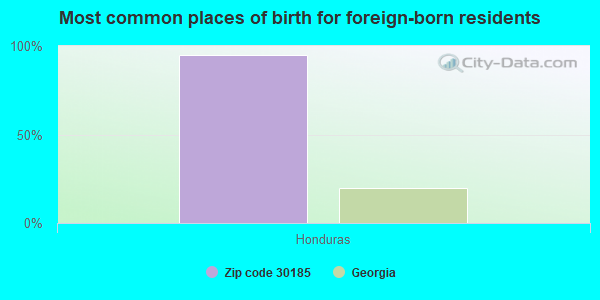
Foreign born population: 18 (0.4%) (0.0% of them are naturalized citizens)
:
0.4%
Whole state:
10.7%
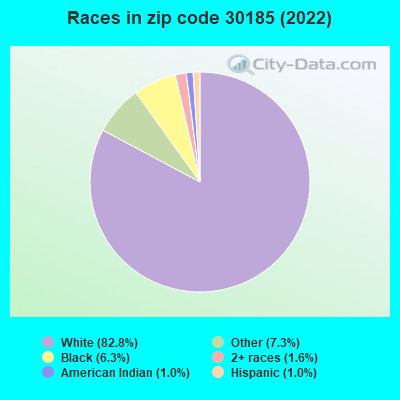
95%Honduras
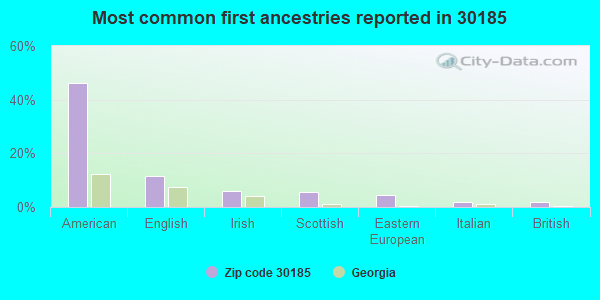
46%American
12%English
6%Irish
6%Scottish
4%Eastern European
2%Italian
2%British
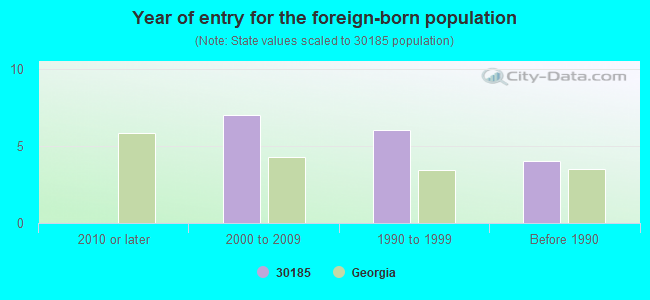
Year of entry for the foreign-born population
02010 or later
72000 to 2009
61990 to 1999
4Before 1990
Facilities with environmental interests located in this zip code:
LJS GREASE & TALLOW I (896 HUTCHESON FERRY in WHITESBURG, GA)
AIR MINOR (AIRS/AFS) Business SIC classification: ANIMAL AND MARINE FATS AND OILS Alternative names: LJS GREASE & TALLOW INCORPORATED
BLASTRITE SERVICES INCORPORATED (114 MCLARTY RD. in WHITESBURG, GA)
TRI REPORTER (Tracking of toxic chemicals releasing facilities) Business SIC classification: EXPLOSIVES
OEI INCORPORATED (110 MCLARTY RD. in WHITESBURG, GA)
TRI REPORTER (Tracking of toxic chemicals releasing facilities)
Housing units lacking complete plumbing facilities: 3.0% Housing units lacking complete kitchen facilities: 3.0%
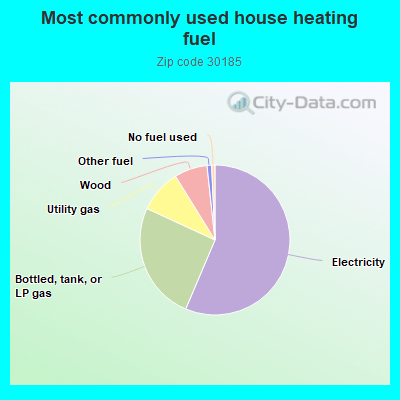
56.4%Electricity
25.5%Bottled, tank, or LP gas
9.3%Utility gas
7.1%Wood
1.0%Other fuel
0.7%No fuel used
Population in 1990: 3,115. Population change in the 1990s: +577 (+18.5%).
Place of birth for U.S.-born residents:
This state: 3,291
Northeast: 142
Midwest: 110
South: 614
West: 57
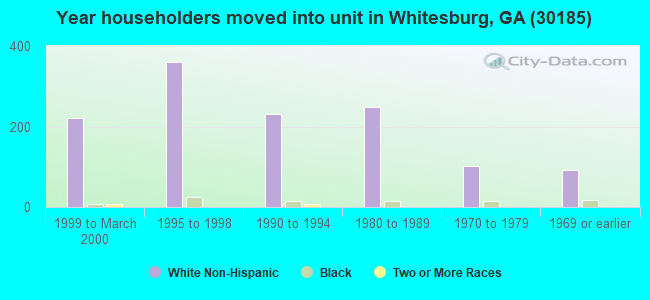
57% of the 30185 zip code residents lived in the same house 5 years ago. Out of people who lived in different houses, 52% lived in this county. Out of people who lived in different counties, 50% lived in Georgia.
91% of the 30185 zip code residents lived in the same house 1 year ago. Out of people who lived in different houses, 36% moved from this county. Out of people who lived in different houses, 52% moved from different county within same state. Out of people who lived in different houses, 11% moved from different state.
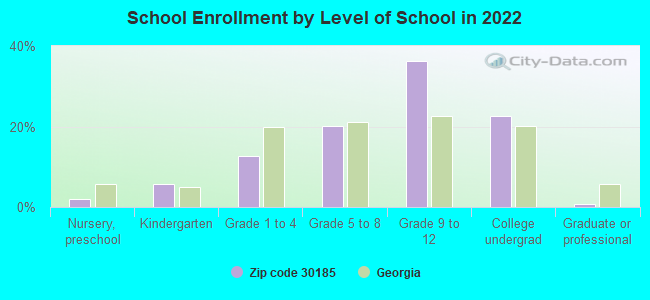
Private vs. public school enrollment:
Students in private schools in grades 1 to 8 (elementary and middle school): 42
Here:
14.3%
Georgia:
12.1%
Students in private schools in grades 9 to 12 (high school):
Here:
0.0%
Georgia:
10.8%
Students in private undergraduate colleges: 8
Here:
4.1%
Georgia:
17.1%
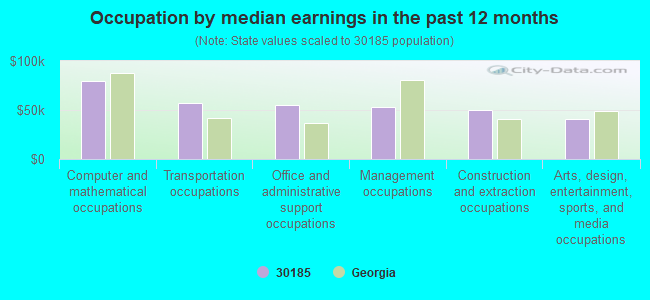
Occupation by median earnings in the past 12 months ($)
79,936Computer and mathematical occupations
57,479Transportation occupations
55,147Office and administrative support occupations
53,429Management occupations
50,125Construction and extraction occupations
40,525Arts, design, entertainment, sports, and media occupations
Companies with federal contracts located in this zip code:
PATE AND SONS LANDSCAPING (468 E HIGHWAY 5 in WHITESBURG, GA; small business) : $54,715 in 2 contractsin 2000
$54,090 with Army for Maintenance, Repair or Alteration of Real Property -- Miscellaneous Buildings. Signed on 2000-09-22. Completion date: 2000-12-29.
$625 with Army for Miscellaneous Service and Trade Equipment. Signed on 2000-09-29. Completion date: 2000-12-01.
Top industries in this zip code by the number of employees in 2005:
Construction: Other Heavy and Civil Engineering Construction (20-49 employees: 1 establishment)
Construction: Poured Concrete Foundation and Structure Contractors (10-19: 1, 1-4: 1)
Wholesale Trade: Other Chemical and Allied Products Merchant Wholesalers (10-19: 1)
Mining: Support Activities for Coal Mining (5-9: 1)
Other Services (except Public Administration): Religious Organizations (1-4: 3)
Health Care and Social Assistance: Child Day Care Services (1-4: 2)
Construction: Plumbing, Heating, and Air-Conditioning Contractors (1-4: 2)
Other Services (except Public Administration): General Automotive Repair (1-4: 2)
Fatal accident statistics in 2013:
Fatal accident count: 1
Vehicles involved in fatal accidents: 1
Fatal accidents caused by drunken drivers: 1
Fatalities: 1
Persons involved in fatal accidents: 1
Pedestrians involved in fatal accidents: 0
Fatal accident statistics in 2012:
Fatal accident count: 1
Vehicles involved in fatal accidents: 1
Fatal accidents caused by drunken drivers: 1
Fatalities: 1
Persons involved in fatal accidents: 1
Pedestrians involved in fatal accidents: 0
Home Mortgage Disclosure Act Aggregated Statistics For Year 2009 (Based on 2 partial tracts)
A) FHA, FSA/RHS & VA Home Purchase Loans
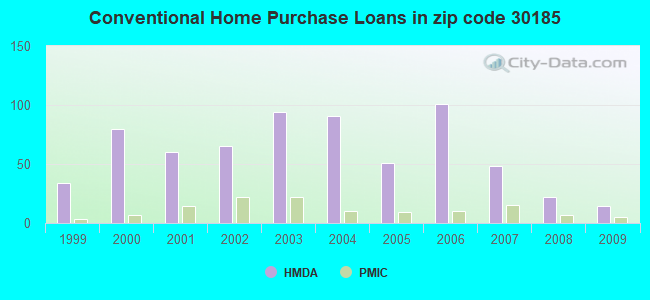
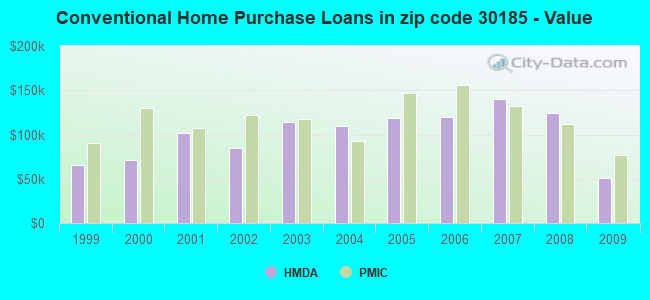
B) Conventional Home Purchase Loans
C) Refinancings
D) Home Improvement Loans
F) Non-occupant Loans on < 5 Family Dwellings (A B C & D)
G) Loans On Manufactured Home Dwelling (A B C & D)
Number
Average Value
Number
Average Value
Number
Average Value
Number
Average Value
Number
Average Value
Number
Average Value
LOANS ORIGINATED
17
$123,609
14
$51,214
118
$140,724
9
$78,716
22
$80,349
12
$33,796
APPLICATIONS APPROVED, NOT ACCEPTED
2
$207,910
2
$89,840
3
$149,443
3
$2,280
3
$61,603
2
$2,565
APPLICATIONS DENIED
7
$188,477
10
$44,662
51
$181,488
10
$20,021
0
$0
17
$45,498
APPLICATIONS WITHDRAWN
5
$130,394
0
$0
48
$170,656
2
$2,565
2
$53,045
5
$109,516
FILES CLOSED FOR INCOMPLETENESS
0
$0
0
$0
7
$219,767
0
$0
0
$0
0
$0
Aggregated Statistics For Year 2008 (Based on 2 partial tracts)
A) FHA, FSA/RHS & VA Home Purchase Loans
B) Conventional Home Purchase Loans
C) Refinancings
D) Home Improvement Loans
F) Non-occupant Loans on < 5 Family Dwellings (A B C & D)
G) Loans On Manufactured Home Dwelling (A B C & D)
Number
Average Value
Number
Average Value
Number
Average Value
Number
Average Value
Number
Average Value
Number
Average Value
LOANS ORIGINATED
12
$108,947
22
$124,062
144
$121,709
12
$49,768
34
$77,256
31
$63,922
APPLICATIONS APPROVED, NOT ACCEPTED
2
$91,550
3
$102,100
17
$108,812
0
$0
2
$32,515
9
$65,596
APPLICATIONS DENIED
5
$82,138
14
$67,348
87
$152,199
22
$59,270
9
$94,687
19
$47,283
APPLICATIONS WITHDRAWN
3
$88,983
7
$67,959
43
$138,130
0
$0
2
$72,725
3
$58,750
FILES CLOSED FOR INCOMPLETENESS
0
$0
0
$0
2
$209,620
0
$0
0
$0
0
$0
Aggregated Statistics For Year 2007 (Based on 2 partial tracts)
A) FHA, FSA/RHS & VA Home Purchase Loans
B) Conventional Home Purchase Loans
C) Refinancings
D) Home Improvement Loans
F) Non-occupant Loans on < 5 Family Dwellings (A B C & D)
G) Loans On Manufactured Home Dwelling (A B C & D)
Number
Average Value
Number
Average Value
Number
Average Value
Number
Average Value
Number
Average Value
Number
Average Value
LOANS ORIGINATED
21
$127,525
48
$139,677
154
$135,907
38
$61,333
60
$114,936
24
$72,512
APPLICATIONS APPROVED, NOT ACCEPTED
0
$0
9
$137,657
34
$148,271
5
$172,488
2
$308,015
10
$81,111
APPLICATIONS DENIED
5
$105,752
21
$100,553
111
$141,428
36
$35,983
12
$94,829
15
$75,749
APPLICATIONS WITHDRAWN
0
$0
2
$121,495
67
$124,637
7
$89,471
2
$269,515
2
$51,335
FILES CLOSED FOR INCOMPLETENESS
2
$178,820
2
$130,050
17
$142,935
0
$0
0
$0
0
$0
Aggregated Statistics For Year 2006 (Based on 2 partial tracts)
A) FHA, FSA/RHS & VA Home Purchase Loans
B) Conventional Home Purchase Loans
C) Refinancings
D) Home Improvement Loans
F) Non-occupant Loans on < 5 Family Dwellings (A B C & D)
G) Loans On Manufactured Home Dwelling (A B C & D)
Number
Average Value
Number
Average Value
Number
Average Value
Number
Average Value
Number
Average Value
Number
Average Value
LOANS ORIGINATED
12
$124,775
101
$119,310
149
$120,048
22
$37,724
43
$89,977
26
$62,590
APPLICATIONS APPROVED, NOT ACCEPTED
0
$0
12
$125,202
33
$154,164
9
$50,386
2
$855,600
3
$63,883
APPLICATIONS DENIED
2
$295,180
39
$114,738
130
$126,181
29
$50,392
5
$341,556
21
$68,774
APPLICATIONS WITHDRAWN
5
$175,570
17
$143,539
68
$139,060
3
$78,717
3
$280,067
2
$61,605
FILES CLOSED FOR INCOMPLETENESS
0
$0
0
$0
27
$124,220
0
$0
0
$0
2
$71,870
Aggregated Statistics For Year 2005 (Based on 2 partial tracts)
A) FHA, FSA/RHS & VA Home Purchase Loans
B) Conventional Home Purchase Loans
C) Refinancings
D) Home Improvement Loans
F) Non-occupant Loans on < 5 Family Dwellings (A B C & D)
G) Loans On Manufactured Home Dwelling (A B C & D)
Number
Average Value
Number
Average Value
Number
Average Value
Number
Average Value
Number
Average Value
Number
Average Value
LOANS ORIGINATED
19
$131,042
51
$118,811
202
$134,804
24
$40,926
33
$100,131
17
$74,789
APPLICATIONS APPROVED, NOT ACCEPTED
2
$33,370
10
$58,523
36
$88,364
9
$22,626
5
$76,662
10
$42,609
APPLICATIONS DENIED
2
$35,935
34
$86,969
125
$130,448
33
$44,647
19
$115,641
41
$57,847
APPLICATIONS WITHDRAWN
0
$0
14
$147,652
72
$151,203
10
$62,801
3
$175,113
5
$57,838
FILES CLOSED FOR INCOMPLETENESS
0
$0
3
$62,743
29
$109,694
2
$42,780
5
$97,196
2
$42,780
Aggregated Statistics For Year 2004 (Based on 2 partial tracts)
A) FHA, FSA/RHS & VA Home Purchase Loans
B) Conventional Home Purchase Loans
C) Refinancings
D) Home Improvement Loans
F) Non-occupant Loans on < 5 Family Dwellings (A B C & D)
G) Loans On Manufactured Home Dwelling (A B C & D)
Number
Average Value
Number
Average Value
Number
Average Value
Number
Average Value
Number
Average Value
Number
Average Value
LOANS ORIGINATED
10
$84,533
91
$109,348
200
$119,450
46
$42,594
43
$83,968
24
$55,970
APPLICATIONS APPROVED, NOT ACCEPTED
3
$77,573
12
$113,367
41
$112,271
0
$0
2
$349,085
7
$95,583
APPLICATIONS DENIED
2
$103,530
21
$91,101
125
$115,527
26
$27,774
2
$59,890
15
$62,059
APPLICATIONS WITHDRAWN
9
$79,286
5
$121,496
65
$120,310
3
$21,103
2
$77,005
12
$83,992
FILES CLOSED FOR INCOMPLETENESS
0
$0
3
$173,973
22
$133,318
3
$22,817
0
$0
2
$88,980
Aggregated Statistics For Year 2003 (Based on 2 partial tracts)
A) FHA, FSA/RHS & VA Home Purchase Loans
B) Conventional Home Purchase Loans
C) Refinancings
D) Home Improvement Loans
F) Non-occupant Loans on < 5 Family Dwellings (A B C & D)
Number
Average Value
Number
Average Value
Number
Average Value
Number
Average Value
Number
Average Value
LOANS ORIGINATED
15
$91,949
94
$114,487
291
$106,994
50
$28,543
53
$86,432
APPLICATIONS APPROVED, NOT ACCEPTED
0
$0
15
$95,143
29
$93,231
5
$14,716
5
$85,218
APPLICATIONS DENIED
7
$92,649
24
$93,545
98
$99,284
22
$11,356
0
$0
APPLICATIONS WITHDRAWN
2
$53,045
12
$145,595
62
$130,686
2
$21,390
0
$0
FILES CLOSED FOR INCOMPLETENESS
0
$0
2
$213,045
7
$113,673
0
$0
0
$0
Aggregated Statistics For Year 2002 (Based on 2 partial tracts)
A) FHA, FSA/RHS & VA Home Purchase Loans
B) Conventional Home Purchase Loans
C) Refinancings
D) Home Improvement Loans
F) Non-occupant Loans on < 5 Family Dwellings (A B C & D)
Number
Average Value
Number
Average Value
Number
Average Value
Number
Average Value
Number
Average Value
LOANS ORIGINATED
22
$105,161
65
$85,270
248
$104,756
50
$15,127
38
$53,948
APPLICATIONS APPROVED, NOT ACCEPTED
2
$61,605
17
$67,441
41
$111,896
10
$21,390
5
$36,620
APPLICATIONS DENIED
5
$116,020
43
$57,067
106
$96,957
21
$12,875
3
$147,163
APPLICATIONS WITHDRAWN
2
$79,570
5
$79,400
38
$90,018
3
$22,247
2
$40,215
FILES CLOSED FOR INCOMPLETENESS
0
$0
0
$0
24
$95,898
0
$0
3
$129,480
Aggregated Statistics For Year 2001 (Based on 2 partial tracts)
A) FHA, FSA/RHS & VA Home Purchase Loans
B) Conventional Home Purchase Loans
C) Refinancings
D) Home Improvement Loans
F) Non-occupant Loans on < 5 Family Dwellings (A B C & D)
Number
Average Value
Number
Average Value
Number
Average Value
Number
Average Value
Number
Average Value
LOANS ORIGINATED
12
$85,132
60
$102,130
209
$94,648
46
$12,871
26
$97,407
APPLICATIONS APPROVED, NOT ACCEPTED
0
$0
15
$46,317
33
$80,686
2
$4,280
0
$0
APPLICATIONS DENIED
5
$79,742
53
$81,234
82
$83,890
15
$18,025
5
$78,372
APPLICATIONS WITHDRAWN
3
$117,503
5
$104,726
50
$76,183
9
$21,104
2
$90,695
FILES CLOSED FOR INCOMPLETENESS
2
$74,435
0
$0
7
$102,183
2
$85,560
0
$0
Aggregated Statistics For Year 2000 (Based on 2 partial tracts)
A) FHA, FSA/RHS & VA Home Purchase Loans
B) Conventional Home Purchase Loans
C) Refinancings
D) Home Improvement Loans
F) Non-occupant Loans on < 5 Family Dwellings (A B C & D)
Number
Average Value
Number
Average Value
Number
Average Value
Number
Average Value
Number
Average Value
LOANS ORIGINATED
15
$78,487
80
$71,378
86
$92,007
27
$11,091
26
$88,785
APPLICATIONS APPROVED, NOT ACCEPTED
2
$29,945
15
$40,727
12
$46,915
7
$25,913
2
$43,635
APPLICATIONS DENIED
3
$106,093
68
$50,807
51
$65,294
14
$8,311
3
$23,957
APPLICATIONS WITHDRAWN
0
$0
15
$81,111
43
$81,978
2
$2,565
0
$0
FILES CLOSED FOR INCOMPLETENESS
0
$0
0
$0
27
$66,230
2
$31,655
0
$0
Aggregated Statistics For Year 1999 (Based on 1 partial tract)
A) FHA, FSA/RHS & VA Home Purchase Loans
B) Conventional Home Purchase Loans
C) Refinancings
D) Home Improvement Loans
F) Non-occupant Loans on < 5 Family Dwellings (A B C & D)
Detailed PMIC statistics for the following Tracts:9908.00
2003 - 2018 National Fire Incident Reporting System (NFIRS) incidents
According to the data from the years 2003 - 2018 the average number of fire incidents per year is 30. The highest number of reported fires - 63 took place in 2016, and the least - 4 in 2005. The data has a decreasing trend.
When looking into fire subcategories, the most incidents belonged to: Outside Fires (54.1%), and Structure Fires (27.9%).
Fire incident types reported to NFIRS in Zip Code 30185


 Nearest zip codes: 30116, 30275, 30263, 30187, 30118, 30268.


 According to the data from the years 2003 - 2018 the average number of fire incidents per year is 30. The highest number of reported fires - 63 took place in 2016, and the least - 4 in 2005. The data has a decreasing trend.
 When looking into fire subcategories, the most incidents belonged to: Outside Fires (54.1%), and Structure Fires (27.9%).