Notable locations in zip code 30602: Waddel Hall (A), Tucker Hall (B), Terrell Hall (C), Stegeman Hall (D), Soule Hall (E), Snelling Hall (F), Rutherford Hall (G), Reed Hall (H), Peabody Hall (I), Payne Hall (J), Park Hall (K), Myers Hall (L), Moore College (M), Milledge Hall (N), Memorial Hall (O), Meigs Hall (P), Mary Lyndon Hall (Q), LeConte Hall (R), Joseph E Brown Hall (S), Hoke Smith Annex (T). Display/hide their locations on the map
Tourist attraction (not listed on the city page) : Georgia Museum of Art (90 Carlton Street).
Median price asked for vacant for-sale houses and condos in 2022: $700,136.
Mean price in 2022:
Detached houses: $381,281
Here:
$381,281
State:
$376,364
Townhouses or other attached units: $261,977
Here:
$261,977
State:
$341,709
In 2-unit structures: $91,464
Here:
$91,464
State:
$269,631
In 3-to-4-unit structures: $94,411
Here:
$94,411
State:
$250,092
In 5-or-more-unit structures: $402,277
Here:
$402,277
State:
$370,730
Mobile homes: $413,720
Here:
$413,720
State:
$102,413
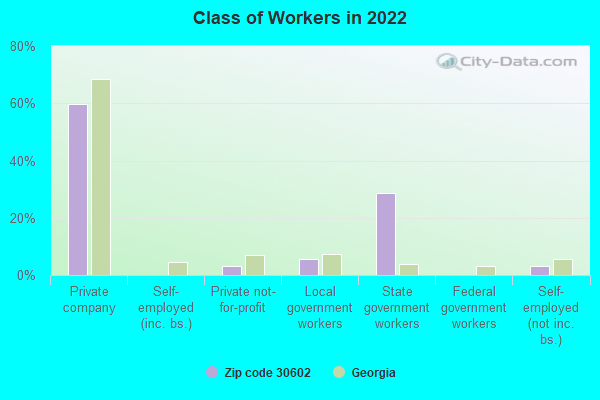
Unemployment: 18.0%
Means of transportation to work in zip code 30602
45.4%191Drove a car alone
12.4%52Bus or trolley bus
19.5%82Walked
20.2%85Worked at home
Travel time to work (commute) in zip code 30602
11Less than 5 minutes
715 to 9 minutes
5110 to 14 minutes
11015 to 19 minutes
5920 to 24 minutes
1125 to 29 minutes
1130 to 34 minutes
1040 to 44 minutes
Percentage of zip code residents living and working in this county: 74.5%
Household type by relationship:
In group quarters: 1,420 (0 institutionalized population)
71.5% of residents of 30602 zip code speak English at home.
7.5% of residents speak Spanish at home (92% very well, 8% well).
6.6% of residents speak other Indo-European language at home (93% very well, 7% not well).
12.1% of residents speak Asian or Pacific Island language at home (100% very well).
2.7% of residents speak other language at home (100% very well).
Foreign born population: 167 (11.5%) (70.8% of them are naturalized citizens)
This zip code:
11.5%
Whole state:
10.7%
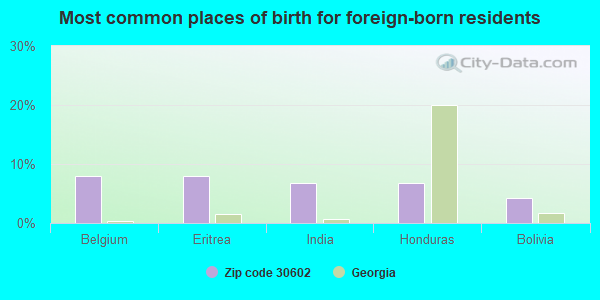
8%Belgium
8%Eritrea
7%India
7%Honduras
4%Bolivia
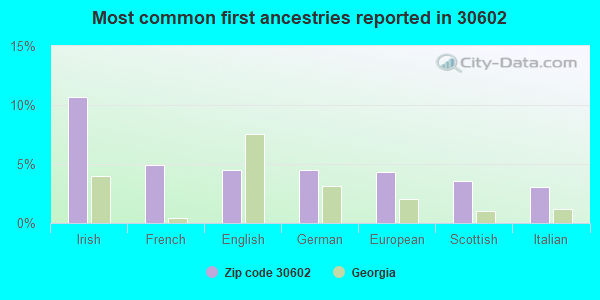
11%Irish
5%French
4%English
4%German
4%European
4%Scottish
3%Italian
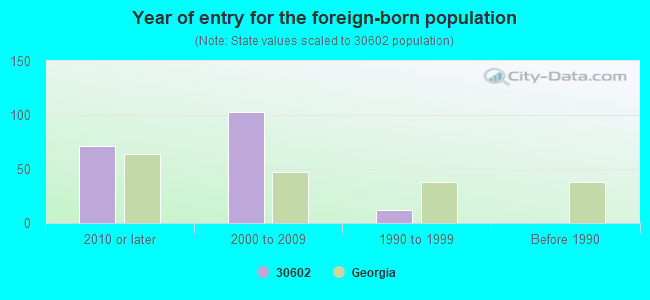
Year of entry for the foreign-born population
712010 or later
1032000 to 2009
121990 to 1999
0Before 1990
Facilities with environmental interests located in this zip code:
UGA HAZARDOUS WASTE DISPOSAL FAC (1 MI S WILL HUNTER RD in ATHENS, GA)
AIR MINOR (AIRS/AFS) STATE MASTER (Georgia's Geographic Environmental Information) - UST-2, UNDERGROUND STORAGE TANK PROGRAM, UST-1, HAZARDOUS WASTE BIENNIAL REPORTER (Resource Conservation and Recovery Act (tracking hazardous waste)) Large Quantity Generators, more that 1000 kg of hazardous waste/month (Resource Conservation and Recovery Act (tracking hazardous waste)) TRANSPORTER (Resource Conservation and Recovery Act (tracking hazardous waste)) - notification TSD (Resource Conservation and Recovery Act (tracking hazardous waste)) - notification USED OIL PROGRAM (Resource Conservation and Recovery Act (tracking hazardous waste)) Business SIC classification: COLLEGES, UNIVERSITIES, AND PROFESSIONAL SCHOOLS Business NAICS classification: HAZARDOUS WASTE TREATMENT AND DISPOSAL. Organizations: UNIVERSITY OF GEORGIA PHYSICAL P (CONTACT/OPERATOR)
, UNIVERSITY OF GEORGIA (CONTACT/OPERATOR)
, BOARD OF REGENTS UNIVERSITY SYST (CONTACT/OWNER)
, WATKINS OMEGA (INSTALLER)
Alternative names: UNIVERSITY OF GEORGIA, UNIVERSITY OF GEORGIA HAZ MAT STA, UNIVERSITY OF GEORGIA HMTF
THE UNIVERSITY OF GEORGIA (240A RIVERBEND ROAD in ATHENS, GA)
HAZARDOUS WASTE BIENNIAL REPORTER (Resource Conservation and Recovery Act (tracking hazardous waste)) - ICIS-, ENFORCEMENT/COMPLIANCE ACTIVITY Large Quantity Generators, more that 1000 kg of hazardous waste/month (Resource Conservation and Recovery Act (tracking hazardous waste)) - notification - ICIS-, ENFORCEMENT/COMPLIANCE ACTIVITY Organizations: UNIVERSITY SYSTEM OF GEORGIA (CONTACT/OWNER)
UNIVERSITY OF GEORGIA VETERINARY MED (CARLTON & E CAMPUS DR in ATHENS, GA)
AIR MAJOR (AIRS/AFS) STATE MASTER (Georgia's Geographic Environmental Information) - UST-1, UNDERGROUND STORAGE TANK PROGRAM, UST-2, Business SIC classification: COLLEGES, UNIVERSITIES, AND PROFESSIONAL SCHOOLS Organizations: UNIVERSITY OF GEORGIA PHYSICAL P (CONTACT/OPERATOR)
, BOARD OF REGENTS UNIVERSITY SYST (CONTACT/OWNER)
, WATKINS OMEGA (INSTALLER)
Alternative names: UNIVERSTIY OF GEORGIA
DEPT OF BIOLOGICAL & (AGRICULTURAL ENGINEERING in ATHENS, GA)
National Pollutant Discharge Elimination System NON-MAJOR (Tracking pollutant discharge elimination systems) - permit Business SIC classification: SEWERAGE SYSTEMS Organizations: (CLARKE CO) (CONTACT/OPERATOR)
, UGA- DEPT OF BIO & AGRICULTRAL (CONTACT/OWNER)
Alternative names: ENVIRONMENTAL SAFTEY DIV, UNIVERSITY OF GA.(COMPOST FAC)
UNIVERSITY OF GEORGIA CENTRAL STEAM PLAN (CHICIPEE COMPLEX,HERTY DR. in ATHENS, GA)
AIR MAJOR (AIRS/AFS) CRITERIA AND HAZARDOUS AIR POLLUTANT INVENTORY (Inventory of air pollution sources) Business SIC classification: COLLEGES, UNIVERSITIES, AND PROFESSIONAL SCHOOLS Alternative names: UNIVERSITY OF GEORGIA STEAM PLANT
FORESTRY SCIENCE LABORATORY (320 GREEN STREET in ATHENS, GA) . Federal Facility. DEPARTMENT OF AGRICULTURE
Conditionally Exempt Small Quantity Generators, less than 100 kg/month of hazardous waste (Resource Conservation and Recovery Act (tracking hazardous waste)) - notification Organizations: SOUTHEASTERN FOREST EXP STATION (CONTACT/OWNER)
UNIVERSITY OF GEORGIA (2300 COLLEGE STATION in ATHENS, GA)
AIR MAJOR (AIRS/AFS) Business SIC classification: COLLEGES, UNIVERSITIES, AND PROFESSIONAL SCHOOLS Alternative names: UNIVERSITY OF GEORGIA AVIAN MEDICINE
UNIVERSITY OF GEORGIA (310 OLD COLLEGE in ATHENS, GA)
COMPLIANCE ACTIVITY (Tracking inspections of insecticide, fungicide, and rodenticide, and toxic substances) Business SIC classification: COLLEGES, UNIVERSITIES, AND PROFESSIONAL SCHOOLS
Place of birth for U.S.-born residents:
This state: 941
Northeast: 91
Midwest: 71
South: 113
West: 52
10% of the 30602 zip code residents lived in the same house 5 years ago. Out of people who lived in different houses, 0% lived in this county. Out of people who lived in different counties, 50% lived in Georgia.
28% of the 30602 zip code residents lived in the same house 1 year ago. Out of people who lived in different houses, 108% moved from different state.
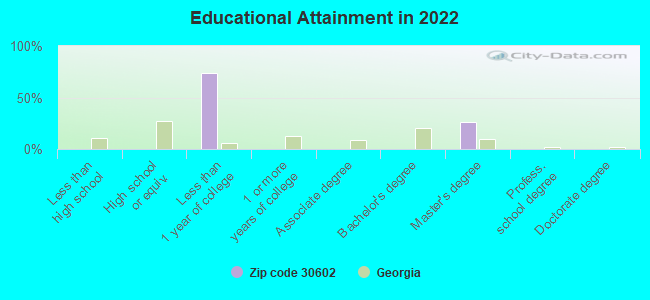
Students in private undergraduate colleges: 27
Here:
1.9%
Georgia:
17.1%
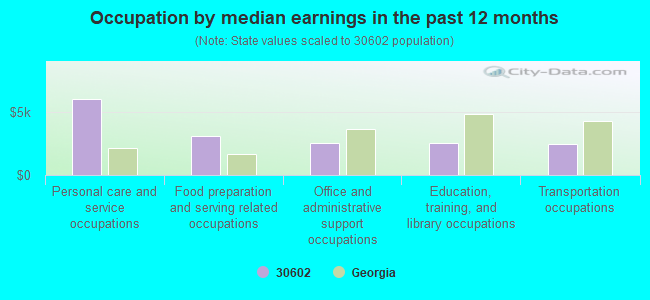
Occupation by median earnings in the past 12 months ($)
5,988Personal care and service occupations
3,051Food preparation and serving related occupations
2,497Office and administrative support occupations
2,495Education, training, and library occupations
2,465Transportation occupations
Companies with federal contracts located in this zip code (ATHENS, GA):
UNIVERSITY OF GEORGIA RESEARCH (621-630 GRADUATE STUDIES) : $10,141,054 in 113 contractsfrom 1999 to 2006
Contracts for Health Services -- Applied Research and Exploratory Development (R&D), Aeronautics and Space Technology -- Applied Research and Exploratory Development (R&D), Other Sciences Not Elsewhere Classified -- Engineering Development (R&D), Environmental Studies and Assessments, and moreby Centers for Disease Control and Prevention, NASA, Food and Drug Administration, EPA, and others Signed by year:2000: $990,723; 2001: $1,315,824; 2002: $1,937,051; 2003: $1,141,293; 2004: $1,959,378; 2005: $1,771,845; 2006: $774,940.
Biggest contracts:
$1,051,000 with Centers for Disease Control and Prevention for Health Services -- Applied Research and Exploratory Development (R&D). Signed on 2002-05-15. Completion date: 2004-12-15.
$858,559 with NASA for Aeronautics and Space Technology -- Applied Research and Exploratory Development (R&D). Signed on 2001-11-08. Completion date: 2005-06-30.
$820,499 with Food and Drug Administration for Other Sciences Not Elsewhere Classified -- Engineering Development (R&D). Taking place in IL. Signed on 2005-09-23. Completion date: 2006-09-29.
$616,513 with Centers for Disease Control and Prevention for Health Services -- Applied Research and Exploratory Development (R&D). Signed on 2003-06-15. Completion date: 2007-09-15.
UNIVERSITY OF GEORGIA (COLLETE OF VETERNINARY MEDICINE) : $2,883,840 in 7 contractsfrom 2000 to 2006
Contracts for Biomedical -- Basic Research (R&D), Physical Sciences -- Applied Research and Exploratory Development (R&D) by National Institutes of Health Signed by year:2000: $244,000; 2001: $515,000; 2002: $0; 2003: $409,390; 2004: $409,980; 2005: $422,240; 2006: $883,230.
Biggest contracts:
$515,000 with National Institutes of Health for Biomedical -- Basic Research (R&D). Signed on 2001-03-15. Completion date: 2003-03-15.
$448,242 with National Institutes of Health for Physical Sciences -- Applied Research and Exploratory Development (R&D). Signed on 2006-09-21. Completion date: 2010-05-14.
$434,988, same as above.Signed on 2006-06-30. Completion date: 2010-05-14.
$422,240, same as above.Signed on 2005-06-29. Completion date: 2010-05-14.
UNIVERSITY OF GEORGIA (621 BOYD GRADUATE RESEARCH CENTER) : $392,865 in 8 contractsfrom 1999 to 2004
Contracts for Live Animals, Not Raised for Food by National Institutes of Health Signed by year:2000: $96,000; 2001: $17,000; 2002: $108,000; 2003: $0; 2004: $124,865; 2005: $0; 2006: $0.
Biggest contracts:
$124,865 with National Institutes of Health for Live Animals, Not Raised for Food. Signed on 2004-09-30. Completion date: 2004-09-30.
$83,000, same as above.Signed on 2002-01-15. Completion date: 2002-07-15.
$80,000 with National Institutes of Health for Live Animals, Not Raised for Food. Taking place in MD. Signed on 2000-12-15. Completion date: 2001-07-15.
$47,000, same as above.Signed on 1999-12-15. Completion date: 2000-07-15.
THE UGA RESEARCH FOUNDATION (617 BOYD GRAD STUDIES)
$67,200 with Forest Service for Recreation Studies. Signed on 2002-09-15. Completion date: 2003-09-15.
Top industries in this zip code by the number of employees in 2005:
Other Services (except Public Administration): Other Similar Organizations (except Business, Professional, Labor, and Political Organizations) (250-499 employees: 1 establishment)
Administrative and Support and Waste Management and Remediation Services: Janitorial Services (20-49: 1)
Professional, Scientific, and Technical Services: Veterinary Services (20-49: 1)
Health Care and Social Assistance: Other Individual and Family Services (10-19: 1)
Professional, Scientific, and Technical Services: Research and Development in the Physical, Engineering, and Life Sciences (5-9: 1, 1-4: 3)
Other Services (except Public Administration): Civic and Social Organizations (5-9: 1, 1-4: 1)
Other Services (except Public Administration): Business Associations (1-4: 2)
Professional, Scientific, and Technical Services: Environmental Consulting Services (1-4: 1)
Other Services (except Public Administration): Professional Organizations (1-4: 1)
Arts, Entertainment, and Recreation: Musical Groups and Artists (1-4: 1)
People in group quarters in 2010:
2,407 people in college/university student housing
People in group quarters in 2000:
1,359 people in college dormitories (includes college quarters off campus)
Home Mortgage Disclosure Act Aggregated Statistics For Year 2009 (Based on 2 partial tracts)
C) Refinancings
D) Home Improvement Loans
F) Non-occupant Loans on < 5 Family Dwellings (A B C & D)
Number
Average Value
Number
Average Value
Number
Average Value
LOANS ORIGINATED
1
$60,540
0
$0
2
$51,505
APPLICATIONS APPROVED, NOT ACCEPTED
0
$0
0
$0
0
$0
APPLICATIONS DENIED
0
$0
1
$62,980
0
$0
APPLICATIONS WITHDRAWN
1
$124,000
0
$0
0
$0
FILES CLOSED FOR INCOMPLETENESS
0
$0
0
$0
0
$0
Aggregated Statistics For Year 2008 (Based on 2 partial tracts)
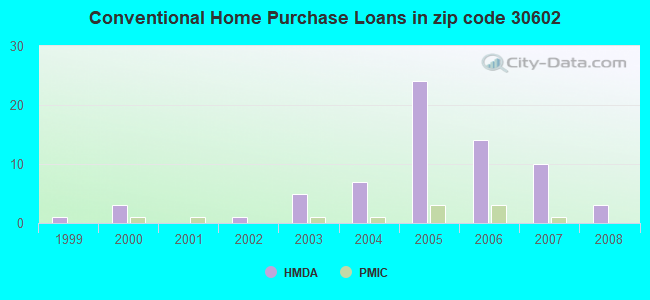
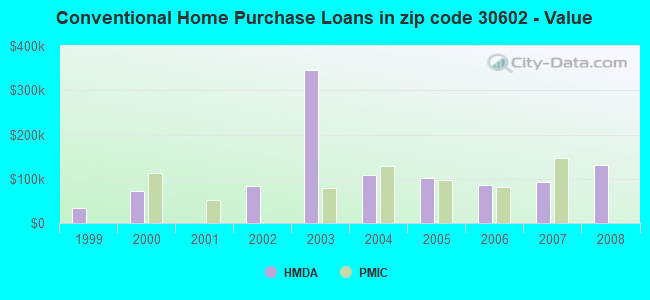
B) Conventional Home Purchase Loans
C) Refinancings
F) Non-occupant Loans on < 5 Family Dwellings (A B C & D)
Number
Average Value
Number
Average Value
Number
Average Value
LOANS ORIGINATED
3
$131,327
5
$110,040
8
$113,324
APPLICATIONS APPROVED, NOT ACCEPTED
0
$0
0
$0
1
$71,280
APPLICATIONS DENIED
0
$0
1
$102,030
1
$77,620
APPLICATIONS WITHDRAWN
0
$0
0
$0
0
$0
FILES CLOSED FOR INCOMPLETENESS
0
$0
0
$0
0
$0
Aggregated Statistics For Year 2007 (Based on 2 partial tracts)
B) Conventional Home Purchase Loans
C) Refinancings
D) Home Improvement Loans
F) Non-occupant Loans on < 5 Family Dwellings (A B C & D)
Number
Average Value
Number
Average Value
Number
Average Value
Number
Average Value
LOANS ORIGINATED
10
$92,270
2
$98,130
1
$9,760
10
$93,490
APPLICATIONS APPROVED, NOT ACCEPTED
0
$0
0
$0
0
$0
0
$0
APPLICATIONS DENIED
2
$370,790
0
$0
0
$0
2
$355,655
APPLICATIONS WITHDRAWN
2
$144,995
0
$0
0
$0
1
$250,930
FILES CLOSED FOR INCOMPLETENESS
0
$0
0
$0
0
$0
0
$0
Aggregated Statistics For Year 2006 (Based on 2 partial tracts)
B) Conventional Home Purchase Loans
C) Refinancings
D) Home Improvement Loans
E) Loans on Dwellings For 5+ Families
F) Non-occupant Loans on < 5 Family Dwellings (A B C & D)
Number
Average Value
Number
Average Value
Number
Average Value
Number
Average Value
Number
Average Value
LOANS ORIGINATED
14
$86,830
5
$1,107,726
1
$44,430
1
$192,840
14
$452,701
APPLICATIONS APPROVED, NOT ACCEPTED
0
$0
0
$0
0
$0
0
$0
0
$0
APPLICATIONS DENIED
2
$91,295
0
$0
0
$0
0
$0
2
$50,285
APPLICATIONS WITHDRAWN
0
$0
0
$0
0
$0
0
$0
0
$0
FILES CLOSED FOR INCOMPLETENESS
0
$0
0
$0
0
$0
0
$0
0
$0
Aggregated Statistics For Year 2005 (Based on 2 partial tracts)
B) Conventional Home Purchase Loans
C) Refinancings
F) Non-occupant Loans on < 5 Family Dwellings (A B C & D)
Number
Average Value
Number
Average Value
Number
Average Value
LOANS ORIGINATED
24
$101,566
4
$111,552
17
$109,673
APPLICATIONS APPROVED, NOT ACCEPTED
2
$93,000
0
$0
2
$105,450
APPLICATIONS DENIED
4
$86,655
1
$110,820
3
$102,197
APPLICATIONS WITHDRAWN
2
$93,980
0
$0
1
$212,860
FILES CLOSED FOR INCOMPLETENESS
0
$0
0
$0
0
$0
Aggregated Statistics For Year 2004 (Based on 2 partial tracts)
B) Conventional Home Purchase Loans
C) Refinancings
F) Non-occupant Loans on < 5 Family Dwellings (A B C & D)
Number
Average Value
Number
Average Value
Number
Average Value
LOANS ORIGINATED
7
$108,869
1
$98,130
6
$122,213
APPLICATIONS APPROVED, NOT ACCEPTED
0
$0
0
$0
0
$0
APPLICATIONS DENIED
1
$158,180
0
$0
0
$0
APPLICATIONS WITHDRAWN
1
$99,590
1
$73,230
1
$99,590
FILES CLOSED FOR INCOMPLETENESS
0
$0
0
$0
0
$0
Aggregated Statistics For Year 2003 (Based on 2 partial tracts)
A) FHA, FSA/RHS & VA Home Purchase Loans
B) Conventional Home Purchase Loans
C) Refinancings
F) Non-occupant Loans on < 5 Family Dwellings (A B C & D)
Number
Average Value
Number
Average Value
Number
Average Value
Number
Average Value
LOANS ORIGINATED
1
$103,010
5
$346,036
4
$87,632
6
$290,723
APPLICATIONS APPROVED, NOT ACCEPTED
0
$0
0
$0
0
$0
0
$0
APPLICATIONS DENIED
0
$0
1
$47,360
0
$0
0
$0
APPLICATIONS WITHDRAWN
0
$0
0
$0
0
$0
0
$0
FILES CLOSED FOR INCOMPLETENESS
0
$0
0
$0
0
$0
0
$0
Aggregated Statistics For Year 2002 (Based on 2 partial tracts)
B) Conventional Home Purchase Loans
C) Refinancings
Number
Average Value
Number
Average Value
LOANS ORIGINATED
1
$82,990
1
$162,570
APPLICATIONS APPROVED, NOT ACCEPTED
0
$0
0
$0
APPLICATIONS DENIED
0
$0
0
$0
APPLICATIONS WITHDRAWN
0
$0
0
$0
FILES CLOSED FOR INCOMPLETENESS
0
$0
0
$0
Aggregated Statistics For Year 2001 (Based on 2 partial tracts)
C) Refinancings
D) Home Improvement Loans
F) Non-occupant Loans on < 5 Family Dwellings (A B C & D)
Number
Average Value
Number
Average Value
Number
Average Value
LOANS ORIGINATED
1
$122,050
1
$7,320
1
$137,670
APPLICATIONS APPROVED, NOT ACCEPTED
0
$0
0
$0
0
$0
APPLICATIONS DENIED
0
$0
0
$0
0
$0
APPLICATIONS WITHDRAWN
0
$0
0
$0
0
$0
FILES CLOSED FOR INCOMPLETENESS
0
$0
0
$0
0
$0
Aggregated Statistics For Year 2000 (Based on 2 partial tracts)
B) Conventional Home Purchase Loans
C) Refinancings
F) Non-occupant Loans on < 5 Family Dwellings (A B C & D)
Number
Average Value
Number
Average Value
Number
Average Value
LOANS ORIGINATED
3
$71,277
1
$29,290
3
$75,020
APPLICATIONS APPROVED, NOT ACCEPTED
0
$0
0
$0
0
$0
APPLICATIONS DENIED
0
$0
0
$0
0
$0
APPLICATIONS WITHDRAWN
0
$0
0
$0
0
$0
FILES CLOSED FOR INCOMPLETENESS
0
$0
0
$0
0
$0
Aggregated Statistics For Year 1999 (Based on 1 partial tract)
B) Conventional Home Purchase Loans
C) Refinancings
D) Home Improvement Loans
F) Non-occupant Loans on < 5 Family Dwellings (A B C & D)
Detailed PMIC statistics for the following Tracts:0004.00
2002 - 2018 National Fire Incident Reporting System (NFIRS) incidents
According to the data from the years 2002 - 2018 the average number of fire incidents per year is 13. The highest number of reported fire incidents - 33 took place in 2005, and the least - 0 in 2014. The data has a rising trend.
When looking into fire subcategories, the most reports belonged to: Outside Fires (57.2%), and Structure Fires (24.8%).
Fire incident types reported to NFIRS in Zip Code 30602
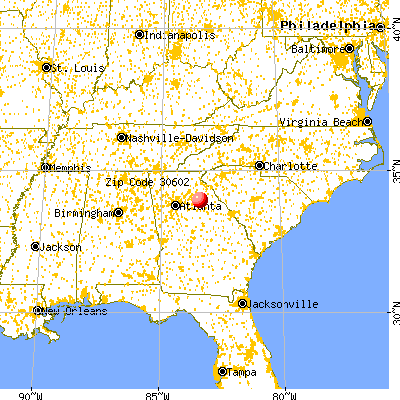


 Nearest zip codes: 30609, 30606, 30605, 30601, 30607, 30683.


 According to the data from the years 2002 - 2018 the average number of fire incidents per year is 13. The highest number of reported fire incidents - 33 took place in 2005, and the least - 0 in 2014. The data has a rising trend.
 When looking into fire subcategories, the most reports belonged to: Outside Fires (57.2%), and Structure Fires (24.8%).