Estimated zip code population in 2022: 18,128
Zip code population in 2010: 15,133
Zip code population in 2000: 10,578
Houses and condos: 6,323
Renter-occupied apartments: 1,077
% of renters here:
17%State:
34%
March 2022 cost of living index in zip code 30656: 90.3
(less than average, U.S. average is 100)
Land area: 69.8
sq. mi.
Water area: 0.8
sq. mi.
Population density: 260 people per square mile (very low).
OSM Map
General Map
Google Map
MSN Map
OSM Map
General Map
Google Map
MSN Map
OSM Map
General Map
Google Map
MSN Map
OSM Map
General Map
Google Map
MSN Map
Please wait while loading the map...
Real estate property taxes paid for housing units in 2022:
This zip code:
0.7% ($2,460)Georgia:
0.7% ($2,160)
Median real estate property taxes paid for housing units with mortgages in 2022: $2,682 (0.7%)
Median real estate property taxes paid for housing units with no mortgage in 2022: $1,352 (0.5%)
Profiles of local businesses
Business Search - 14 Million verified businesses
Males: 9,174 Females: 8,951
For population 25 years and over in 30656:
High school or higher: 88.9%Bachelor's degree or higher: 28.5%Graduate or professional degree: 10.9%Unemployed: 5.5%Mean travel time to work (commute): 32.8 minutes
For population 15 years and over in 30656:
Never married: 26.1%Now married: 59.4%Separated: 1.3%Widowed: 4.9%Divorced: 8.3%
Zip code 30656 compared to state average:
Black race population percentage below state average. Hispanic race population percentage below state average. Median age above state average. Foreign-born population percentage significantly below state average. Renting percentage below state average. Length of stay since moving in significantly above state average. House age below state average. 13,782 76.0% White 3,014 16.6% Black 953 5.3% Hispanic or Latino 273 1.5% Two or more races 65 0.4% Asian 21 0.1% Native Hawaiian and Other 17 0.09% Some other race
Data:
Median household income ($)
Median household income (% change since 2000)
Household income diversity
Ratio of average income to average house value (%)
Ratio of average income to average rent
Median household income ($) - White
Median household income ($) - Black or African American
Median household income ($) - Asian
Median household income ($) - Hispanic or Latino
Median household income ($) - American Indian and Alaska Native
Median household income ($) - Multirace
Median household income ($) - Other Race
Median household income for houses/condos with a mortgage ($)
Median household income for apartments without a mortgage ($)
Races - White alone (%)
Races - White alone (% change since 2000)
Races - Black alone (%)
Races - Black alone (% change since 2000)
Races - American Indian alone (%)
Races - American Indian alone (% change since 2000)
Races - Asian alone (%)
Races - Asian alone (% change since 2000)
Races - Hispanic (%)
Races - Hispanic (% change since 2000)
Races - Native Hawaiian and Other Pacific Islander alone (%)
Races - Native Hawaiian and Other Pacific Islander alone (% change since 2000)
Races - Two or more races (%)
Races - Two or more races (% change since 2000)
Races - Other race alone (%)
Races - Other race alone (% change since 2000)
Racial diversity
Unemployment (%)
Unemployment (% change since 2000)
Unemployment (%) - White
Unemployment (%) - Black or African American
Unemployment (%) - Asian
Unemployment (%) - Hispanic or Latino
Unemployment (%) - American Indian and Alaska Native
Unemployment (%) - Multirace
Unemployment (%) - Other Race
Population density (people per square mile)
Population - Males (%)
Population - Females (%)
Population - Males (%) - White
Population - Males (%) - Black or African American
Population - Males (%) - Asian
Population - Males (%) - Hispanic or Latino
Population - Males (%) - American Indian and Alaska Native
Population - Males (%) - Multirace
Population - Males (%) - Other Race
Population - Females (%) - White
Population - Females (%) - Black or African American
Population - Females (%) - Asian
Population - Females (%) - Hispanic or Latino
Population - Females (%) - American Indian and Alaska Native
Population - Females (%) - Multirace
Population - Females (%) - Other Race
Coronavirus confirmed cases (Apr 25, 2024)
Deaths caused by coronavirus (Apr 25, 2024)
Coronavirus confirmed cases (per 100k population) (Apr 25, 2024)
Deaths caused by coronavirus (per 100k population) (Apr 25, 2024)
Daily increase in number of cases (Apr 25, 2024)
Weekly increase in number of cases (Apr 25, 2024)
Cases doubled (in days) (Apr 25, 2024)
Hospitalized patients (Apr 18, 2022)
Negative test results (Apr 18, 2022)
Total test results (Apr 18, 2022)
COVID Vaccine doses distributed (per 100k population) (Sep 19, 2023)
COVID Vaccine doses administered (per 100k population) (Sep 19, 2023)
COVID Vaccine doses distributed (Sep 19, 2023)
COVID Vaccine doses administered (Sep 19, 2023)
Likely homosexual households (%)
Likely homosexual households (% change since 2000)
Likely homosexual households - Lesbian couples (%)
Likely homosexual households - Lesbian couples (% change since 2000)
Likely homosexual households - Gay men (%)
Likely homosexual households - Gay men (% change since 2000)
Cost of living index
Median gross rent ($)
Median contract rent ($)
Median monthly housing costs ($)
Median house or condo value ($)
Median house or condo value ($ change since 2000)
Mean house or condo value by units in structure - 1, detached ($)
Mean house or condo value by units in structure - 1, attached ($)
Mean house or condo value by units in structure - 2 ($)
Mean house or condo value by units in structure by units in structure - 3 or 4 ($)
Mean house or condo value by units in structure - 5 or more ($)
Mean house or condo value by units in structure - Boat, RV, van, etc. ($)
Mean house or condo value by units in structure - Mobile home ($)
Median house or condo value ($) - White
Median house or condo value ($) - Black or African American
Median house or condo value ($) - Asian
Median house or condo value ($) - Hispanic or Latino
Median house or condo value ($) - American Indian and Alaska Native
Median house or condo value ($) - Multirace
Median house or condo value ($) - Other Race
Median resident age
Resident age diversity
Median resident age - Males
Median resident age - Females
Median resident age - White
Median resident age - Black or African American
Median resident age - Asian
Median resident age - Hispanic or Latino
Median resident age - American Indian and Alaska Native
Median resident age - Multirace
Median resident age - Other Race
Median resident age - Males - White
Median resident age - Males - Black or African American
Median resident age - Males - Asian
Median resident age - Males - Hispanic or Latino
Median resident age - Males - American Indian and Alaska Native
Median resident age - Males - Multirace
Median resident age - Males - Other Race
Median resident age - Females - White
Median resident age - Females - Black or African American
Median resident age - Females - Asian
Median resident age - Females - Hispanic or Latino
Median resident age - Females - American Indian and Alaska Native
Median resident age - Females - Multirace
Median resident age - Females - Other Race
Commute - mean travel time to work (minutes)
Travel time to work - Less than 5 minutes (%)
Travel time to work - Less than 5 minutes (% change since 2000)
Travel time to work - 5 to 9 minutes (%)
Travel time to work - 5 to 9 minutes (% change since 2000)
Travel time to work - 10 to 19 minutes (%)
Travel time to work - 10 to 19 minutes (% change since 2000)
Travel time to work - 20 to 29 minutes (%)
Travel time to work - 20 to 29 minutes (% change since 2000)
Travel time to work - 30 to 39 minutes (%)
Travel time to work - 30 to 39 minutes (% change since 2000)
Travel time to work - 40 to 59 minutes (%)
Travel time to work - 40 to 59 minutes (% change since 2000)
Travel time to work - 60 to 89 minutes (%)
Travel time to work - 60 to 89 minutes (% change since 2000)
Travel time to work - 90 or more minutes (%)
Travel time to work - 90 or more minutes (% change since 2000)
Marital status - Never married (%)
Marital status - Now married (%)
Marital status - Separated (%)
Marital status - Widowed (%)
Marital status - Divorced (%)
Median family income ($)
Median family income (% change since 2000)
Median non-family income ($)
Median non-family income (% change since 2000)
Median per capita income ($)
Median per capita income (% change since 2000)
Median family income ($) - White
Median family income ($) - Black or African American
Median family income ($) - Asian
Median family income ($) - Hispanic or Latino
Median family income ($) - American Indian and Alaska Native
Median family income ($) - Multirace
Median family income ($) - Other Race
Median year house/condo built
Median year apartment built
Year house built - Built 2005 or later (%)
Year house built - Built 2000 to 2004 (%)
Year house built - Built 1990 to 1999 (%)
Year house built - Built 1980 to 1989 (%)
Year house built - Built 1970 to 1979 (%)
Year house built - Built 1960 to 1969 (%)
Year house built - Built 1950 to 1959 (%)
Year house built - Built 1940 to 1949 (%)
Year house built - Built 1939 or earlier (%)
Average household size
Household density (households per square mile)
Average household size - White
Average household size - Black or African American
Average household size - Asian
Average household size - Hispanic or Latino
Average household size - American Indian and Alaska Native
Average household size - Multirace
Average household size - Other Race
Occupied housing units (%)
Vacant housing units (%)
Owner occupied housing units (%)
Renter occupied housing units (%)
Vacancy status - For rent (%)
Vacancy status - For sale only (%)
Vacancy status - Rented or sold, not occupied (%)
Vacancy status - For seasonal, recreational, or occasional use (%)
Vacancy status - For migrant workers (%)
Vacancy status - Other vacant (%)
Residents with income below the poverty level (%)
Residents with income below 50% of the poverty level (%)
Children below poverty level (%)
Poor families by family type - Married-couple family (%)
Poor families by family type - Male, no wife present (%)
Poor families by family type - Female, no husband present (%)
Poverty status for native-born residents (%)
Poverty status for foreign-born residents (%)
Poverty among high school graduates not in families (%)
Poverty among people who did not graduate high school not in families (%)
Residents with income below the poverty level (%) - White
Residents with income below the poverty level (%) - Black or African American
Residents with income below the poverty level (%) - Asian
Residents with income below the poverty level (%) - Hispanic or Latino
Residents with income below the poverty level (%) - American Indian and Alaska Native
Residents with income below the poverty level (%) - Multirace
Residents with income below the poverty level (%) - Other Race
Air pollution - Air Quality Index (AQI)
Air pollution - CO
Air pollution - NO2
Air pollution - SO2
Air pollution - Ozone
Air pollution - PM10
Air pollution - PM25
Air pollution - Pb
Crime - Murders per 100,000 population
Crime - Rapes per 100,000 population
Crime - Robberies per 100,000 population
Crime - Assaults per 100,000 population
Crime - Burglaries per 100,000 population
Crime - Thefts per 100,000 population
Crime - Auto thefts per 100,000 population
Crime - Arson per 100,000 population
Crime - City-data.com crime index
Crime - Violent crime index
Crime - Property crime index
Crime - Murders per 100,000 population (5 year average)
Crime - Rapes per 100,000 population (5 year average)
Crime - Robberies per 100,000 population (5 year average)
Crime - Assaults per 100,000 population (5 year average)
Crime - Burglaries per 100,000 population (5 year average)
Crime - Thefts per 100,000 population (5 year average)
Crime - Auto thefts per 100,000 population (5 year average)
Crime - Arson per 100,000 population (5 year average)
Crime - City-data.com crime index (5 year average)
Crime - Violent crime index (5 year average)
Crime - Property crime index (5 year average)
1996 Presidential Elections Results (%) - Democratic Party (Clinton)
1996 Presidential Elections Results (%) - Republican Party (Dole)
1996 Presidential Elections Results (%) - Other
2000 Presidential Elections Results (%) - Democratic Party (Gore)
2000 Presidential Elections Results (%) - Republican Party (Bush)
2000 Presidential Elections Results (%) - Other
2004 Presidential Elections Results (%) - Democratic Party (Kerry)
2004 Presidential Elections Results (%) - Republican Party (Bush)
2004 Presidential Elections Results (%) - Other
2008 Presidential Elections Results (%) - Democratic Party (Obama)
2008 Presidential Elections Results (%) - Republican Party (McCain)
2008 Presidential Elections Results (%) - Other
2012 Presidential Elections Results (%) - Democratic Party (Obama)
2012 Presidential Elections Results (%) - Republican Party (Romney)
2012 Presidential Elections Results (%) - Other
2016 Presidential Elections Results (%) - Democratic Party (Clinton)
2016 Presidential Elections Results (%) - Republican Party (Trump)
2016 Presidential Elections Results (%) - Other
2020 Presidential Elections Results (%) - Democratic Party (Biden)
2020 Presidential Elections Results (%) - Republican Party (Trump)
2020 Presidential Elections Results (%) - Other
Ancestries Reported - Arab (%)
Ancestries Reported - Czech (%)
Ancestries Reported - Danish (%)
Ancestries Reported - Dutch (%)
Ancestries Reported - English (%)
Ancestries Reported - French (%)
Ancestries Reported - French Canadian (%)
Ancestries Reported - German (%)
Ancestries Reported - Greek (%)
Ancestries Reported - Hungarian (%)
Ancestries Reported - Irish (%)
Ancestries Reported - Italian (%)
Ancestries Reported - Lithuanian (%)
Ancestries Reported - Norwegian (%)
Ancestries Reported - Polish (%)
Ancestries Reported - Portuguese (%)
Ancestries Reported - Russian (%)
Ancestries Reported - Scotch-Irish (%)
Ancestries Reported - Scottish (%)
Ancestries Reported - Slovak (%)
Ancestries Reported - Subsaharan African (%)
Ancestries Reported - Swedish (%)
Ancestries Reported - Swiss (%)
Ancestries Reported - Ukrainian (%)
Ancestries Reported - United States (%)
Ancestries Reported - Welsh (%)
Ancestries Reported - West Indian (%)
Ancestries Reported - Other (%)
Educational Attainment - No schooling completed (%)
Educational Attainment - Less than high school (%)
Educational Attainment - High school or equivalent (%)
Educational Attainment - Less than 1 year of college (%)
Educational Attainment - 1 or more years of college (%)
Educational Attainment - Associate degree (%)
Educational Attainment - Bachelor's degree (%)
Educational Attainment - Master's degree (%)
Educational Attainment - Professional school degree (%)
Educational Attainment - Doctorate degree (%)
School Enrollment - Nursery, preschool (%)
School Enrollment - Kindergarten (%)
School Enrollment - Grade 1 to 4 (%)
School Enrollment - Grade 5 to 8 (%)
School Enrollment - Grade 9 to 12 (%)
School Enrollment - College undergrad (%)
School Enrollment - Graduate or professional (%)
School Enrollment - Not enrolled in school (%)
School enrollment - Public schools (%)
School enrollment - Private schools (%)
School enrollment - Not enrolled (%)
Median number of rooms in houses and condos
Median number of rooms in apartments
Housing units lacking complete plumbing facilities (%)
Housing units lacking complete kitchen facilities (%)
Density of houses
Urban houses (%)
Rural houses (%)
Households with people 60 years and over (%)
Households with people 65 years and over (%)
Households with people 75 years and over (%)
Households with one or more nonrelatives (%)
Households with no nonrelatives (%)
Population in households (%)
Family households (%)
Nonfamily households (%)
Population in families (%)
Family households with own children (%)
Median number of bedrooms in owner occupied houses
Mean number of bedrooms in owner occupied houses
Median number of bedrooms in renter occupied houses
Mean number of bedrooms in renter occupied houses
Median number of vehichles in owner occupied houses
Mean number of vehichles in owner occupied houses
Median number of vehichles in renter occupied houses
Mean number of vehichles in renter occupied houses
Mortgage status - with mortgage (%)
Mortgage status - with second mortgage (%)
Mortgage status - with home equity loan (%)
Mortgage status - with both second mortgage and home equity loan (%)
Mortgage status - without a mortgage (%)
Average family size
Average family size - White
Average family size - Black or African American
Average family size - Asian
Average family size - Hispanic or Latino
Average family size - American Indian and Alaska Native
Average family size - Multirace
Average family size - Other Race
Geographical mobility - Same house 1 year ago (%)
Geographical mobility - Moved within same county (%)
Geographical mobility - Moved from different county within same state (%)
Geographical mobility - Moved from different state (%)
Geographical mobility - Moved from abroad (%)
Place of birth - Born in state of residence (%)
Place of birth - Born in other state (%)
Place of birth - Native, outside of US (%)
Place of birth - Foreign born (%)
Housing units in structures - 1, detached (%)
Housing units in structures - 1, attached (%)
Housing units in structures - 2 (%)
Housing units in structures - 3 or 4 (%)
Housing units in structures - 5 to 9 (%)
Housing units in structures - 10 to 19 (%)
Housing units in structures - 20 to 49 (%)
Housing units in structures - 50 or more (%)
Housing units in structures - Mobile home (%)
Housing units in structures - Boat, RV, van, etc. (%)
House/condo owner moved in on average (years ago)
Renter moved in on average (years ago)
Year householder moved into unit - Moved in 1999 to March 2000 (%)
Year householder moved into unit - Moved in 1995 to 1998 (%)
Year householder moved into unit - Moved in 1990 to 1994 (%)
Year householder moved into unit - Moved in 1980 to 1989 (%)
Year householder moved into unit - Moved in 1970 to 1979 (%)
Year householder moved into unit - Moved in 1969 or earlier (%)
Means of transportation to work - Drove car alone (%)
Means of transportation to work - Carpooled (%)
Means of transportation to work - Public transportation (%)
Means of transportation to work - Bus or trolley bus (%)
Means of transportation to work - Streetcar or trolley car (%)
Means of transportation to work - Subway or elevated (%)
Means of transportation to work - Railroad (%)
Means of transportation to work - Ferryboat (%)
Means of transportation to work - Taxicab (%)
Means of transportation to work - Motorcycle (%)
Means of transportation to work - Bicycle (%)
Means of transportation to work - Walked (%)
Means of transportation to work - Other means (%)
Working at home (%)
Industry diversity
Most Common Industries - Agriculture, forestry, fishing and hunting, and mining (%)
Most Common Industries - Agriculture, forestry, fishing and hunting (%)
Most Common Industries - Mining, quarrying, and oil and gas extraction (%)
Most Common Industries - Construction (%)
Most Common Industries - Manufacturing (%)
Most Common Industries - Wholesale trade (%)
Most Common Industries - Retail trade (%)
Most Common Industries - Transportation and warehousing, and utilities (%)
Most Common Industries - Transportation and warehousing (%)
Most Common Industries - Utilities (%)
Most Common Industries - Information (%)
Most Common Industries - Finance and insurance, and real estate and rental and leasing (%)
Most Common Industries - Finance and insurance (%)
Most Common Industries - Real estate and rental and leasing (%)
Most Common Industries - Professional, scientific, and management, and administrative and waste management services (%)
Most Common Industries - Professional, scientific, and technical services (%)
Most Common Industries - Management of companies and enterprises (%)
Most Common Industries - Administrative and support and waste management services (%)
Most Common Industries - Educational services, and health care and social assistance (%)
Most Common Industries - Educational services (%)
Most Common Industries - Health care and social assistance (%)
Most Common Industries - Arts, entertainment, and recreation, and accommodation and food services (%)
Most Common Industries - Arts, entertainment, and recreation (%)
Most Common Industries - Accommodation and food services (%)
Most Common Industries - Other services, except public administration (%)
Most Common Industries - Public administration (%)
Occupation diversity
Most Common Occupations - Management, business, science, and arts occupations (%)
Most Common Occupations - Management, business, and financial occupations (%)
Most Common Occupations - Management occupations (%)
Most Common Occupations - Business and financial operations occupations (%)
Most Common Occupations - Computer, engineering, and science occupations (%)
Most Common Occupations - Computer and mathematical occupations (%)
Most Common Occupations - Architecture and engineering occupations (%)
Most Common Occupations - Life, physical, and social science occupations (%)
Most Common Occupations - Education, legal, community service, arts, and media occupations (%)
Most Common Occupations - Community and social service occupations (%)
Most Common Occupations - Legal occupations (%)
Most Common Occupations - Education, training, and library occupations (%)
Most Common Occupations - Arts, design, entertainment, sports, and media occupations (%)
Most Common Occupations - Healthcare practitioners and technical occupations (%)
Most Common Occupations - Health diagnosing and treating practitioners and other technical occupations (%)
Most Common Occupations - Health technologists and technicians (%)
Most Common Occupations - Service occupations (%)
Most Common Occupations - Healthcare support occupations (%)
Most Common Occupations - Protective service occupations (%)
Most Common Occupations - Fire fighting and prevention, and other protective service workers including supervisors (%)
Most Common Occupations - Law enforcement workers including supervisors (%)
Most Common Occupations - Food preparation and serving related occupations (%)
Most Common Occupations - Building and grounds cleaning and maintenance occupations (%)
Most Common Occupations - Personal care and service occupations (%)
Most Common Occupations - Sales and office occupations (%)
Most Common Occupations - Sales and related occupations (%)
Most Common Occupations - Office and administrative support occupations (%)
Most Common Occupations - Natural resources, construction, and maintenance occupations (%)
Most Common Occupations - Farming, fishing, and forestry occupations (%)
Most Common Occupations - Construction and extraction occupations (%)
Most Common Occupations - Installation, maintenance, and repair occupations (%)
Most Common Occupations - Production, transportation, and material moving occupations (%)
Most Common Occupations - Production occupations (%)
Most Common Occupations - Transportation occupations (%)
Most Common Occupations - Material moving occupations (%)
People in Group quarters - Institutionalized population (%)
People in Group quarters - Correctional institutions (%)
People in Group quarters - Federal prisons and detention centers (%)
People in Group quarters - Halfway houses (%)
People in Group quarters - Local jails and other confinement facilities (including police lockups) (%)
People in Group quarters - Military disciplinary barracks (%)
People in Group quarters - State prisons (%)
People in Group quarters - Other types of correctional institutions (%)
People in Group quarters - Nursing homes (%)
People in Group quarters - Hospitals/wards, hospices, and schools for the handicapped (%)
People in Group quarters - Hospitals/wards and hospices for chronically ill (%)
People in Group quarters - Hospices or homes for chronically ill (%)
People in Group quarters - Military hospitals or wards for chronically ill (%)
People in Group quarters - Other hospitals or wards for chronically ill (%)
People in Group quarters - Hospitals or wards for drug/alcohol abuse (%)
People in Group quarters - Mental (Psychiatric) hospitals or wards (%)
People in Group quarters - Schools, hospitals, or wards for the mentally retarded (%)
People in Group quarters - Schools, hospitals, or wards for the physically handicapped (%)
People in Group quarters - Institutions for the deaf (%)
People in Group quarters - Institutions for the blind (%)
People in Group quarters - Orthopedic wards and institutions for the physically handicapped (%)
People in Group quarters - Wards in general hospitals for patients who have no usual home elsewhere (%)
People in Group quarters - Wards in military hospitals for patients who have no usual home elsewhere (%)
People in Group quarters - Juvenile institutions (%)
People in Group quarters - Long-term care (%)
People in Group quarters - Homes for abused, dependent, and neglected children (%)
People in Group quarters - Residential treatment centers for emotionally disturbed children (%)
People in Group quarters - Training schools for juvenile delinquents (%)
People in Group quarters - Short-term care, detention or diagnostic centers for delinquent children (%)
People in Group quarters - Type of juvenile institution unknown (%)
People in Group quarters - Noninstitutionalized population (%)
People in Group quarters - College dormitories (includes college quarters off campus) (%)
People in Group quarters - Military quarters (%)
People in Group quarters - On base (%)
People in Group quarters - Barracks, unaccompanied personnel housing (UPH), (Enlisted/Officer), ;and similar group living quarters for military personnel (%)
People in Group quarters - Transient quarters for temporary residents (%)
People in Group quarters - Military ships (%)
People in Group quarters - Group homes (%)
People in Group quarters - Homes or halfway houses for drug/alcohol abuse (%)
People in Group quarters - Homes for the mentally ill (%)
People in Group quarters - Homes for the mentally retarded (%)
People in Group quarters - Homes for the physically handicapped (%)
People in Group quarters - Other group homes (%)
People in Group quarters - Religious group quarters (%)
People in Group quarters - Dormitories (%)
People in Group quarters - Agriculture workers' dormitories on farms (%)
People in Group quarters - Job Corps and vocational training facilities (%)
People in Group quarters - Other workers' dormitories (%)
People in Group quarters - Crews of maritime vessels (%)
People in Group quarters - Other nonhousehold living situations (%)
People in Group quarters - Other noninstitutional group quarters (%)
Residents speaking English at home (%)
Residents speaking English at home - Born in the United States (%)
Residents speaking English at home - Native, born elsewhere (%)
Residents speaking English at home - Foreign born (%)
Residents speaking Spanish at home (%)
Residents speaking Spanish at home - Born in the United States (%)
Residents speaking Spanish at home - Native, born elsewhere (%)
Residents speaking Spanish at home - Foreign born (%)
Residents speaking other language at home (%)
Residents speaking other language at home - Born in the United States (%)
Residents speaking other language at home - Native, born elsewhere (%)
Residents speaking other language at home - Foreign born (%)
Class of Workers - Employee of private company (%)
Class of Workers - Self-employed in own incorporated business (%)
Class of Workers - Private not-for-profit wage and salary workers (%)
Class of Workers - Local government workers (%)
Class of Workers - State government workers (%)
Class of Workers - Federal government workers (%)
Class of Workers - Self-employed workers in own not incorporated business and Unpaid family workers (%)
House heating fuel used in houses and condos - Utility gas (%)
House heating fuel used in houses and condos - Bottled, tank, or LP gas (%)
House heating fuel used in houses and condos - Electricity (%)
House heating fuel used in houses and condos - Fuel oil, kerosene, etc. (%)
House heating fuel used in houses and condos - Coal or coke (%)
House heating fuel used in houses and condos - Wood (%)
House heating fuel used in houses and condos - Solar energy (%)
House heating fuel used in houses and condos - Other fuel (%)
House heating fuel used in houses and condos - No fuel used (%)
House heating fuel used in apartments - Utility gas (%)
House heating fuel used in apartments - Bottled, tank, or LP gas (%)
House heating fuel used in apartments - Electricity (%)
House heating fuel used in apartments - Fuel oil, kerosene, etc. (%)
House heating fuel used in apartments - Coal or coke (%)
House heating fuel used in apartments - Wood (%)
House heating fuel used in apartments - Solar energy (%)
House heating fuel used in apartments - Other fuel (%)
House heating fuel used in apartments - No fuel used (%)
Armed forces status - In Armed Forces (%)
Armed forces status - Civilian (%)
Armed forces status - Civilian - Veteran (%)
Armed forces status - Civilian - Nonveteran (%)
Fatal accidents locations in years 2005-2021
Fatal accidents locations in 2005
Fatal accidents locations in 2006
Fatal accidents locations in 2007
Fatal accidents locations in 2008
Fatal accidents locations in 2009
Fatal accidents locations in 2010
Fatal accidents locations in 2011
Fatal accidents locations in 2012
Fatal accidents locations in 2013
Fatal accidents locations in 2014
Fatal accidents locations in 2015
Fatal accidents locations in 2016
Fatal accidents locations in 2017
Fatal accidents locations in 2018
Fatal accidents locations in 2019
Fatal accidents locations in 2020
Fatal accidents locations in 2021
Alcohol use - People drinking some alcohol every month (%)
Alcohol use - People not drinking at all (%)
Alcohol use - Average days/month drinking alcohol
Alcohol use - Average drinks/week
Alcohol use - Average days/year people drink much
Audiometry - Average condition of hearing (%)
Audiometry - People that can hear a whisper from across a quiet room (%)
Audiometry - People that can hear normal voice from across a quiet room (%)
Audiometry - Ears ringing, roaring, buzzing (%)
Audiometry - Had a job exposure to loud noise (%)
Audiometry - Had off-work exposure to loud noise (%)
Blood Pressure & Cholesterol - Has high blood pressure (%)
Blood Pressure & Cholesterol - Checking blood pressure at home (%)
Blood Pressure & Cholesterol - Frequently checking blood cholesterol (%)
Blood Pressure & Cholesterol - Has high cholesterol level (%)
Consumer Behavior - Money monthly spent on food at supermarket/grocery store
Consumer Behavior - Money monthly spent on food at other stores
Consumer Behavior - Money monthly spent on eating out
Consumer Behavior - Money monthly spent on carryout/delivered foods
Consumer Behavior - Income spent on food at supermarket/grocery store (%)
Consumer Behavior - Income spent on food at other stores (%)
Consumer Behavior - Income spent on eating out (%)
Consumer Behavior - Income spent on carryout/delivered foods (%)
Current Health Status - General health condition (%)
Current Health Status - Blood donors (%)
Current Health Status - Has blood ever tested for HIV virus (%)
Current Health Status - Left-handed people (%)
Dermatology - People using sunscreen (%)
Diabetes - Diabetics (%)
Diabetes - Had a blood test for high blood sugar (%)
Diabetes - People taking insulin (%)
Diet Behavior & Nutrition - Diet health (%)
Diet Behavior & Nutrition - Milk product consumption (# of products/month)
Diet Behavior & Nutrition - Meals not home prepared (#/week)
Diet Behavior & Nutrition - Meals from fast food or pizza place (#/week)
Diet Behavior & Nutrition - Ready-to-eat foods (#/month)
Diet Behavior & Nutrition - Frozen meals/pizza (#/month)
Drug Use - People that ever used marijuana or hashish (%)
Drug Use - Ever used hard drugs (%)
Drug Use - Ever used any form of cocaine (%)
Drug Use - Ever used heroin (%)
Drug Use - Ever used methamphetamine (%)
Health Insurance - People covered by health insurance (%)
Kidney Conditions-Urology - Avg. # of times urinating at night
Medical Conditions - People with asthma (%)
Medical Conditions - People with anemia (%)
Medical Conditions - People with psoriasis (%)
Medical Conditions - People with overweight (%)
Medical Conditions - Elderly people having difficulties in thinking or remembering (%)
Medical Conditions - People who ever received blood transfusion (%)
Medical Conditions - People having trouble seeing even with glass/contacts (%)
Medical Conditions - People with arthritis (%)
Medical Conditions - People with gout (%)
Medical Conditions - People with congestive heart failure (%)
Medical Conditions - People with coronary heart disease (%)
Medical Conditions - People with angina pectoris (%)
Medical Conditions - People who ever had heart attack (%)
Medical Conditions - People who ever had stroke (%)
Medical Conditions - People with emphysema (%)
Medical Conditions - People with thyroid problem (%)
Medical Conditions - People with chronic bronchitis (%)
Medical Conditions - People with any liver condition (%)
Medical Conditions - People who ever had cancer or malignancy (%)
Mental Health - People who have little interest in doing things (%)
Mental Health - People feeling down, depressed, or hopeless (%)
Mental Health - People who have trouble sleeping or sleeping too much (%)
Mental Health - People feeling tired or having little energy (%)
Mental Health - People with poor appetite or overeating (%)
Mental Health - People feeling bad about themself (%)
Mental Health - People who have trouble concentrating on things (%)
Mental Health - People moving or speaking slowly or too fast (%)
Mental Health - People having thoughts they would be better off dead (%)
Oral Health - Average years since last visit a dentist
Oral Health - People embarrassed because of mouth (%)
Oral Health - People with gum disease (%)
Oral Health - General health of teeth and gums (%)
Oral Health - Average days a week using dental floss/device
Oral Health - Average days a week using mouthwash for dental problem
Oral Health - Average number of teeth
Pesticide Use - Households using pesticides to control insects (%)
Pesticide Use - Households using pesticides to kill weeds (%)
Physical Activity - People doing vigorous-intensity work activities (%)
Physical Activity - People doing moderate-intensity work activities (%)
Physical Activity - People walking or bicycling (%)
Physical Activity - People doing vigorous-intensity recreational activities (%)
Physical Activity - People doing moderate-intensity recreational activities (%)
Physical Activity - Average hours a day doing sedentary activities
Physical Activity - Average hours a day watching TV or videos
Physical Activity - Average hours a day using computer
Physical Functioning - People having limitations keeping them from working (%)
Physical Functioning - People limited in amount of work they can do (%)
Physical Functioning - People that need special equipment to walk (%)
Physical Functioning - People experiencing confusion/memory problems (%)
Physical Functioning - People requiring special healthcare equipment (%)
Prescription Medications - Average number of prescription medicines taking
Preventive Aspirin Use - Adults 40+ taking low-dose aspirin (%)
Reproductive Health - Vaginal deliveries (%)
Reproductive Health - Cesarean deliveries (%)
Reproductive Health - Deliveries resulted in a live birth (%)
Reproductive Health - Pregnancies resulted in a delivery (%)
Reproductive Health - Women breastfeeding newborns (%)
Reproductive Health - Women that had a hysterectomy (%)
Reproductive Health - Women that had both ovaries removed (%)
Reproductive Health - Women that have ever taken birth control pills (%)
Reproductive Health - Women taking birth control pills (%)
Reproductive Health - Women that have ever used Depo-Provera or injectables (%)
Reproductive Health - Women that have ever used female hormones (%)
Sexual Behavior - People 18+ that ever had sex (vaginal, anal, or oral) (%)
Sexual Behavior - Males 18+ that ever had vaginal sex with a woman (%)
Sexual Behavior - Males 18+ that ever performed oral sex on a woman (%)
Sexual Behavior - Males 18+ that ever had anal sex with a woman (%)
Sexual Behavior - Males 18+ that ever had any sex with a man (%)
Sexual Behavior - Females 18+ that ever had vaginal sex with a man (%)
Sexual Behavior - Females 18+ that ever performed oral sex on a man (%)
Sexual Behavior - Females 18+ that ever had anal sex with a man (%)
Sexual Behavior - Females 18+ that ever had any kind of sex with a woman (%)
Sexual Behavior - Average age people first had sex
Sexual Behavior - Average number of female sex partners in lifetime (males 18+)
Sexual Behavior - Average number of female vaginal sex partners in lifetime (males 18+)
Sexual Behavior - Average age people first performed oral sex on a woman (18+)
Sexual Behavior - Average number of woman performed oral sex on in lifetime (18+)
Sexual Behavior - Average number of male sex partners in lifetime (males 18+)
Sexual Behavior - Average number of male anal sex partners in lifetime (males 18+)
Sexual Behavior - Average age people first performed oral sex on a man (18+)
Sexual Behavior - Average number of male oral sex partners in lifetime (18+)
Sexual Behavior - People using protection when performing oral sex (%)
Sexual Behavior - Average number of times people have vaginal or anal sex a year
Sexual Behavior - People having sex without condom (%)
Sexual Behavior - Average number of male sex partners in lifetime (females 18+)
Sexual Behavior - Average number of male vaginal sex partners in lifetime (females 18+)
Sexual Behavior - Average number of female sex partners in lifetime (females 18+)
Sexual Behavior - Circumcised males 18+ (%)
Sleep Disorders - Average hours sleeping at night
Sleep Disorders - People that has trouble sleeping (%)
Smoking-Cigarette Use - People smoking cigarettes (%)
Taste & Smell - People 40+ having problems with smell (%)
Taste & Smell - People 40+ having problems with taste (%)
Taste & Smell - People 40+ that ever had wisdom teeth removed (%)
Taste & Smell - People 40+ that ever had tonsils teeth removed (%)
Taste & Smell - People 40+ that ever had a loss of consciousness because of a head injury (%)
Taste & Smell - People 40+ that ever had a broken nose or other serious injury to face or skull (%)
Taste & Smell - People 40+ that ever had two or more sinus infections (%)
Weight - Average height (inches)
Weight - Average weight (pounds)
Weight - Average BMI
Weight - People that are obese (%)
Weight - People that ever were obese (%)
Weight - People trying to lose weight (%)
Urban population: 4,620
Rural population: 13,507
Estimated median house/condo value in 2022: $344,084
30656:
$344,084Georgia:
$297,400
Median resident age: This zip code:
42.0 yearsGeorgia median age:
37.6 years
Average household size: This zip code:
2.9 peopleGeorgia:
2.6 people
Averages for the 2020 tax year for zip code 30656, filed in 2021:
Average Adjusted Gross Income (AGI) in 2020: $71,732 (Individual Income Tax Returns) Here:
$71,732State:
$70,847
Salary/wage: $56,050 (reported on 82.6% of returns )Here:
$56,050State:
$59,126
(% of AGI for various income ranges: 1217.3% for AGIs below $25k , 3711.2% for AGIs $25k-50k , 6731.8% for AGIs $50k-75k , 10072.1% for AGIs $75k-100k , 19534.0% for AGIs $100k-200k , 61596.0% for AGIs over 200k ) Taxable interest for individuals: $1,257 (reported on 23.7% of returns )This zip code:
$1,257Georgia:
$2,011
(% of AGI for various income ranges: 12.6% for AGIs below $25k , 14.4% for AGIs $25k-50k , 28.9% for AGIs $50k-75k , 59.2% for AGIs $75k-100k , 141.2% for AGIs $100k-200k , 501.0% for AGIs over 200k ) Ordinary dividends: $4,660 (reported on 15.5% of returns )(% of AGI for various income ranges: 17.3% for AGIs below $25k , 25.4% for AGIs $25k-50k , 39.8% for AGIs $50k-75k , 154.0% for AGIs $75k-100k , 317.3% for AGIs $100k-200k , 2005.0% for AGIs over 200k ) Net capital gain/loss in AGI: +$23,623 (reported on 13.2% of returns )Here:
+$23,623State:
+$28,402
(% of AGI for various income ranges: 2.8% for AGIs below $25k , 32.8% for AGIs $25k-50k , 51.5% for AGIs $50k-75k , 256.2% for AGIs $75k-100k , 526.7% for AGIs $100k-200k , 20107.0% for AGIs over 200k ) Profit/loss from business: +$6,975 (reported on 20.9% of returns )Here:
+$6,975State:
+$6,707
(% of AGI for various income ranges: 102.7% for AGIs below $25k , 76.6% for AGIs $25k-50k , 150.0% for AGIs $50k-75k , 323.8% for AGIs $75k-100k , 413.9% for AGIs $100k-200k , 3185.0% for AGIs over 200k ) Taxable individual retirement arrangement distribution: $22,010 (reported on 8.5% of returns )30656:
$22,010Georgia:
$20,525
(% of AGI for various income ranges: 42.6% for AGIs below $25k , 100.1% for AGIs $25k-50k , 186.4% for AGIs $50k-75k , 405.8% for AGIs $75k-100k , 945.2% for AGIs $100k-200k , 3171.0% for AGIs over 200k ) Total itemized deductions: $33,467 (reported on 12.5% of returns )Here:
$33,467State:
$34,001
(% of AGI for various income ranges: 49.2% for AGIs below $25k , 170.4% for AGIs $25k-50k , 452.1% for AGIs $50k-75k , 870.2% for AGIs $75k-100k , 1533.6% for AGIs $100k-200k , 12482.0% for AGIs over 200k ) Charity contributions: $15,297 (reported on 10.8% of returns )Here:
$15,297State:
$14,164
(% of AGI for various income ranges: 8.5% for AGIs below $25k , 31.6% for AGIs $25k-50k , 97.6% for AGIs $50k-75k , 225.2% for AGIs $75k-100k , 489.4% for AGIs $100k-200k , 7817.0% for AGIs over 200k ) Taxes paid: $7,529 (reported on 12.4% of returns )(% of AGI for various income ranges: 7.4% for AGIs below $25k , 37.9% for AGIs $25k-50k , 111.8% for AGIs $50k-75k , 217.5% for AGIs $75k-100k , 457.0% for AGIs $100k-200k , 1861.0% for AGIs over 200k ) Earned income credit: $2,403 (reported on 17.4% of returns )(% of AGI for various income ranges: 116.0% for AGIs below $25k , 76.2% for AGIs $25k-50k , 1.6% for AGIs $50k-75k ) Percentage of individuals using paid preparers for their 2020 taxes: 93.3%(% for various income ranges: 92.3% for AGIs below $25k , 93.7% for AGIs $25k-50k , 93.3% for AGIs $50k-75k , 93.9% for AGIs $75k-100k , 94.0% for AGIs $100k-200k , 93.9% for AGIs over 200k )
Averages for the 2012 tax year for zip code 30656, filed in 2013:
Average Adjusted Gross Income (AGI) in 2012: $52,142 (Individual Income Tax Returns) Here:
$52,142State:
$56,131
Salary/wage: $45,238 (reported on 86.1% of returns )Here:
$45,238State:
$47,942
(% of AGI for various income ranges: 76.3% for AGIs below $25k , 82.9% for AGIs $25k-50k , 78.4% for AGIs $50k-75k , 76.3% for AGIs $75k-100k , 75.9% for AGIs $100k-200k , 51.7% for AGIs over 200k ) Taxable interest for individuals: $1,270 (reported on 26.9% of returns )This zip code:
$1,270Georgia:
$1,706
(% of AGI for various income ranges: 1.2% for AGIs below $25k , 0.7% for AGIs $25k-50k , 0.6% for AGIs $50k-75k , 0.8% for AGIs $75k-100k , 0.4% for AGIs $100k-200k , 0.5% for AGIs over 200k ) Ordinary dividends: $6,132 (reported on 15.8% of returns )(% of AGI for various income ranges: 0.7% for AGIs below $25k , 0.5% for AGIs $25k-50k , 0.6% for AGIs $50k-75k , 1.3% for AGIs $75k-100k , 0.8% for AGIs $100k-200k , 9.8% for AGIs over 200k ) Net capital gain/loss in AGI: +$4,069 (reported on 10.8% of returns )Here:
+$4,069State:
+$16,323
(% of AGI for various income ranges: 0.2% for AGIs $50k-75k , 0.9% for AGIs $75k-100k , 0.6% for AGIs $100k-200k , 4.0% for AGIs over 200k ) Profit/loss from business: +$8,247 (reported on 19.9% of returns )Here:
+$8,247State:
+$7,583
(% of AGI for various income ranges: 8.9% for AGIs below $25k , 1.9% for AGIs $25k-50k , 2.5% for AGIs $50k-75k , 1.8% for AGIs $75k-100k , 3.1% for AGIs $100k-200k , 3.6% for AGIs over 200k ) Taxable individual retirement arrangement distribution: $15,993 (reported on 9.1% of returns )30656:
$15,993Georgia:
$17,199
(% of AGI for various income ranges: 2.2% for AGIs below $25k , 2.3% for AGIs $25k-50k , 2.3% for AGIs $50k-75k , 2.9% for AGIs $75k-100k , 3.5% for AGIs $100k-200k , 3.1% for AGIs over 200k ) Total itemized deductions: $20,899 (24% of AGI, reported on 41.7% of returns )Here:
$20,899State:
$23,886
Here:
24.3% of AGIState:
21.5% of AGI
(% of AGI for various income ranges: 9.9% for AGIs below $25k , 16.1% for AGIs $25k-50k , 18.1% for AGIs $50k-75k , 19.6% for AGIs $75k-100k , 17.7% for AGIs $100k-200k , 14.6% for AGIs over 200k ) Charity contributions: $4,043 (reported on 35.3% of returns )(% of AGI for various income ranges: 1.3% for AGIs below $25k , 2.4% for AGIs $25k-50k , 2.6% for AGIs $50k-75k , 2.9% for AGIs $75k-100k , 3.0% for AGIs $100k-200k , 3.7% for AGIs over 200k ) Taxes paid: $6,415 (reported on 41.7% of returns )(% of AGI for various income ranges: 1.9% for AGIs below $25k , 3.4% for AGIs $25k-50k , 5.0% for AGIs $50k-75k , 5.8% for AGIs $75k-100k , 6.5% for AGIs $100k-200k , 6.3% for AGIs over 200k ) Earned income credit: $2,515 (reported on 23.1% of returns )(% of AGI for various income ranges: 9.6% for AGIs below $25k , 1.5% for AGIs $25k-50k ) Percentage of individuals using paid preparers for their 2012 taxes: 51.4%(% for various income ranges: 49.2% for AGIs below $25k , 49.7% for AGIs $25k-50k , 54.4% for AGIs $50k-75k , 50.8% for AGIs $75k-100k , 56.3% for AGIs $100k-200k , 72.7% for AGIs over 200k )
Averages for the 2004 tax year for zip code 30656, filed in 2005:
Average Adjusted Gross Income (AGI) in 2004: $48,009 (Individual Income Tax Returns) Here:
$48,009State:
$47,553
Salary/wage: $42,612 (reported on 88.6% of returns )Here:
$42,612State:
$42,178
(% of AGI for various income ranges: 100.5% for AGIs below $10k , 84.3% for AGIs $10k-25k , 85.3% for AGIs $25k-50k , 83.2% for AGIs $50k-75k , 83.5% for AGIs $75k-100k , 67.1% for AGIs over 100k ) Taxable interest for individuals: $1,266 (reported on 35.6% of returns )This zip code:
$1,266Georgia:
$1,772
(% of AGI for various income ranges: 2.9% for AGIs below $10k , 1.2% for AGIs $10k-25k , 0.8% for AGIs $25k-50k , 0.8% for AGIs $50k-75k , 0.7% for AGIs $75k-100k , 1.1% for AGIs over 100k ) Taxable dividends: $1,682 (reported on 18.4% of returns )(% of AGI for various income ranges: 0.8% for AGIs below $10k , 0.6% for AGIs $10k-25k , 0.5% for AGIs $25k-50k , 0.4% for AGIs $50k-75k , 0.4% for AGIs $75k-100k , 1.1% for AGIs over 100k ) Net capital gain/loss: +$11,215 (reported on 13.5% of returns )Here:
+$11,215State:
+$16,461
(% of AGI for various income ranges: 1.5% for AGIs below $10k , 0.2% for AGIs $10k-25k , 0.6% for AGIs $25k-50k , 0.6% for AGIs $50k-75k , 1.8% for AGIs $75k-100k , 7.7% for AGIs over 100k ) Profit/loss from business: +$9,506 (reported on 18.6% of returns )Here:
+$9,506State:
+$8,201
(% of AGI for various income ranges: 12.7% for AGIs below $10k , 6.5% for AGIs $10k-25k , 4.2% for AGIs $25k-50k , 2.3% for AGIs $50k-75k , 2.7% for AGIs $75k-100k , 3.7% for AGIs over 100k ) IRA payment deduction: $2,853 (reported on 2.2% of returns )30656:
$2,853Georgia:
$2,969
(% of AGI for various income ranges: 0.2% for AGIs $25k-50k , 0.1% for AGIs $50k-75k , 0.2% for AGIs $75k-100k , 0.1% for AGIs over 100k ) Self-employed pension: $14,045 (reported on 0.4% of returns )Here:
$14,045Georgia:
$16,203
Total itemized deductions: $18,571 (25% of AGI, reported on 49.0% of returns )Here:
$18,571State:
$19,944
Here:
25.2% of AGIState:
22.6% of AGI
(% of AGI for various income ranges: 13.4% for AGIs below $10k , 12.3% for AGIs $10k-25k , 21.3% for AGIs $25k-50k , 20.8% for AGIs $50k-75k , 21.0% for AGIs $75k-100k , 17.2% for AGIs over 100k ) Charity contributions deductions: $3,286 (4% of AGI, reported on 42.2% of returns )Here:
4.3% of AGIState:
4.7% of AGI
(% of AGI for various income ranges: 0.6% for AGIs below $10k , 1.5% for AGIs $10k-25k , 2.5% for AGIs $25k-50k , 3.0% for AGIs $50k-75k , 3.5% for AGIs $75k-100k , 3.1% for AGIs over 100k ) Total tax: $6,502 (reported on 75.1% of returns )(% of AGI for various income ranges: 3.5% for AGIs below $10k , 3.8% for AGIs $10k-25k , 6.2% for AGIs $25k-50k , 7.9% for AGIs $50k-75k , 9.4% for AGIs $75k-100k , 16.1% for AGIs over 100k ) Earned income credit: $1,951 (reported on 18.2% of returns )Percentage of individuals using paid preparers for their 2004 taxes: 58.5%(% for various income ranges: 47.1% for AGIs below $10k , 59.5% for AGIs $10k-25k , 60.1% for AGIs $25k-50k , 59.3% for AGIs $50k-75k , 58.4% for AGIs $75k-100k , 69.3% for AGIs over 100k )
Estimated median household income in 2022: This zip code:
$88,782Georgia:
$72,837
Nearest zip codes: 30620 ,
30655 ,
30680 ,
30641 ,
30666 ,
30052 .
Monroe Zip Code Map
Percentage of family households: This zip code:
59.6%Georgia:
48.5%
Percentage of households with unmarried partners: This zip code:
5.7%Georgia:
46.9%
Likely homosexual households (counted as self-reported same-sex unmarried-partner households)
Lesbian couples: 0.2% of all households Gay men: 0.0% of all households
Household received Food Stamps/SNAP in the past 12 months: 521Household did not receive Food Stamps/SNAP in the past 12 months: 5,651
Women who had a birth in the past 12 months: 243 (222 now married , 21 unmarried) Women who did not have a birth in the past 12 months: 3,776 (1,754 now married , 2,019 unmarried)
Housing units in zip code 30656 with a mortgage: 3,706 (281
second mortgage , 253
both second mortgage and home equity loan )
Houses without a mortgage: 69
Median monthly owner costs for units with a mortgage: $1,587
Median monthly owner costs for units without a mortgage: $451
Residents with income below the poverty level in 2022:
This zip code:
8.6%Whole state:
12.7%
Residents with income below 50% of the poverty level in 2022:
This zip code:
6.1%Whole state:
6.3%
Median number of rooms in houses and condos: Median number of rooms in apartments: Notable locations in this zip code not listed on our city pages
Click to draw/clear zip code borders Notable locations in zip code 30656: (A) , Walton County Emergency Medical Services Unit 2 (B) , Walton County Fire / Rescue Department Station 9 (C) , Walton County Fire / Rescue Department Station 8 (D) . Display/hide their locations on the map
Churches in zip code 30656 include: (A) , Lost City Miracle Church (B) , Macedonia Church (C) , Mountain Creek Church (D) , New Hope Church (E) , Hickory Grove Church (F) , Prospect Church (G) , Friendship Church (H) , Double Springs Church (I) . Display/hide their locations on the map
Cemeteries: (1) , Mountain Creek Cemetery (2) , Parker Cemetery (3) , Adams Cemetery (4) , Alcovy Cemetery (5) , Bell Cemetery (6) , Bradley Cemetery (7) . Display/hide their locations on the map
Reservoirs: (A) , Bucaneer Lake (B) , Aycock Lake (C) , Black Lake (D) , Williamson Lake (E) , Waller Lake (F) . Display/hide their locations on the map
Creeks: (A) , Wildcat Creek (B) , Dove Creek (C) , Beaverdam Creek (D) , Bay Creek (E) , Little Shoal Creek (F) . Display/hide their locations on the map
Park in zip code 30656: (1) . Display/hide its location on the map
Year house built (houses)
10 2020 or later515 2010 to 20192,285 2000 to 20091,456 1990 to 1999748 1980 to 1989562 1970 to 1979245 1960 to 1969119 1950 to 195973 1940 to 1949156 1939 or earlier
Zip code 30656 household income distribution in 2022 54 Less than $10,00092 $10,000 to $14,999148 $15,000 to $19,999191 $20,000 to $24,999208 $25,000 to $29,999246 $30,000 to $34,99962 $35,000 to $39,999307 $40,000 to $44,999397 $45,000 to $49,999302 $50,000 to $59,999488 $60,000 to $74,9991,165 $75,000 to $99,999648 $100,000 to $124,999655 $125,000 to $149,999590 $150,000 to $199,999648 $200,000 or moreEstimate of home value of owner-occupied houses/condos in 2022 in zip code 30656 55 Less than $10,0009 $10,000 to $14,99913 $15,000 to $19,99917 $20,000 to $24,99910 $25,000 to $29,9992 $30,000 to $34,99919 $35,000 to $39,99947 $40,000 to $49,99948 $50,000 to $59,99962 $60,000 to $69,99949 $70,000 to $79,99916 $80,000 to $89,99945 $90,000 to $99,999170 $100,000 to $124,999159 $125,000 to $149,999262 $150,000 to $174,999281 $175,000 to $199,999472 $200,000 to $249,999425 $250,000 to $299,9991,842 $300,000 to $399,999729 $400,000 to $499,999322 $500,000 to $749,999121 $750,000 to $999,99961 $1,000,000 to $1,499,99949 $2,000,000 or moreRent paid by renters in 2022 in zip code 30656 10 Less than $10013 $400 to $44976 $450 to $49992 $500 to $54924 $550 to $59940 $600 to $64917 $650 to $69999 $750 to $79964 $800 to $89986 $900 to $999287 $1,000 to $1,249130 $1,250 to $1,49947 No cash rent
Median gross rent in 2022: $1,348.
Median price asked for vacant for-sale houses and condos in 2022: $192,617.
Estimated median house (or condo) value in 2022 for: White Non-Hispanic householders: $361,672Black or African American householders: $266,697Asian householders: $282,366Some other race householders: $359,753Two or more races householders: $879,397Hispanic or Latino householders: $356,875Estimated median house or condo value in 2022: $344,084
30656:
$344,084Georgia:
$297,400
Lower value quartile - upper value quartile: $203,273 - $437,857
Housing units in structures:
One, detached: 5,802Two: 935 to 9: 410 to 19: 23Mobile homes: 380Unemployment : 5.5%
Means of transportation to work in zip code 30656 77.6% 7,215 Drove a car alone6.0% 557 Carpooled0.5% 45 Bus or trolley bus0.2% 19 Taxi2.1% 191 Walked0.2% 15 Other means12.4% 1,152 Worked at homeTravel time to work (commute) in zip code 30656 222 Less than 5 minutes441 5 to 9 minutes1,040 10 to 14 minutes708 15 to 19 minutes1,039 20 to 24 minutes368 25 to 29 minutes965 30 to 34 minutes379 35 to 39 minutes586 40 to 44 minutes1,072 45 to 59 minutes920 60 to 89 minutes298 90 or more minutes
Percentage of zip code residents living and working in this county: 45.5%
Household type by relationship:
Households: 18,128
Male householders: 3,193 (547 living alone ), Female householders: 3,000 (431 living alone )4,197 spouses (4,115 opposite-sex spouses ), 395 unmarried partners , (395 opposite-sex unmarried partners ), 5,018 children (4,715 natural , 201 adopted , 104 stepchildren ), 675 grandchildren , 240 brothers or sisters , 324 parents , 81 foster children , 556 other relatives , 287 non-relatives In group quarters: 191 (-1 institutionalized population )
Size of family households: 1,933 2-persons , 1,265 3-persons , 1,007 4-persons , 558 5-persons , 82 6-persons , 149 7-or-more-persons
Size of nonfamily households: 983 1-person , 177 2-persons , 15 3-persons , 16 4-persons , 7 5-persons
2,365 married couples with children. single-parent households (197 men , 372 women ).
95.0% of residents of 30656 zip code speak English at home. of residents speak Spanish at home (57% very well, 19% well, 18% not well, 5% not at all ).of residents speak other Indo-European language at home (98% very well, 2% well ).
Foreign born population: 427 (2.4%)
(71.6%
of them are naturalized citizens )
This zip code:
2.4%Whole state:
10.7%
29% Honduras 22% Poland 10% Haiti 6% Nicaragua 6% St. Vincent and the Grenadines 4% France 4% Bhutan 18% English 13% American 7% Irish 4% German 2% Scottish 2% Romanian 2% Welsh
Year of entry for the foreign-born population
207 2010 or later 142 2000 to 2009 215 1990 to 1999 107 Before 1990
Facilities with environmental interests located in this zip code:
APACHE TRANSPORT INC (213 CHERRY HILL RD in MONROE, GA)
(Resource Conservation and Recovery Act (tracking hazardous waste)) Organizations: WILLIAM BOYD CARLYLE (CONTACT/OWNER)
APPLING SAND CO (3881 SIMS BRIDGE RD in MONROE, GA)
National Pollutant Discharge Elimination System NON-MAJOR (Tracking pollutant discharge elimination systems) - permit
MUNICIPAL ELECTRIC AU (995 GRATIS ROAD in MONROE, GA)
AIR MAJOR (AIRS/AFS) Business SIC classification: ELECTRIC SERVICESAlternative names: MUNICIPAL ELECTRIC AUTHORITY OF GEORGIA
Housing units lacking complete kitchen facilities: 0.6%
73.2% Electricity 22.6% Utility gas 4.0% Bottled, tank, or LP gas
Place of birth for U.S.-born residents:
This state: 12,383Northeast: 917Midwest: 1,283South: 2,151West: 618
55% of the 30656 zip code residents lived in the same house 5 years ago.
Out of people who lived in different houses, 42% lived in this county.
Out of people who lived in different counties, 50% lived in Georgia.
92% of the 30656 zip code residents lived in the same house 1 year ago.
Out of people who lived in different houses, 55% moved from this county.
Out of people who lived in different houses, 24% moved from different county within same state.
Out of people who lived in different houses, 19% moved from different state.
Private vs. public school enrollment:
Students in private schools in grades 1 to 8 (elementary and middle school): 232
Students in private schools in grades 9 to 12 (high school): 155
Students in private undergraduate colleges: 23
Occupation by median earnings in the past 12 months ($)
96,819 Architecture and engineering occupations 84,336 Management occupations 76,671 Legal occupations 76,002 Health diagnosing and treating practitioners and other technical occupations 68,075 Health technologists and technicians 66,607 Computer and mathematical occupations
Companies with federal contracts located in this zip code:
S THOMAS HARRELL & ASSOCIATES (2737 SHOAL CREEK ROAD in MONROE, GA; small business) in 7 contracts from 2004 to 2006
Contracts for Other Professional Services, Fire Fighting Equipment, Other Special Studies and Analyses by ArmySigned by year: 2000: $0; 2001: $0; 2002: $0; 2003: $0; 2004: $21,350; 2005: $39,000; 2006: $14,250.
Biggest contracts: with Army for Other Professional Services. Signed on 2005-01-21. Completion date: 2005-01-31.
with Army for Other Professional Services. Taking place in TX. Signed on 2005-12-22. Completion date: 2006-01-31.
with Army for Fire Fighting Equipment. Taking place in NY. Signed on 2006-03-16. Completion date: 2006-05-15.
with Army for Other Special Studies and Analyses. Taking place in AR. Signed on 2004-02-20. Completion date: 2004-03-31.
LAB ESSENTIALS INC (201 OL CROSSLANE ROAD in MONROE, GA; small business) in 4 contracts from 2004 to 2005
$7,945 with NASA for . Signed on 2005-06-01. Effective on 2005-06-06. Completion date: 2005-06-24.
with Air Force for Aircraft Maintenance and Repair Shop Specialized Equipment. Signed on 2005-07-22. Completion date: 2005-08-21.
with Army for Ophthalmic Instruments, Equipment, and Supplies. Signed on 2004-06-24. Completion date: 2001-09-06.
, same as above. Signed on 2004-06-24. Completion date: 2001-09-06.
Top industries in this zip code by the number of employees in 2005:
Construction: Water and Sewer Line and Related Structures Construction (100-249 employees: 1 establishment, 5-9 employees: 2 establishments)Construction: Electrical Contractors (20-49: 1, 10-19: 1, 1-4: 4)Administrative and Support and Waste Management and Remediation Services: Landscaping Services (10-19: 1, 1-4: 10)Other Services (except Public Administration): Religious Organizations (10-19: 1, 5-9: 2, 1-4: 2)Construction: Tile and Terrazzo Contractors (10-19: 1, 1-4: 2)Construction: New Housing Operative Builders (10-19: 1, 1-4: 2)
People in group quarters in 2010:
106 people in nursing facilities/skilled-nursing facilities
People in group quarters in 2000:
105 people in nursing homes
Fatal accident statistics in 2014:
Fatal accident count: 1Vehicles involved in fatal accidents: 1Fatal accidents caused by drunken drivers: 0Fatalities: 1Persons involved in fatal accidents: 1Pedestrians involved in fatal accidents: 0
Fatal accident statistics in 2013:
Fatal accident count: 3Vehicles involved in fatal accidents: 5Fatal accidents caused by drunken drivers: 1Fatalities: 3Persons involved in fatal accidents: 6Pedestrians involved in fatal accidents: 2
Home Mortgage Disclosure Act Aggregated Statistics For Year 2009(Based on 8 partial tracts) A) FHA, FSA/RHS & VA B) Conventional C) Refinancings D) Home Improvement Loans F) Non-occupant Loans on G) Loans On Manufactured Number Average Value Number Average Value Number Average Value Number Average Value Number Average Value Number Average Value
LOANS ORIGINATED 168 $141,378 147 $127,597 768 $175,272 27 $50,926 162 $113,376 5 $96,192 APPLICATIONS APPROVED, NOT ACCEPTED 11 $152,201 0 $0 55 $167,101 7 $19,903 0 $0 0 $0 APPLICATIONS DENIED 24 $158,811 25 $160,028 360 $177,198 25 $50,755 13 $101,986 9 $68,681 APPLICATIONS WITHDRAWN 23 $159,538 20 $142,659 305 $169,924 5 $19,752 10 $98,902 0 $0 FILES CLOSED FOR INCOMPLETENESS 5 $184,182 5 $108,816 39 $163,997 0 $0 0 $0 0 $0
Aggregated Statistics For Year 2008(Based on 8 partial tracts) A) FHA, FSA/RHS & VA B) Conventional C) Refinancings D) Home Improvement Loans E) Loans on Dwellings For 5+ Families F) Non-occupant Loans on G) Loans On Manufactured Number Average Value Number Average Value Number Average Value Number Average Value Number Average Value Number Average Value Number Average Value
LOANS ORIGINATED 125 $145,790 240 $179,257 580 $184,750 55 $40,351 1 $55,000 174 $140,130 13 $88,937 APPLICATIONS APPROVED, NOT ACCEPTED 3 $169,580 32 $194,294 111 $177,064 7 $97,813 0 $0 8 $75,290 4 $106,750 APPLICATIONS DENIED 32 $168,456 70 $173,157 372 $164,232 59 $55,745 0 $0 32 $101,356 7 $98,100 APPLICATIONS WITHDRAWN 19 $138,962 40 $212,274 180 $172,501 13 $64,704 0 $0 10 $98,416 0 $0 FILES CLOSED FOR INCOMPLETENESS 2 $110,645 12 $218,281 38 $150,052 6 $49,827 0 $0 6 $105,528 2 $109,585
Aggregated Statistics For Year 2007(Based on 8 partial tracts) A) FHA, FSA/RHS & VA B) Conventional C) Refinancings D) Home Improvement Loans E) Loans on Dwellings For 5+ Families F) Non-occupant Loans on G) Loans On Manufactured Number Average Value Number Average Value Number Average Value Number Average Value Number Average Value Number Average Value Number Average Value
LOANS ORIGINATED 115 $152,988 654 $157,079 733 $143,451 93 $59,995 2 $146,845 254 $114,207 17 $83,815 APPLICATIONS APPROVED, NOT ACCEPTED 2 $177,070 64 $135,112 124 $143,407 17 $48,901 0 $0 25 $125,443 4 $36,842 APPLICATIONS DENIED 10 $124,529 96 $157,870 647 $145,712 125 $52,752 1 $312,400 77 $137,500 12 $87,237 APPLICATIONS WITHDRAWN 4 $114,210 78 $157,560 274 $159,251 17 $81,065 0 $0 21 $104,254 2 $80,720 FILES CLOSED FOR INCOMPLETENESS 0 $0 22 $139,593 64 $183,062 4 $65,348 0 $0 11 $130,795 0 $0
Aggregated Statistics For Year 2006(Based on 8 partial tracts) A) FHA, FSA/RHS & VA B) Conventional C) Refinancings D) Home Improvement Loans E) Loans on Dwellings For 5+ Families F) Non-occupant Loans on G) Loans On Manufactured Number Average Value Number Average Value Number Average Value Number Average Value Number Average Value Number Average Value Number Average Value
LOANS ORIGINATED 152 $144,064 1,227 $127,341 820 $142,428 126 $45,492 4 $455,420 326 $101,955 20 $75,760 APPLICATIONS APPROVED, NOT ACCEPTED 0 $0 118 $127,027 144 $138,211 25 $43,969 0 $0 52 $166,831 5 $68,310 APPLICATIONS DENIED 12 $115,162 235 $138,342 649 $128,991 95 $40,292 0 $0 92 $169,345 13 $92,522 APPLICATIONS WITHDRAWN 16 $123,166 142 $132,129 384 $141,480 16 $86,068 0 $0 49 $132,675 2 $60,090 FILES CLOSED FOR INCOMPLETENESS 0 $0 29 $121,772 105 $132,380 2 $48,180 0 $0 4 $72,050 0 $0
Aggregated Statistics For Year 2005(Based on 8 partial tracts) A) FHA, FSA/RHS & VA B) Conventional C) Refinancings D) Home Improvement Loans E) Loans on Dwellings For 5+ Families F) Non-occupant Loans on G) Loans On Manufactured Number Average Value Number Average Value Number Average Value Number Average Value Number Average Value Number Average Value Number Average Value
LOANS ORIGINATED 147 $136,475 944 $119,137 1,050 $134,620 93 $53,665 11 $39,626 274 $90,784 20 $87,022 APPLICATIONS APPROVED, NOT ACCEPTED 0 $0 67 $102,845 191 $145,988 18 $42,555 0 $0 37 $79,884 6 $70,108 APPLICATIONS DENIED 11 $111,155 138 $130,056 736 $130,076 115 $37,831 0 $0 53 $88,166 32 $76,287 APPLICATIONS WITHDRAWN 14 $122,974 160 $108,949 422 $151,632 49 $94,285 0 $0 57 $110,945 8 $67,476 FILES CLOSED FOR INCOMPLETENESS 1 $152,700 52 $89,910 204 $153,120 6 $70,835 0 $0 7 $102,317 2 $111,215
Aggregated Statistics For Year 2004(Based on 8 partial tracts) A) FHA, FSA/RHS & VA B) Conventional C) Refinancings D) Home Improvement Loans E) Loans on Dwellings For 5+ Families F) Non-occupant Loans on G) Loans On Manufactured Number Average Value Number Average Value Number Average Value Number Average Value Number Average Value Number Average Value Number Average Value
LOANS ORIGINATED 134 $129,363 691 $130,797 1,044 $135,864 88 $42,485 4 $256,935 253 $85,444 20 $63,804 APPLICATIONS APPROVED, NOT ACCEPTED 2 $179,220 57 $112,616 171 $126,344 12 $30,342 0 $0 33 $89,938 4 $68,288 APPLICATIONS DENIED 12 $117,502 80 $145,086 585 $117,403 75 $29,576 0 $0 34 $99,134 17 $81,947 APPLICATIONS WITHDRAWN 16 $128,125 69 $114,230 280 $135,745 10 $56,694 0 $0 19 $96,451 0 $0 FILES CLOSED FOR INCOMPLETENESS 1 $73,150 15 $149,074 133 $149,545 2 $36,495 0 $0 4 $65,950 1 $73,840
Aggregated Statistics For Year 2003(Based on 8 partial tracts) A) FHA, FSA/RHS & VA B) Conventional C) Refinancings D) Home Improvement Loans F) Non-occupant Loans on Number Average Value Number Average Value Number Average Value Number Average Value Number Average Value
LOANS ORIGINATED 172 $119,379 557 $134,186 1,786 $138,240 79 $31,913 248 $94,145 APPLICATIONS APPROVED, NOT ACCEPTED 2 $128,480 40 $126,716 169 $127,077 12 $41,418 9 $140,126 APPLICATIONS DENIED 11 $137,468 92 $117,332 417 $119,354 56 $32,289 34 $84,580 APPLICATIONS WITHDRAWN 8 $103,044 37 $111,246 291 $116,951 7 $36,584 27 $81,489 FILES CLOSED FOR INCOMPLETENESS 1 $185,030 20 $142,830 86 $145,507 0 $0 5 $79,776
Aggregated Statistics For Year 2002(Based on 6 partial tracts) A) FHA, FSA/RHS & VA B) Conventional C) Refinancings D) Home Improvement Loans E) Loans on Dwellings For 5+ Families F) Non-occupant Loans on Number Average Value Number Average Value Number Average Value Number Average Value Number Average Value Number Average Value
LOANS ORIGINATED 101 $123,536 410 $143,631 964 $135,234 86 $42,102 5 $261,618 173 $97,868 APPLICATIONS APPROVED, NOT ACCEPTED 4 $137,608 27 $116,490 149 $117,887 12 $44,317 0 $0 2 $94,175 APPLICATIONS DENIED 8 $123,315 43 $125,445 397 $109,154 42 $23,626 0 $0 9 $101,940 APPLICATIONS WITHDRAWN 12 $125,702 33 $116,395 224 $110,744 3 $16,230 0 $0 14 $82,211 FILES CLOSED FOR INCOMPLETENESS 1 $91,300 7 $136,209 38 $164,019 0 $0 0 $0 0 $0
Aggregated Statistics For Year 2001(Based on 6 partial tracts) A) FHA, FSA/RHS & VA B) Conventional C) Refinancings D) Home Improvement Loans E) Loans on Dwellings For 5+ Families F) Non-occupant Loans on Number Average Value Number Average Value Number Average Value Number Average Value Number Average Value Number Average Value
LOANS ORIGINATED 94 $108,977 363 $142,061 1,064 $117,967 101 $20,418 2 $227,150 181 $72,887 APPLICATIONS APPROVED, NOT ACCEPTED 1 $39,050 21 $82,373 125 $95,944 20 $44,274 0 $0 4 $31,392 APPLICATIONS DENIED 15 $95,389 58 $107,177 410 $85,884 51 $22,218 0 $0 7 $75,796 APPLICATIONS WITHDRAWN 5 $99,826 21 $99,616 220 $101,137 14 $37,563 0 $0 12 $99,487 FILES CLOSED FOR INCOMPLETENESS 4 $88,768 6 $91,512 51 $125,752 4 $18,895 0 $0 0 $0
Aggregated Statistics For Year 2000(Based on 6 partial tracts) A) FHA, FSA/RHS & VA B) Conventional C) Refinancings D) Home Improvement Loans F) Non-occupant Loans on Number Average Value Number Average Value Number Average Value Number Average Value Number Average Value
LOANS ORIGINATED 142 $108,413 391 $126,676 414 $98,975 85 $20,783 110 $76,260 APPLICATIONS APPROVED, NOT ACCEPTED 1 $31,900 26 $109,718 64 $81,237 28 $18,208 2 $274,425 APPLICATIONS DENIED 8 $111,261 111 $85,948 238 $75,343 85 $22,193 17 $88,729 APPLICATIONS WITHDRAWN 5 $88,820 39 $144,527 152 $85,810 7 $41,616 1 $62,700 FILES CLOSED FOR INCOMPLETENESS 0 $0 13 $89,043 29 $78,115 0 $0 4 $99,192
Aggregated Statistics For Year 1999(Based on 3 partial tracts) A) FHA, FSA/RHS & VA B) Conventional C) Refinancings D) Home Improvement Loans F) Non-occupant Loans on Number Average Value Number Average Value Number Average Value Number Average Value Number Average Value
LOANS ORIGINATED 75 $91,584 222 $124,425 231 $89,442 40 $19,600 53 $65,039 APPLICATIONS APPROVED, NOT ACCEPTED 1 $141,050 25 $79,021 40 $71,384 9 $16,008 7 $111,013 APPLICATIONS DENIED 6 $82,383 39 $92,437 104 $72,058 37 $17,064 2 $89,550 APPLICATIONS WITHDRAWN 1 $103,180 26 $95,149 84 $73,467 9 $32,708 4 $83,635 FILES CLOSED FOR INCOMPLETENESS 0 $0 4 $171,850 10 $82,747 1 $52,640 0 $0
Detailed HMDA statistics for the following Tracts:
1101.00
,
1103.00 ,
1104.00 ,
1105.01
Private Mortgage Insurance Companies Aggregated Statistics For Year 2009(Based on 8 partial tracts) A) Conventional B) Refinancings C) Non-occupant Loans on Number Average Value Number Average Value Number Average Value
LOANS ORIGINATED 19 $169,054 33 $231,097 0 $0 APPLICATIONS APPROVED, NOT ACCEPTED 9 $240,762 9 $217,907 1 $169,950 APPLICATIONS DENIED 4 $244,660 10 $205,301 0 $0 APPLICATIONS WITHDRAWN 2 $293,545 2 $259,795 0 $0 FILES CLOSED FOR INCOMPLETENESS 0 $0 0 $0 0 $0
Aggregated Statistics For Year 2008(Based on 8 partial tracts) A) Conventional B) Refinancings C) Non-occupant Loans on Number Average Value Number Average Value Number Average Value
LOANS ORIGINATED 90 $208,730 68 $207,575 20 $126,153 APPLICATIONS APPROVED, NOT ACCEPTED 50 $205,054 20 $169,684 13 $143,608 APPLICATIONS DENIED 7 $267,366 10 $239,994 11 $213,040 APPLICATIONS WITHDRAWN 9 $216,382 8 $266,036 3 $140,313 FILES CLOSED FOR INCOMPLETENESS 2 $186,675 4 $181,092 5 $181,630
Aggregated Statistics For Year 2007(Based on 8 partial tracts) A) Conventional B) Refinancings C) Non-occupant Loans on Number Average Value Number Average Value Number Average Value
LOANS ORIGINATED 216 $176,111 90 $178,509 47 $169,765 APPLICATIONS APPROVED, NOT ACCEPTED 20 $198,616 18 $179,734 6 $202,623 APPLICATIONS DENIED 6 $207,910 0 $0 4 $216,922 APPLICATIONS WITHDRAWN 4 $213,120 4 $226,465 0 $0 FILES CLOSED FOR INCOMPLETENESS 1 $80,850 4 $109,422 1 $80,850
Aggregated Statistics For Year 2006(Based on 8 partial tracts) A) Conventional B) Refinancings C) Non-occupant Loans on Number Average Value Number Average Value Number Average Value
LOANS ORIGINATED 147 $166,926 46 $164,380 21 $156,554 APPLICATIONS APPROVED, NOT ACCEPTED 8 $186,948 8 $147,155 4 $158,825 APPLICATIONS DENIED 1 $71,500 1 $68,200 1 $71,500 APPLICATIONS WITHDRAWN 1 $68,200 2 $146,430 1 $68,200 FILES CLOSED FOR INCOMPLETENESS 2 $113,365 0 $0 0 $0
Aggregated Statistics For Year 2005(Based on 8 partial tracts) A) Conventional B) Refinancings C) Non-occupant Loans on D) Loans On Manufactured Number Average Value Number Average Value Number Average Value Number Average Value
LOANS ORIGINATED 86 $153,927 64 $171,948 7 $89,340 2 $144,540 APPLICATIONS APPROVED, NOT ACCEPTED 7 $207,270 20 $183,077 4 $144,218 0 $0 APPLICATIONS DENIED 2 $182,520 0 $0 2 $141,710 0 $0 APPLICATIONS WITHDRAWN 2 $169,595 7 $226,424 0 $0 0 $0 FILES CLOSED FOR INCOMPLETENESS 0 $0 6 $180,148 0 $0 0 $0
Aggregated Statistics For Year 2004(Based on 8 partial tracts) A) Conventional B) Refinancings C) Non-occupant Loans on Number Average Value Number Average Value Number Average Value
LOANS ORIGINATED 123 $143,046 210 $153,733 130 $136,447 APPLICATIONS APPROVED, NOT ACCEPTED 12 $155,005 28 $157,890 3 $158,957 APPLICATIONS DENIED 2 $101,545 2 $178,285 2 $163,430 APPLICATIONS WITHDRAWN 10 $135,144 10 $219,052 2 $144,120 FILES CLOSED FOR INCOMPLETENESS 0 $0 1 $39,600 1 $39,600
Aggregated Statistics For Year 2003(Based on 8 partial tracts) A) Conventional B) Refinancings C) Non-occupant Loans on Number Average Value Number Average Value Number Average Value
LOANS ORIGINATED 114 $171,655 222 $148,258 26 $105,787 APPLICATIONS APPROVED, NOT ACCEPTED 17 $175,849 30 $142,182 8 $110,940 APPLICATIONS DENIED 2 $121,730 4 $186,355 2 $79,825 APPLICATIONS WITHDRAWN 17 $258,263 11 $125,544 0 $0 FILES CLOSED FOR INCOMPLETENESS 0 $0 0 $0 0 $0
Aggregated Statistics For Year 2002(Based on 6 partial tracts) A) Conventional B) Refinancings C) Non-occupant Loans on Number Average Value Number Average Value Number Average Value
LOANS ORIGINATED 125 $167,378 120 $132,234 24 $115,423 APPLICATIONS APPROVED, NOT ACCEPTED 14 $157,289 9 $129,860 4 $140,145 APPLICATIONS DENIED 2 $236,570 6 $125,820 2 $170,685 APPLICATIONS WITHDRAWN 2 $110,320 7 $159,064 2 $106,730 FILES CLOSED FOR INCOMPLETENESS 0 $0 0 $0 0 $0
Aggregated Statistics For Year 2001(Based on 6 partial tracts) A) Conventional B) Refinancings C) Non-occupant Loans on Number Average Value Number Average Value Number Average Value
LOANS ORIGINATED 80 $154,274 106 $146,626 15 $91,684 APPLICATIONS APPROVED, NOT ACCEPTED 5 $150,310 10 $192,416 0 $0 APPLICATIONS DENIED 2 $120,175 0 $0 1 $126,500 APPLICATIONS WITHDRAWN 2 $99,000 2 $238,065 1 $69,300 FILES CLOSED FOR INCOMPLETENESS 1 $68,200 4 $128,625 1 $68,200
Aggregated Statistics For Year 2000(Based on 6 partial tracts) A) Conventional B) Refinancings C) Non-occupant Loans on Number Average Value Number Average Value Number Average Value
LOANS ORIGINATED 124 $155,421 42 $134,222 5 $82,090 APPLICATIONS APPROVED, NOT ACCEPTED 7 $202,519 5 $114,250 1 $26,400 APPLICATIONS DENIED 2 $157,275 4 $66,602 1 $171,050 APPLICATIONS WITHDRAWN 3 $198,600 2 $75,575 0 $0 FILES CLOSED FOR INCOMPLETENESS 0 $0 0 $0 0 $0
Aggregated Statistics For Year 1999(Based on 3 partial tracts) A) Conventional B) Refinancings C) Non-occupant Loans on Number Average Value Number Average Value Number Average Value
LOANS ORIGINATED 69 $137,333 25 $120,550 6 $83,797 APPLICATIONS APPROVED, NOT ACCEPTED 5 $128,586 3 $86,793 0 $0 APPLICATIONS DENIED 1 $47,350 2 $110,275 0 $0 APPLICATIONS WITHDRAWN 0 $0 2 $45,780 0 $0 FILES CLOSED FOR INCOMPLETENESS 0 $0 0 $0 0 $0
Detailed PMIC statistics for the following Tracts:
1101.00
,
1103.00 ,
1104.00 ,
1105.01
2007 - 2018 National Fire Incident Reporting System (NFIRS) incidents See full 2006 National Fire Incident Reporting System statistics for zip code 30656, Georgia
Most common first names in zip code 30656 among deceased individuals Name Count Lived (average)
William 23 71.1 years Mary 21 79.4 years James 21 70.7 years Charles 13 73.3 years Annie 12 84.5 years Dorothy 12 75.4 years Robert 11 74.3 years Betty 10 68.8 years John 10 76.1 years Thomas 10 75.2 years
Most common last names in zip code 30656 among deceased individuals Last name Count Lived (average)
Smith 18 76.6 years Mitchell 12 72.9 years Jones 11 76.5 years Mobley 10 69.8 years Davis 9 75.0 years Johnson 8 77.2 years Thompson 7 81.4 years Hall 6 67.6 years Rowe 6 70.0 years Martin 6 91.0 years
Businesses in zip code 30656
Little Caesars Pizza: 1U-Haul: 1Waffle House: 1

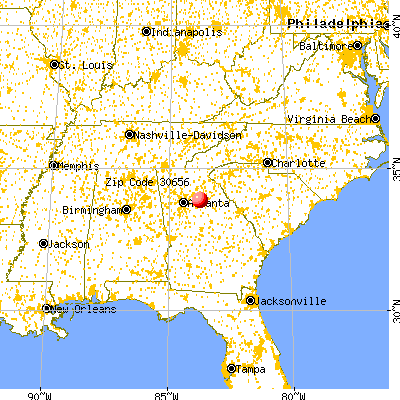


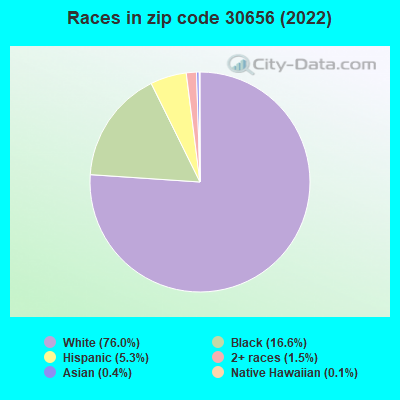


 Nearest zip codes: 30620, 30655, 30680, 30641, 30666, 30052.
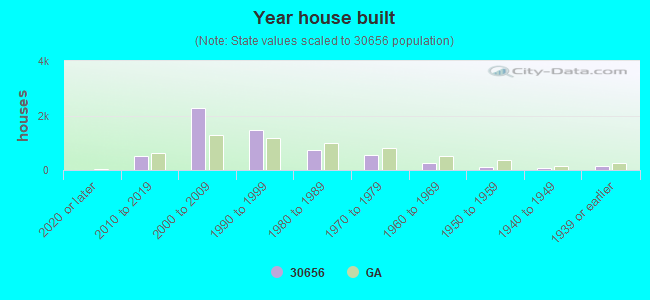

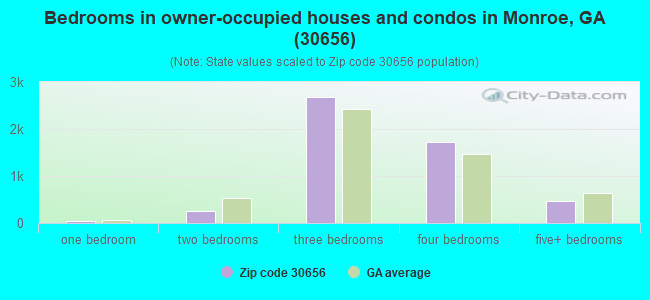
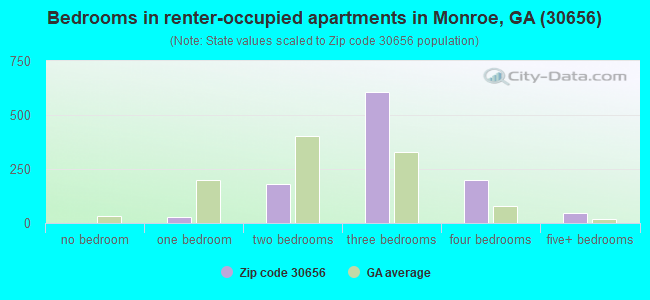
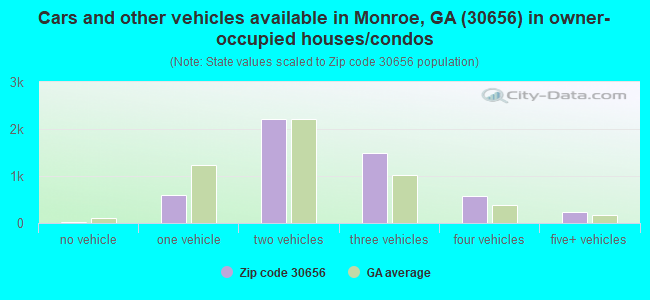
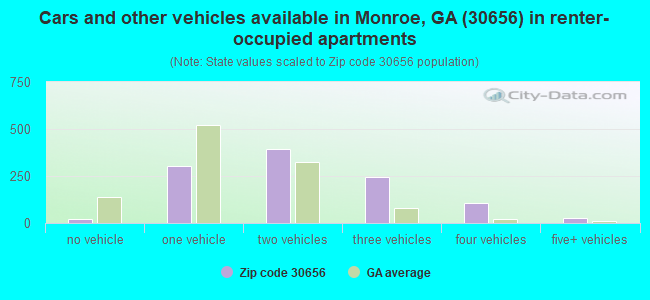


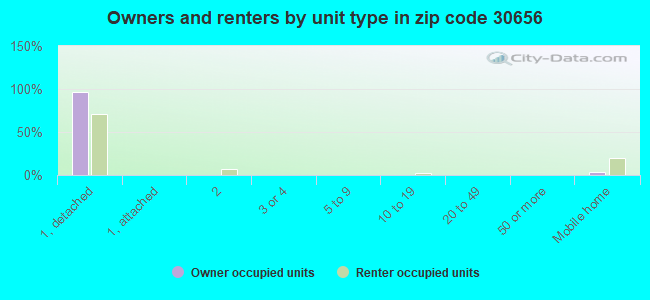
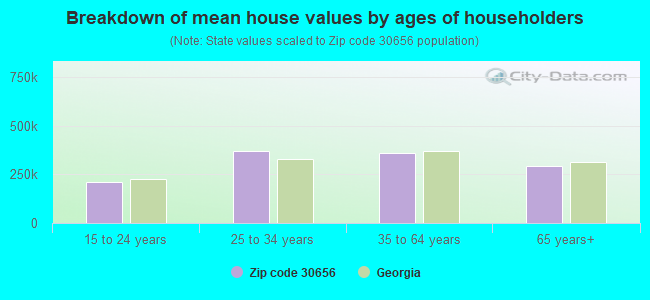


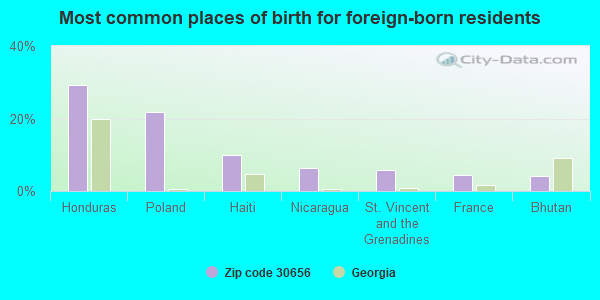
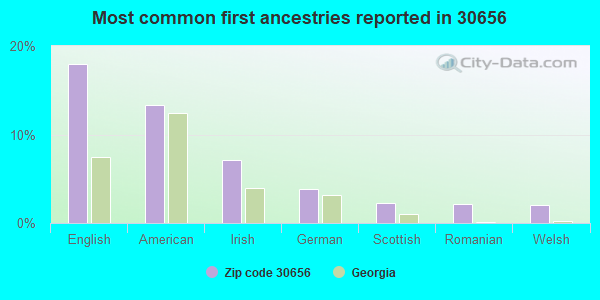
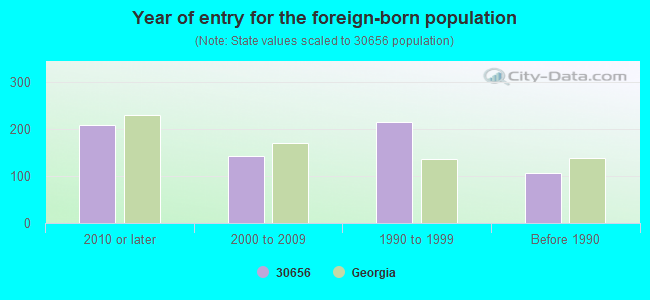


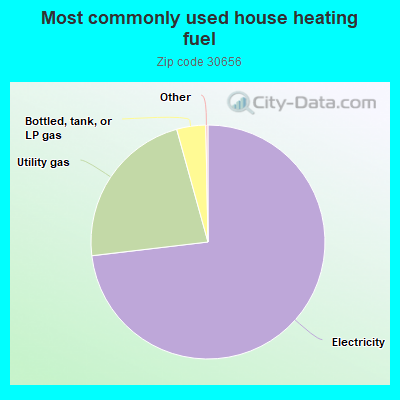
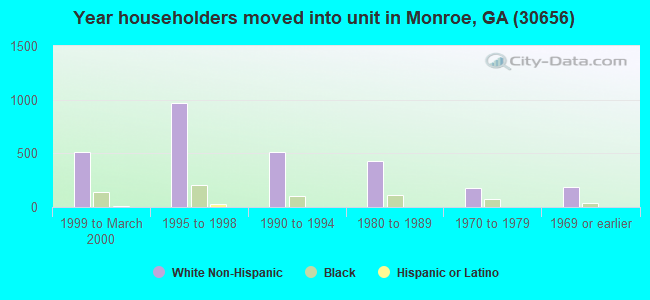
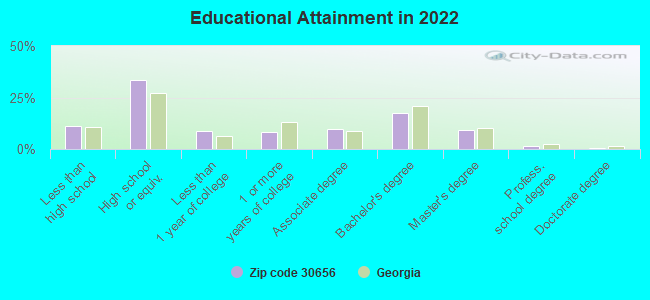
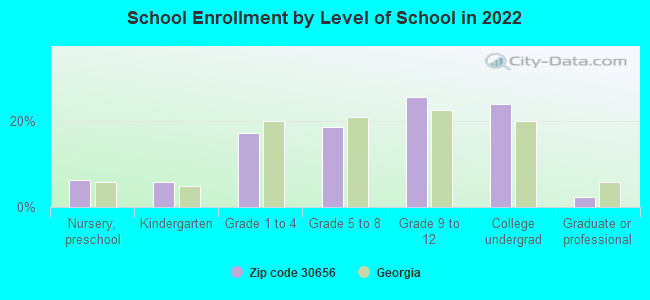
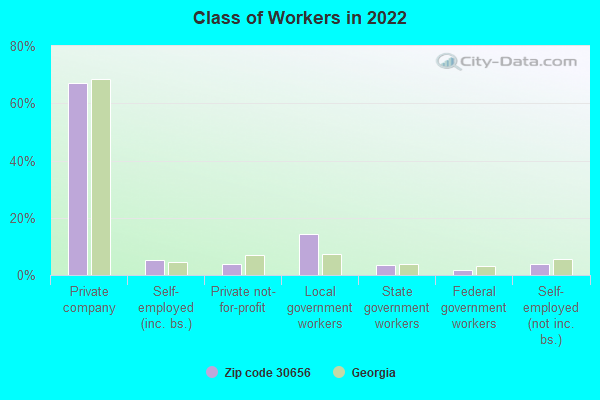
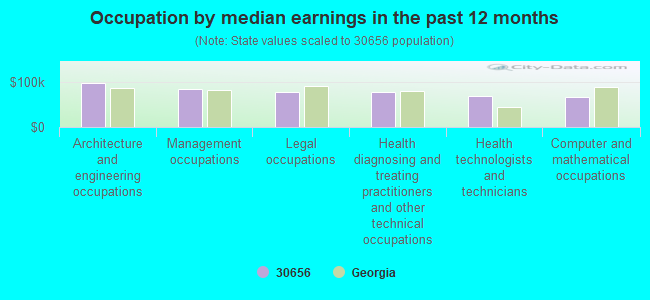
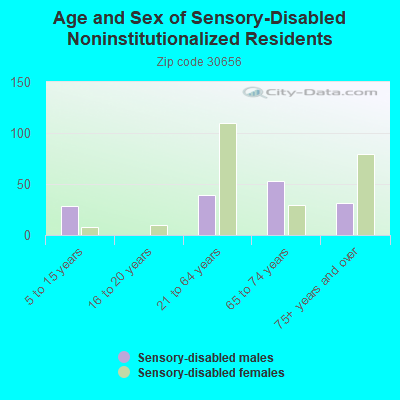
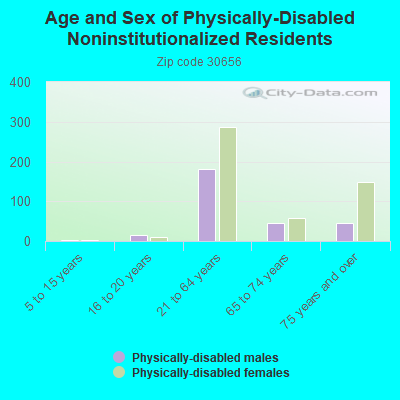
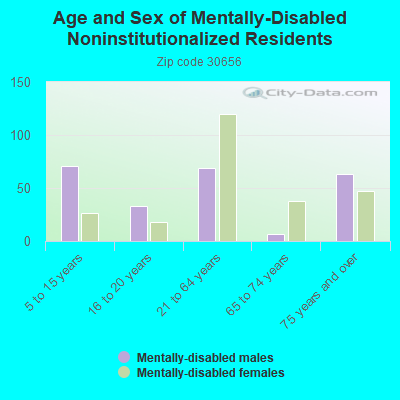
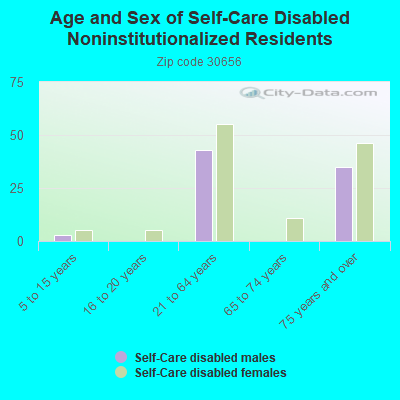
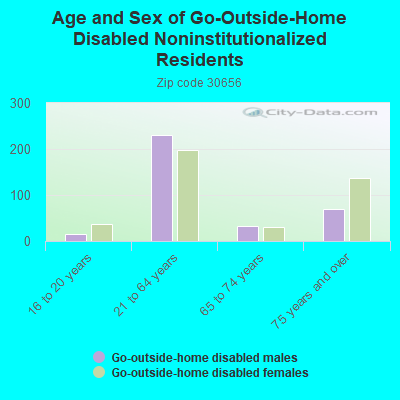
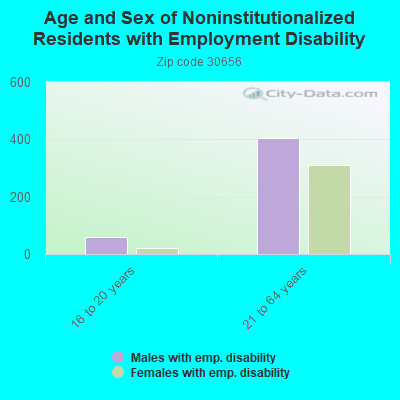
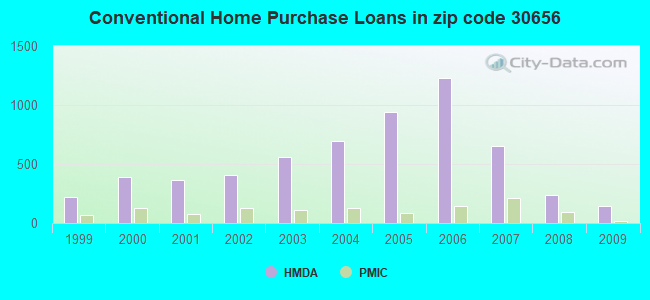
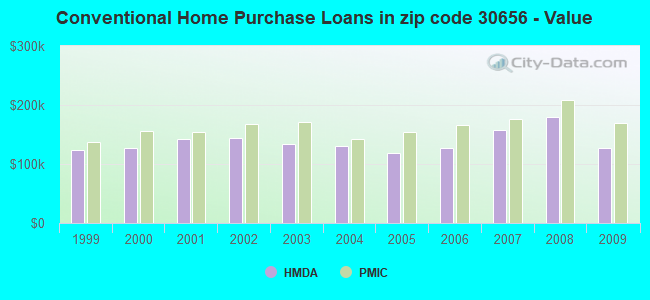
 Based on the data from the years 2007 - 2018 the average number of fire incidents per year is 48. The highest number of reported fires - 87 took place in 2008, and the least - 13 in 2018. The data has a dropping trend.
 When looking into fire subcategories, the most reports belonged to: Outside Fires (49.3%), and Structure Fires (40.5%).