Estimated zip code population in 2022: 1,709 Zip code population in 2010: 2,541 Zip code population in 2000: 3,198
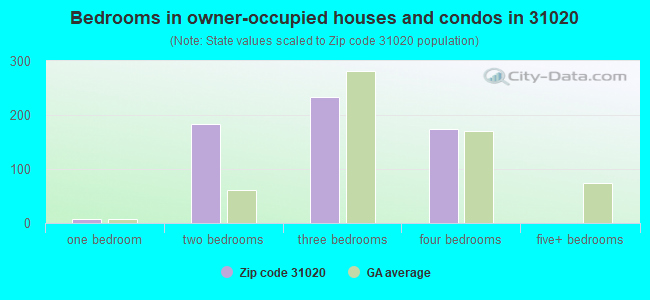
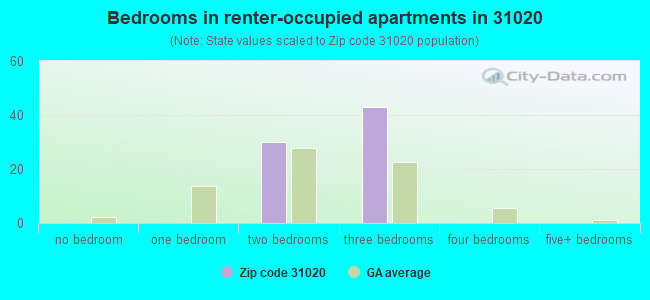
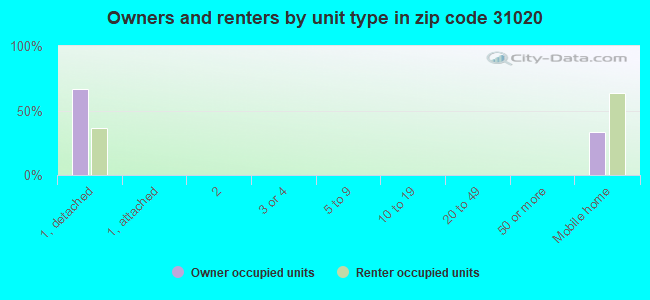
Houses and condos: 958 Renter-occupied apartments: 71
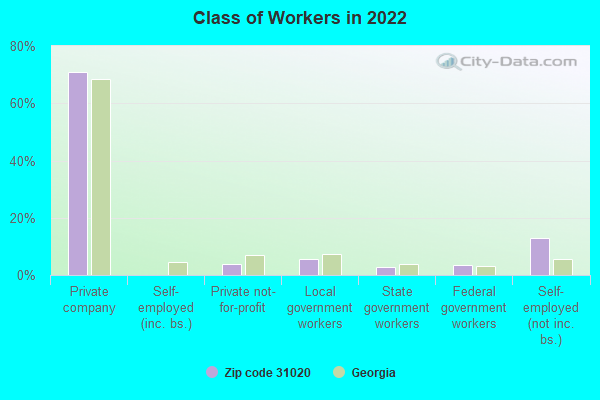
% of renters here:
11%
State:
34%
March 2022 cost of living index in zip code 31020: 80.4 (low, U.S. average is 100)
Land area: 106.9 sq. mi. Water area: 2.5 sq. mi.
Population density: 16 people per square mile
(very low).
OSM Map
General Map
Google Map
MSN Map
OSM Map
General Map
Google Map
MSN Map
OSM Map
General Map
Google Map
MSN Map
OSM Map
General Map
Google Map
MSN Map
Please wait while loading the map...
Real estate property taxes paid for housing units in 2022:
This zip code:
1.0% ($1,146)
Georgia:
0.7% ($2,160)
Median real estate property taxes paid for housing units with mortgages in 2022: $1,470 Median real estate property taxes paid for housing units with no mortgage in 2022: $909
Business Search- 14 Million verified businesses
Males: 922
(54.0%)
Females: 786
(46.0%)
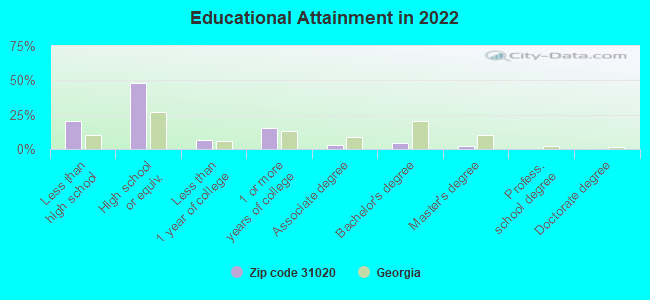
For population 25 years and over in 31020:
High school or higher: 77.5%
Bachelor's degree or higher: 6.7%
Graduate or professional degree: 2.5%
Unemployed: 2.8%
Mean travel time to work (commute): 36.9 minutes
For population 15 years and over in 31020:
Never married: 31.2%
Now married: 41.5%
Separated: 1.6%
Widowed: 6.3%
Divorced: 19.4%
Zip code 31020 compared to state average:
Median household income below state average.
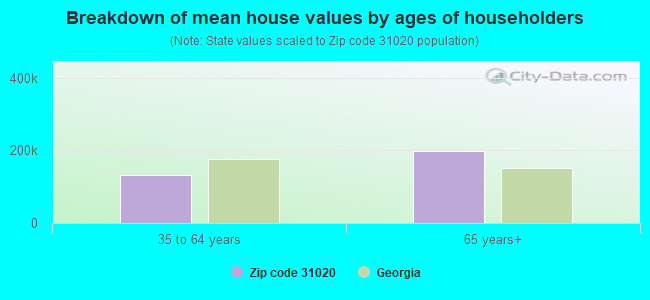
Median house value significantly below state average.
Hispanic race population percentage significantly below state average.
Median age significantly above state average.
Foreign-born population percentage significantly below state average.
Renting percentage significantly below state average.
Length of stay since moving in significantly above state average.
Number of college students significantly below state average.
Percentage of population with a bachelor's degree or higher significantly below state average.
Averages for the 2020 tax year for zip code 31020, filed in 2021:
Average Adjusted Gross Income (AGI) in 2020: $40,407 (Individual Income Tax Returns)
Here:
$40,407
State:
$70,847
Salary/wage: $37,539 (reported on 81.4% of returns)
Here:
$37,539
State:
$59,126
(% of AGI for various income ranges: 1292.4% for AGIs below $25k, 3487.4% for AGIs $25k-50k, 5820.0% for AGIs $50k-75k, 8190.0% for AGIs $75k-100k, 25875.0% for AGIs $100k-200k)
Taxable interest for individuals: $292 (reported on 15.1% of returns)
This zip code:
$292
Georgia:
$2,011
(% of AGI for various income ranges: 2.4% for AGIs below $25k, 3.0% for AGIs $25k-50k, 5.6% for AGIs $50k-75k, 20.0% for AGIs $75k-100k, 45.0% for AGIs $100k-200k)
Ordinary dividends: $525 (reported on 4.7% of returns)
Here:
$525
State:
$8,996
(% of AGI for various income ranges: 9.1% for AGIs $25k-50k)
Net capital gain/loss in AGI: +$2,250 (reported on 4.7% of returns)
Here:
+$2,250
State:
+$28,402
(% of AGI for various income ranges: 39.1% for AGIs $25k-50k)
Profit/loss from business: +$605 (reported on 23.3% of returns)
Here:
+$605
State:
+$6,707
(% of AGI for various income ranges: 42.2% for AGIs $50k-75k, 850.0% for AGIs $75k-100k)
Taxable individual retirement arrangement distribution: $9,325 (reported on 4.7% of returns)
31020:
$9,325
Georgia:
$20,525
(% of AGI for various income ranges: 162.2% for AGIs $25k-50k)
Total itemized deductions: $24,650 (reported on 7.0% of returns)
Here:
$24,650
State:
$34,001
(% of AGI for various income ranges: 396.1% for AGIs $25k-50k, 1136.0% for AGIs $75k-100k)
Charity contributions: $8,967 (reported on 7.0% of returns)
Here:
$8,967
State:
$14,164
(% of AGI for various income ranges: 125.2% for AGIs $25k-50k, 500.0% for AGIs $75k-100k)
Taxes paid: $5,517 (reported on 7.0% of returns)
31020:
$5,517
State:
$7,540
(% of AGI for various income ranges: 63.5% for AGIs $25k-50k, 370.0% for AGIs $75k-100k)
Earned income credit: $2,468 (reported on 29.1% of returns)
Here:
$2,468
State:
$2,530
(% of AGI for various income ranges: 147.9% for AGIs below $25k, 81.7% for AGIs $25k-50k)
Percentage of individuals using paid preparers for their 2020 taxes: 94.2%
Here:
94%
State:
93%
(% for various income ranges: 94.3% for AGIs below $25k, 96.4% for AGIs $25k-50k, 90.9% for AGIs $50k-75k, 85.7% for AGIs $75k-100k, 100.0% for AGIs $100k-200k)
Averages for the 2012 tax year for zip code 31020, filed in 2013:
Average Adjusted Gross Income (AGI) in 2012: $32,196 (Individual Income Tax Returns)
Here:
$32,196
State:
$56,131
Salary/wage: $30,189 (reported on 82.4% of returns)
Here:
$30,189
State:
$47,942
(% of AGI for various income ranges: 79.9% for AGIs below $25k, 83.0% for AGIs $25k-50k, 73.1% for AGIs $50k-75k, 70.3% for AGIs $75k-100k, 73.0% for AGIs $100k-200k)
Taxable interest for individuals: $360 (reported on 16.5% of returns)
This zip code:
$360
Georgia:
$1,706
(% of AGI for various income ranges: 0.1% for AGIs below $25k, 0.2% for AGIs $25k-50k, 0.2% for AGIs $50k-75k, 0.4% for AGIs $75k-100k)
Ordinary dividends: $600 (reported on 4.4% of returns)
Here:
$600
State:
$7,265
Profit/loss from business: +$2,147 (reported on 16.5% of returns)
Here:
+$2,147
State:
+$7,583
(% of AGI for various income ranges: 4.7% for AGIs below $25k, 2.1% for AGIs $50k-75k)
Taxable individual retirement arrangement distribution: $12,820 (reported on 5.5% of returns)
31020:
$12,820
Georgia:
$17,199
(% of AGI for various income ranges: 3.7% for AGIs below $25k, 6.2% for AGIs $50k-75k)
Total itemized deductions: $17,084 (32% of AGI, reported on 27.5% of returns)
Here:
$17,084
State:
$23,886
Here:
32.4% of AGI
State:
21.5% of AGI
(% of AGI for various income ranges: 8.0% for AGIs below $25k, 16.5% for AGIs $25k-50k, 13.3% for AGIs $50k-75k, 19.6% for AGIs $75k-100k, 18.5% for AGIs $100k-200k)
Charity contributions: $4,391 (reported on 24.2% of returns)
Here:
$4,391
State:
$5,507
(% of AGI for various income ranges: 1.4% for AGIs below $25k, 3.7% for AGIs $25k-50k, 3.2% for AGIs $50k-75k, 5.1% for AGIs $75k-100k, 3.9% for AGIs $100k-200k)
Taxes paid: $4,152 (reported on 27.5% of returns)
31020:
$4,152
State:
$7,838
(% of AGI for various income ranges: 1.4% for AGIs below $25k, 3.2% for AGIs $25k-50k, 3.6% for AGIs $50k-75k, 5.5% for AGIs $75k-100k, 6.2% for AGIs $100k-200k)
Earned income credit: $2,456 (reported on 35.2% of returns)
Here:
$2,456
State:
$2,589
(% of AGI for various income ranges: 10.3% for AGIs below $25k, 1.5% for AGIs $25k-50k)
Percentage of individuals using paid preparers for their 2012 taxes: 53.8%
Here:
54%
State:
55%
(% for various income ranges: 52.2% for AGIs below $25k, 53.8% for AGIs $25k-50k, 63.6% for AGIs $50k-75k, 80.0% for AGIs $75k-100k)
Averages for the 2004 tax year for zip code 31020, filed in 2005:
Average Adjusted Gross Income (AGI) in 2004: $28,747 (Individual Income Tax Returns)
Here:
$28,747
State:
$47,553
Salary/wage: $27,265 (reported on 88.4% of returns)
Here:
$27,265
State:
$42,178
(% of AGI for various income ranges: 111.7% for AGIs below $10k, 84.7% for AGIs $10k-25k, 85.9% for AGIs $25k-50k, 83.1% for AGIs $50k-75k, 79.6% for AGIs $75k-100k, 73.4% for AGIs over 100k)
Taxable interest for individuals: $577 (reported on 19.5% of returns)
This zip code:
$577
Georgia:
$1,772
(% of AGI for various income ranges: 2.0% for AGIs below $10k, 0.6% for AGIs $10k-25k, 0.3% for AGIs $25k-50k, 0.3% for AGIs $50k-75k, 0.1% for AGIs $75k-100k, 0.1% for AGIs over 100k)
Taxable dividends: $431 (reported on 7.2% of returns)
Here:
$431
State:
$4,283
(% of AGI for various income ranges: 0.2% for AGIs $10k-25k, 0.1% for AGIs $25k-50k, 0.2% for AGIs $50k-75k, 0.1% for AGIs $75k-100k)
Profit/loss from business: +$785 (reported on 10.7% of returns)
Here:
+$785
State:
+$8,201
(% of AGI for various income ranges: 5.9% for AGIs below $10k, 1.4% for AGIs $10k-25k, 0.4% for AGIs $25k-50k, -0.7% for AGIs $50k-75k, -1.0% for AGIs $75k-100k)
IRA payment deduction: $1,167 (reported on 1.2% of returns)
31020:
$1,167
Georgia:
$2,969
Total itemized deductions: $14,455 (28% of AGI, reported on 24.3% of returns)
Here:
$14,455
State:
$19,944
Here:
27.8% of AGI
State:
22.6% of AGI
(% of AGI for various income ranges: 7.7% for AGIs $10k-25k, 12.5% for AGIs $25k-50k, 14.1% for AGIs $50k-75k, 16.3% for AGIs $75k-100k, 15.2% for AGIs over 100k)
Charity contributions deductions: $3,657 (7% of AGI, reported on 21.7% of returns)
Here:
$3,657
State:
$4,354
Here:
6.9% of AGI
State:
4.7% of AGI
(% of AGI for various income ranges: 1.4% for AGIs $10k-25k, 2.8% for AGIs $25k-50k, 3.2% for AGIs $50k-75k, 3.8% for AGIs $75k-100k, 4.5% for AGIs over 100k)
Total tax: $3,514 (reported on 57.6% of returns)
31020:
$3,514
State:
$8,223
(% of AGI for various income ranges: 2.1% for AGIs below $10k, 2.2% for AGIs $10k-25k, 6.0% for AGIs $25k-50k, 8.8% for AGIs $50k-75k, 10.1% for AGIs $75k-100k, 15.3% for AGIs over 100k)
Earned income credit: $2,146 (reported on 35.7% of returns)
Here:
$2,146
State:
$1,986
Percentage of individuals using paid preparers for their 2004 taxes: 63.1%
Here:
63%
State:
62%
(% for various income ranges: 55.3% for AGIs below $10k, 65.8% for AGIs $10k-25k, 64.2% for AGIs $25k-50k, 59.6% for AGIs $50k-75k, 73.8% for AGIs $75k-100k, 73.7% for AGIs over 100k)
Churches in zip code 31020 include: Antioch Church (A), D D Memorial Church (B), Dry Branch Church (C), First Congregational Holiness Church (D), Bethlehem Church (E), Old Marion Church (F), Greater New Hope Church (G), Lar Grove Church (H), Mount Gilgal Church (I). Display/hide their locations on the map
Cemeteries: Land Cemetery (1), Laurel Grove Cemetery (2), Andrews Cemetery (3), Antioch Cemetery (4), Beckham Cemetery (5), Beech Spring Cemetery (6), Burkett Cemetery (7). Display/hide their locations on the map
Lakes, reservoirs, and swamps: Big Eddy (A), Dove Pond (B), Eel Hole (C), Jack Hole (D), Jolly Pond (E), Lanier Lake (F), Mallory Lake (G), Denson Marsh (H). Display/hide their locations on the map
Streams, rivers, and creeks: Streetman Creek (A), Stone Creek (B), Horse Creek (C), Sandy Run Creek (D), Hall Branch (E), Rosston Creek (F), Dry Branch Creek (G), Donnan Branch (H), Camp Creek (I). Display/hide their locations on the map
Size of family households: 179 2-persons, 151 3-persons, 15 4-persons, 17 5-persons, 52 6-persons
Size of nonfamily households: 240 1-person, 15 3-persons
119 married couples with children.
104 single-parent households (104 women).
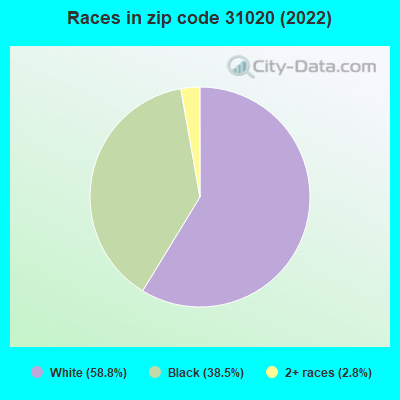
99.8% of residents of 31020 zip code speak English at home.
Foreign born population: 0 (0.0%)
:
0.0%
Whole state:
10.7%
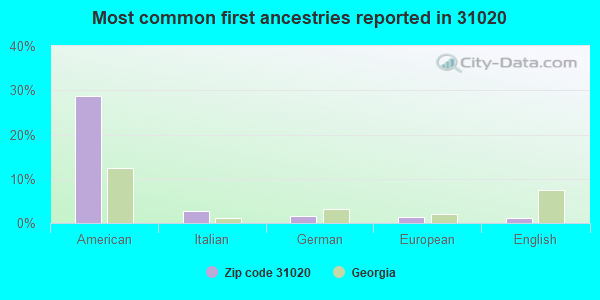
29%American
3%Italian
2%German
1%European
1%English
Facilities with environmental interests located in this zip code:
NATIONAL TREE SEED LAB USFS (RIGGINS MILL ROAD in DRY BRANCH, GA) . Federal Facility. FOREST SERVICE
(Resource Conservation and Recovery Act (tracking hazardous waste)) Organizations: OPERNAME (CONTACT/OPERATOR)
, GEORGIA FORESTRY COMMISSION (CONTACT/OWNER)
, US FOREST SERVICE JIM HOLBROOK (CONTACT/OWNER)
Housing units lacking complete plumbing facilities: 6.3% Housing units lacking complete kitchen facilities: 6.2%
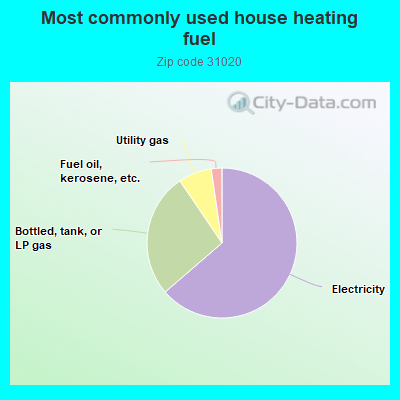
63.8%Electricity
26.9%Bottled, tank, or LP gas
7.2%Utility gas
2.3%Fuel oil, kerosene, etc.
Population in 1990: 3,702.
Place of birth for U.S.-born residents:
This state: 1,469
Northeast: 43
Midwest: 61
South: 96
West: 20
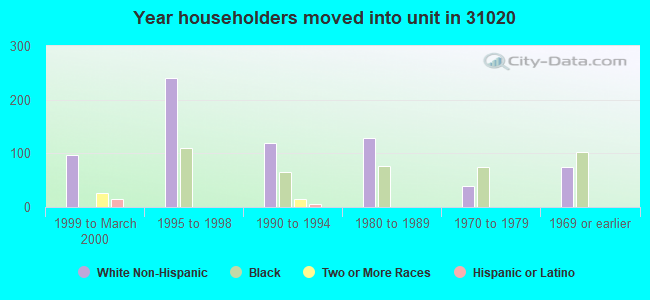
62% of the 31020 zip code residents lived in the same house 5 years ago. Out of people who lived in different houses, 36% lived in this county. Out of people who lived in different counties, 50% lived in Georgia.
94% of the 31020 zip code residents lived in the same house 1 year ago. Out of people who lived in different houses, 11% moved from this county. Out of people who lived in different houses, 89% moved from different county within same state.
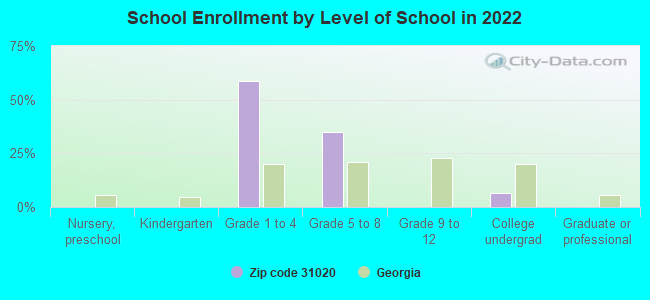
Private vs. public school enrollment:
Students in private schools in grades 1 to 8 (elementary and middle school):
Here:
0.0%
Georgia:
12.1%
Students in private undergraduate colleges:
Here:
0.0%
Georgia:
17.1%
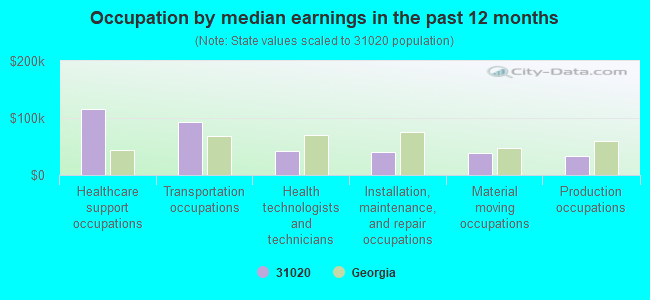
Occupation by median earnings in the past 12 months ($)
116,583Healthcare support occupations
93,833Transportation occupations
42,796Health technologists and technicians
39,887Installation, maintenance, and repair occupations
38,839Material moving occupations
32,470Production occupations
Companies with federal contracts located in this zip code:
GRANDE ARREDO SPA (VIA BELTRAMINI 22 in SAN ZENONE DEGLI EZZ, ) 230 employees, $400000000000 revenue: $8,577 in 2 contractsfrom 2005 to 2006
$5,858 with Department of State for Household Furniture. Taking place in VA. Signed on 2006-01-04. Effective on 2005-12-28. Completion date: 2006-04-29.
$2,719 with Department of State for Household Furniture. Taking place in MD. Signed on 2005-12-28. Completion date: 2006-03-31.
Top industries in this zip code by the number of employees in 2005:
Mining: Kaolin and Ball Clay Mining (100-249 employees: 1 establishment)
Accommodation and Food Services: Limited-Service Restaurants (10-19: 1)
Construction: Highway, Street, and Bridge Construction (10-19: 1)
Health Care and Social Assistance: Child Day Care Services (10-19: 1)
Other Services (except Public Administration): Religious Organizations (5-9: 1, 1-4: 1)
Construction: Site Preparation Contractors (5-9: 1)
Other Services (except Public Administration): Commercial and Industrial Machinery and Equipment (except Automotive and Electronic) Repair and Maintenance (5-9: 1)
Administrative and Support and Waste Management and Remediation Services: Landscaping Services (5-9: 1)
Fatal accident statistics in 2014:
Fatal accident count: 2
Vehicles involved in fatal accidents: 3
Fatal accidents caused by drunken drivers: 1
Fatalities: 2
Persons involved in fatal accidents: 4
Pedestrians involved in fatal accidents: 0
Fatal accident statistics in 2012:
Fatal accident count: 1
Vehicles involved in fatal accidents: 1
Fatal accidents caused by drunken drivers: 0
Fatalities: 2
Persons involved in fatal accidents: 5
Pedestrians involved in fatal accidents: 0
Home Mortgage Disclosure Act Aggregated Statistics For Year 2009 (Based on 4 partial tracts)
A) FHA, FSA/RHS & VA Home Purchase Loans
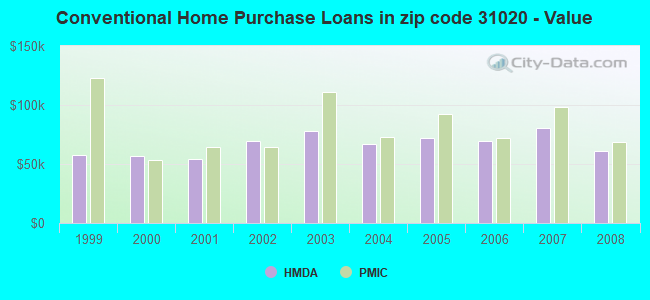
B) Conventional Home Purchase Loans
C) Refinancings
D) Home Improvement Loans
F) Non-occupant Loans on < 5 Family Dwellings (A B C & D)
G) Loans On Manufactured Home Dwelling (A B C & D)
Number
Average Value
Number
Average Value
Number
Average Value
Number
Average Value
Number
Average Value
Number
Average Value
LOANS ORIGINATED
9
$110,420
0
$0
12
$95,648
1
$18,670
3
$111,067
0
$0
APPLICATIONS APPROVED, NOT ACCEPTED
0
$0
1
$73,670
2
$90,265
0
$0
0
$0
0
$0
APPLICATIONS DENIED
1
$167,350
2
$31,680
17
$96,602
5
$52,848
1
$76,650
1
$125,080
APPLICATIONS WITHDRAWN
1
$136,550
1
$66,920
8
$75,882
0
$0
1
$51,580
0
$0
FILES CLOSED FOR INCOMPLETENESS
0
$0
0
$0
1
$36,350
0
$0
0
$0
0
$0
Aggregated Statistics For Year 2008 (Based on 4 partial tracts)
A) FHA, FSA/RHS & VA Home Purchase Loans
B) Conventional Home Purchase Loans
C) Refinancings
D) Home Improvement Loans
F) Non-occupant Loans on < 5 Family Dwellings (A B C & D)
G) Loans On Manufactured Home Dwelling (A B C & D)
Number
Average Value
Number
Average Value
Number
Average Value
Number
Average Value
Number
Average Value
Number
Average Value
LOANS ORIGINATED
23
$132,027
8
$61,015
29
$74,754
3
$43,063
15
$57,387
1
$93,670
APPLICATIONS APPROVED, NOT ACCEPTED
0
$0
0
$0
5
$55,466
0
$0
0
$0
0
$0
APPLICATIONS DENIED
2
$56,490
2
$84,980
29
$84,935
10
$45,065
5
$55,982
1
$14,920
APPLICATIONS WITHDRAWN
3
$132,460
1
$156,690
11
$85,975
1
$25,050
2
$36,430
1
$89,400
FILES CLOSED FOR INCOMPLETENESS
0
$0
0
$0
0
$0
0
$0
0
$0
0
$0
Aggregated Statistics For Year 2007 (Based on 4 partial tracts)
A) FHA, FSA/RHS & VA Home Purchase Loans
B) Conventional Home Purchase Loans
C) Refinancings
D) Home Improvement Loans
F) Non-occupant Loans on < 5 Family Dwellings (A B C & D)
G) Loans On Manufactured Home Dwelling (A B C & D)
Number
Average Value
Number
Average Value
Number
Average Value
Number
Average Value
Number
Average Value
Number
Average Value
LOANS ORIGINATED
6
$140,565
19
$80,758
40
$66,020
5
$38,664
13
$50,123
1
$26,030
APPLICATIONS APPROVED, NOT ACCEPTED
0
$0
3
$89,890
8
$64,331
1
$40,770
3
$47,647
0
$0
APPLICATIONS DENIED
3
$108,720
18
$75,745
59
$85,438
13
$36,998
8
$60,479
3
$40,607
APPLICATIONS WITHDRAWN
0
$0
2
$62,145
24
$92,873
1
$62,380
4
$72,332
0
$0
FILES CLOSED FOR INCOMPLETENESS
0
$0
1
$121,330
6
$99,317
0
$0
0
$0
0
$0
Aggregated Statistics For Year 2006 (Based on 4 partial tracts)
A) FHA, FSA/RHS & VA Home Purchase Loans
B) Conventional Home Purchase Loans
C) Refinancings
D) Home Improvement Loans
F) Non-occupant Loans on < 5 Family Dwellings (A B C & D)
G) Loans On Manufactured Home Dwelling (A B C & D)
Number
Average Value
Number
Average Value
Number
Average Value
Number
Average Value
Number
Average Value
Number
Average Value
LOANS ORIGINATED
8
$94,880
39
$69,271
36
$84,403
10
$32,752
18
$54,608
3
$59,773
APPLICATIONS APPROVED, NOT ACCEPTED
0
$0
11
$81,898
9
$65,604
1
$40,390
1
$42,730
0
$0
APPLICATIONS DENIED
1
$112,480
20
$95,580
63
$80,699
15
$36,770
6
$62,703
0
$0
APPLICATIONS WITHDRAWN
0
$0
7
$58,551
28
$89,238
2
$41,195
3
$69,587
0
$0
FILES CLOSED FOR INCOMPLETENESS
0
$0
3
$65,907
5
$75,756
0
$0
0
$0
0
$0
Aggregated Statistics For Year 2005 (Based on 4 partial tracts)
A) FHA, FSA/RHS & VA Home Purchase Loans
B) Conventional Home Purchase Loans
C) Refinancings
D) Home Improvement Loans
F) Non-occupant Loans on < 5 Family Dwellings (A B C & D)
G) Loans On Manufactured Home Dwelling (A B C & D)
Number
Average Value
Number
Average Value
Number
Average Value
Number
Average Value
Number
Average Value
Number
Average Value
LOANS ORIGINATED
4
$86,315
40
$71,983
39
$69,326
6
$33,077
15
$45,122
2
$51,120
APPLICATIONS APPROVED, NOT ACCEPTED
0
$0
8
$84,935
14
$74,011
3
$33,133
1
$62,870
0
$0
APPLICATIONS DENIED
0
$0
19
$66,231
54
$75,464
9
$38,680
4
$72,285
4
$55,392
APPLICATIONS WITHDRAWN
1
$71,580
8
$82,498
24
$91,233
3
$80,883
3
$64,757
1
$97,260
FILES CLOSED FOR INCOMPLETENESS
1
$83,500
2
$71,235
4
$69,842
0
$0
2
$39,325
1
$79,080
Aggregated Statistics For Year 2004 (Based on 4 partial tracts)
A) FHA, FSA/RHS & VA Home Purchase Loans
B) Conventional Home Purchase Loans
C) Refinancings
D) Home Improvement Loans
F) Non-occupant Loans on < 5 Family Dwellings (A B C & D)
G) Loans On Manufactured Home Dwelling (A B C & D)
Number
Average Value
Number
Average Value
Number
Average Value
Number
Average Value
Number
Average Value
Number
Average Value
LOANS ORIGINATED
3
$64,310
21
$67,000
36
$66,824
5
$49,532
18
$53,355
1
$56,110
APPLICATIONS APPROVED, NOT ACCEPTED
0
$0
6
$75,317
20
$65,388
3
$17,823
4
$54,522
1
$99,220
APPLICATIONS DENIED
0
$0
14
$61,953
68
$71,650
10
$22,378
5
$44,600
6
$49,877
APPLICATIONS WITHDRAWN
0
$0
4
$58,390
28
$83,195
2
$19,290
4
$35,068
2
$44,550
FILES CLOSED FOR INCOMPLETENESS
1
$89,890
2
$83,850
5
$118,280
0
$0
0
$0
1
$98,730
Aggregated Statistics For Year 2003 (Based on 4 partial tracts)
A) FHA, FSA/RHS & VA Home Purchase Loans
B) Conventional Home Purchase Loans
C) Refinancings
D) Home Improvement Loans
F) Non-occupant Loans on < 5 Family Dwellings (A B C & D)
Number
Average Value
Number
Average Value
Number
Average Value
Number
Average Value
Number
Average Value
LOANS ORIGINATED
7
$93,329
25
$78,352
52
$67,508
4
$21,758
15
$51,113
APPLICATIONS APPROVED, NOT ACCEPTED
0
$0
4
$93,360
11
$67,245
0
$0
1
$54,170
APPLICATIONS DENIED
2
$84,010
14
$74,475
49
$70,257
6
$26,853
6
$53,082
APPLICATIONS WITHDRAWN
1
$92,450
3
$78,100
14
$67,001
0
$0
2
$38,315
FILES CLOSED FOR INCOMPLETENESS
0
$0
3
$55,977
3
$126,710
0
$0
1
$65,330
Aggregated Statistics For Year 2002 (Based on 4 partial tracts)
A) FHA, FSA/RHS & VA Home Purchase Loans
B) Conventional Home Purchase Loans
C) Refinancings
D) Home Improvement Loans
F) Non-occupant Loans on < 5 Family Dwellings (A B C & D)
Number
Average Value
Number
Average Value
Number
Average Value
Number
Average Value
Number
Average Value
LOANS ORIGINATED
4
$77,525
33
$69,885
39
$69,621
5
$6,956
14
$47,339
APPLICATIONS APPROVED, NOT ACCEPTED
0
$0
6
$67,262
19
$65,381
3
$17,913
0
$0
APPLICATIONS DENIED
1
$68,490
21
$55,524
43
$60,900
4
$22,282
4
$46,615
APPLICATIONS WITHDRAWN
0
$0
4
$88,485
13
$61,769
0
$0
2
$74,510
FILES CLOSED FOR INCOMPLETENESS
0
$0
2
$62,755
8
$68,592
0
$0
3
$50,430
Aggregated Statistics For Year 2001 (Based on 4 partial tracts)
A) FHA, FSA/RHS & VA Home Purchase Loans
B) Conventional Home Purchase Loans
C) Refinancings
D) Home Improvement Loans
F) Non-occupant Loans on < 5 Family Dwellings (A B C & D)
Number
Average Value
Number
Average Value
Number
Average Value
Number
Average Value
Number
Average Value
LOANS ORIGINATED
5
$93,092
18
$53,978
49
$56,201
3
$9,883
13
$42,378
APPLICATIONS APPROVED, NOT ACCEPTED
0
$0
11
$61,479
14
$67,949
2
$8,160
2
$53,265
APPLICATIONS DENIED
2
$61,890
31
$50,585
53
$52,377
11
$10,326
3
$54,673
APPLICATIONS WITHDRAWN
1
$94,310
5
$57,954
19
$53,934
1
$17,610
1
$47,500
FILES CLOSED FOR INCOMPLETENESS
0
$0
1
$69,150
3
$74,500
0
$0
0
$0
Aggregated Statistics For Year 2000 (Based on 4 partial tracts)
A) FHA, FSA/RHS & VA Home Purchase Loans
B) Conventional Home Purchase Loans
C) Refinancings
D) Home Improvement Loans
F) Non-occupant Loans on < 5 Family Dwellings (A B C & D)
Number
Average Value
Number
Average Value
Number
Average Value
Number
Average Value
Number
Average Value
LOANS ORIGINATED
6
$67,807
27
$57,135
33
$60,967
7
$15,943
7
$53,986
APPLICATIONS APPROVED, NOT ACCEPTED
1
$56,490
11
$59,093
17
$60,214
5
$15,764
0
$0
APPLICATIONS DENIED
2
$54,680
52
$119,629
50
$48,929
11
$17,749
2
$48,275
APPLICATIONS WITHDRAWN
1
$77,010
7
$47,906
24
$45,600
3
$18,653
1
$60,910
FILES CLOSED FOR INCOMPLETENESS
0
$0
1
$84,980
15
$53,089
0
$0
1
$43,720
Aggregated Statistics For Year 1999 (Based on 1 full and 2 partial tracts)
A) FHA, FSA/RHS & VA Home Purchase Loans
B) Conventional Home Purchase Loans
C) Refinancings
D) Home Improvement Loans
F) Non-occupant Loans on < 5 Family Dwellings (A B C & D)

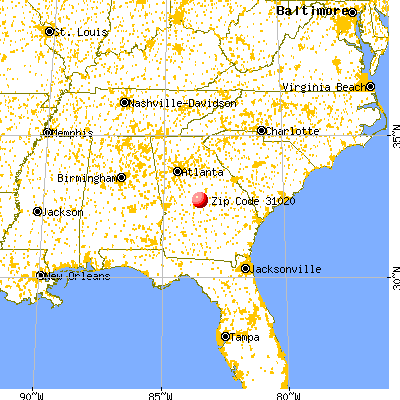


 Nearest zip codes: 31098, 31044, 31217, 31093, 31201, 31005.
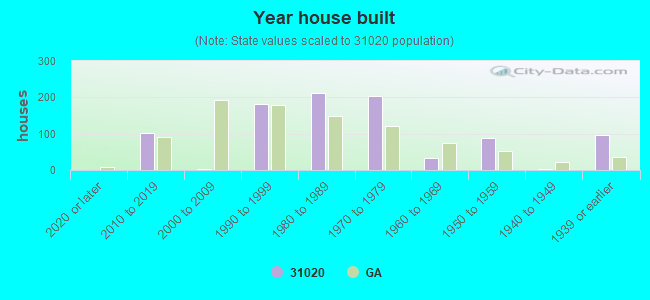


 . Federal Facility. FOREST SERVICE