Estimated zip code population in 2022: 8,217 Zip code population in 2010: 5,986 Zip code population in 2000: 12,843
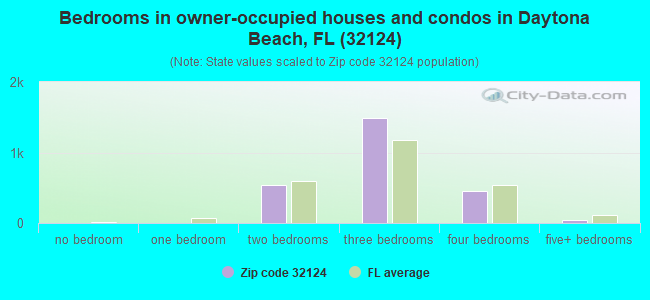
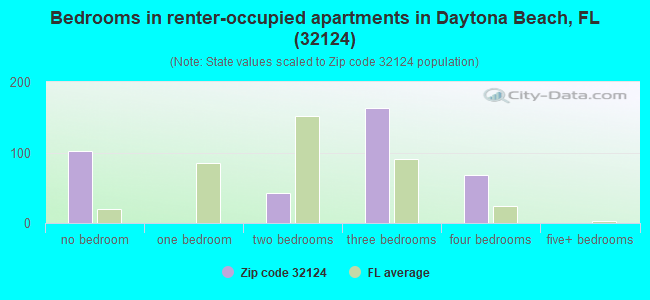
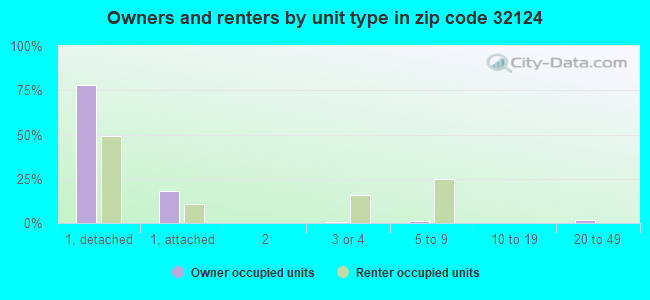
Houses and condos: 3,121 Renter-occupied apartments: 367
% of renters here:
13%
State:
33%
March 2022 cost of living index in zip code 32124: 85.3 (less than average, U.S. average is 100)
Land area: 45.1 sq. mi. Water area: 0.3 sq. mi.
Population density: 182 people per square mile
(very low).
OSM Map
General Map
Google Map
MSN Map
OSM Map
General Map
Google Map
MSN Map
OSM Map
General Map
Google Map
MSN Map
OSM Map
General Map
Google Map
MSN Map
Please wait while loading the map...
Real estate property taxes paid for housing units in 2022:
This zip code:
0.9% ($3,685)
Florida:
0.7% ($2,529)
Median real estate property taxes paid for housing units with mortgages in 2022: $3,522 (0.9%) Median real estate property taxes paid for housing units with no mortgage in 2022: $4,276 (0.9%)
Averages for the 2020 tax year for zip code 32124, filed in 2021:
Average Adjusted Gross Income (AGI) in 2020: $89,313 (Individual Income Tax Returns)
Here:
$89,313
State:
$82,200
Salary/wage: $68,789 (reported on 67.0% of returns)
Here:
$68,789
State:
$58,347
(% of AGI for various income ranges: 1010.9% for AGIs below $25k, 2988.4% for AGIs $25k-50k, 5330.5% for AGIs $50k-75k, 7399.0% for AGIs $75k-100k, 14068.9% for AGIs $100k-200k, 66010.0% for AGIs over 200k)
Taxable interest for individuals: $2,255 (reported on 45.1% of returns)
This zip code:
$2,255
Florida:
$4,272
(% of AGI for various income ranges: 42.9% for AGIs below $25k, 70.5% for AGIs $25k-50k, 108.6% for AGIs $50k-75k, 177.0% for AGIs $75k-100k, 214.1% for AGIs $100k-200k, 1757.8% for AGIs over 200k)
Ordinary dividends: $7,230 (reported on 31.6% of returns)
Here:
$7,230
State:
$15,863
(% of AGI for various income ranges: 69.4% for AGIs below $25k, 92.9% for AGIs $25k-50k, 248.4% for AGIs $50k-75k, 360.0% for AGIs $75k-100k, 470.9% for AGIs $100k-200k, 4697.8% for AGIs over 200k)
Net capital gain/loss in AGI: +$19,126 (reported on 29.6% of returns)
Here:
+$19,126
State:
+$62,983
(% of AGI for various income ranges: 22.7% for AGIs below $25k, 49.8% for AGIs $25k-50k, 127.0% for AGIs $50k-75k, 450.7% for AGIs $75k-100k, 1085.7% for AGIs $100k-200k, 17866.7% for AGIs over 200k)
Profit/loss from business: +$11,994 (reported on 17.0% of returns)
Here:
+$11,994
State:
+$9,719
(% of AGI for various income ranges: 115.4% for AGIs below $25k, 158.4% for AGIs $25k-50k, 73.8% for AGIs $50k-75k, 237.3% for AGIs $75k-100k, 413.9% for AGIs $100k-200k, 4235.6% for AGIs over 200k)
Taxable individual retirement arrangement distribution: $28,164 (reported on 19.4% of returns)
32124:
$28,164
Florida:
$24,823
(% of AGI for various income ranges: 157.0% for AGIs below $25k, 255.2% for AGIs $25k-50k, 633.0% for AGIs $50k-75k, 977.3% for AGIs $75k-100k, 2077.8% for AGIs $100k-200k, 5745.6% for AGIs over 200k)
Self-employed (Keogh) retirement plans: $23,500 (reported on 0.5% of returns)
32124:
$23,500
Florida:
$29,694
(% of AGI for various income ranges: 127.0% for AGIs $50k-75k)
Total itemized deductions: $33,123 (reported on 11.4% of returns)
Here:
$33,123
State:
$45,393
(% of AGI for various income ranges: 99.6% for AGIs below $25k, 200.5% for AGIs $25k-50k, 570.5% for AGIs $50k-75k, 713.3% for AGIs $75k-100k, 910.0% for AGIs $100k-200k, 5901.1% for AGIs over 200k)
Charity contributions: $7,580 (reported on 9.7% of returns)
Here:
$7,580
State:
$20,178
(% of AGI for various income ranges: 18.2% for AGIs $25k-50k, 77.6% for AGIs $50k-75k, 119.7% for AGIs $75k-100k, 195.7% for AGIs $100k-200k, 1537.8% for AGIs over 200k)
Taxes paid: $6,728 (reported on 11.4% of returns)
32124:
$6,728
State:
$6,967
(% of AGI for various income ranges: 18.1% for AGIs below $25k, 39.1% for AGIs $25k-50k, 113.5% for AGIs $50k-75k, 146.3% for AGIs $75k-100k, 224.6% for AGIs $100k-200k, 1026.7% for AGIs over 200k)
Earned income credit: $1,833 (reported on 8.7% of returns)
Here:
$1,833
State:
$2,306
(% of AGI for various income ranges: 53.9% for AGIs below $25k, 50.5% for AGIs $25k-50k)
Percentage of individuals using paid preparers for their 2020 taxes: 91.0%
Here:
91%
State:
92%
(% for various income ranges: 84.7% for AGIs below $25k, 93.3% for AGIs $25k-50k, 94.6% for AGIs $50k-75k, 92.0% for AGIs $75k-100k, 93.1% for AGIs $100k-200k, 93.9% for AGIs over 200k)
Averages for the 2012 tax year for zip code 32124, filed in 2013:
Average Adjusted Gross Income (AGI) in 2012: $59,253 (Individual Income Tax Returns)
Here:
$59,253
State:
$60,316
Salary/wage: $51,458 (reported on 80.5% of returns)
Here:
$51,458
State:
$45,277
(% of AGI for various income ranges: 71.2% for AGIs below $25k, 76.2% for AGIs $25k-50k, 78.6% for AGIs $50k-75k, 74.4% for AGIs $75k-100k, 73.0% for AGIs $100k-200k, 49.4% for AGIs over 200k)
Taxable interest for individuals: $1,513 (reported on 32.9% of returns)
This zip code:
$1,513
Florida:
$3,587
(% of AGI for various income ranges: 2.2% for AGIs below $25k, 1.0% for AGIs $25k-50k, 0.4% for AGIs $50k-75k, 0.5% for AGIs $75k-100k, 0.7% for AGIs $100k-200k, 1.0% for AGIs over 200k)
Ordinary dividends: $5,806 (reported on 20.1% of returns)
Here:
$5,806
State:
$12,831
(% of AGI for various income ranges: 4.1% for AGIs below $25k, 1.3% for AGIs $25k-50k, 1.1% for AGIs $50k-75k, 0.5% for AGIs $75k-100k, 1.7% for AGIs $100k-200k, 4.0% for AGIs over 200k)
Net capital gain/loss in AGI: +$3,418 (reported on 17.1% of returns)
Here:
+$3,418
State:
+$33,493
(% of AGI for various income ranges: 1.0% for AGIs $100k-200k, 3.7% for AGIs over 200k)
Profit/loss from business: +$7,818 (reported on 17.1% of returns)
Here:
+$7,818
State:
+$10,012
(% of AGI for various income ranges: 8.1% for AGIs below $25k, 1.9% for AGIs $25k-50k, 2.9% for AGIs $50k-75k, 3.6% for AGIs $75k-100k, 1.4% for AGIs $100k-200k)
Taxable individual retirement arrangement distribution: $19,994 (reported on 10.4% of returns)
32124:
$19,994
Florida:
$21,544
(% of AGI for various income ranges: 4.8% for AGIs below $25k, 2.7% for AGIs $25k-50k, 3.9% for AGIs $50k-75k, 3.9% for AGIs $75k-100k, 5.6% for AGIs $100k-200k)
Total itemized deductions: $20,250 (20% of AGI, reported on 36.6% of returns)
Here:
$20,250
State:
$25,533
Here:
20.4% of AGI
State:
18.0% of AGI
(% of AGI for various income ranges: 14.3% for AGIs below $25k, 13.5% for AGIs $25k-50k, 12.2% for AGIs $50k-75k, 13.0% for AGIs $75k-100k, 15.1% for AGIs $100k-200k, 7.2% for AGIs over 200k)
Charity contributions: $3,569 (reported on 29.3% of returns)
Here:
$3,569
State:
$5,698
(% of AGI for various income ranges: 1.2% for AGIs below $25k, 1.4% for AGIs $25k-50k, 1.2% for AGIs $50k-75k, 1.9% for AGIs $75k-100k, 2.7% for AGIs $100k-200k, 1.2% for AGIs over 200k)
Taxes paid: $4,819 (reported on 36.0% of returns)
32124:
$4,819
State:
$6,203
(% of AGI for various income ranges: 2.7% for AGIs below $25k, 2.7% for AGIs $25k-50k, 2.3% for AGIs $50k-75k, 2.7% for AGIs $75k-100k, 3.8% for AGIs $100k-200k, 2.6% for AGIs over 200k)
Earned income credit: $1,973 (reported on 15.9% of returns)
Here:
$1,973
State:
$2,372
(% of AGI for various income ranges: 5.4% for AGIs below $25k, 0.9% for AGIs $25k-50k)
Percentage of individuals using paid preparers for their 2012 taxes: 51.2%
Here:
51%
State:
54%
(% for various income ranges: 48.2% for AGIs below $25k, 47.5% for AGIs $25k-50k, 50.0% for AGIs $50k-75k, 55.6% for AGIs $75k-100k, 61.9% for AGIs $100k-200k, 60.0% for AGIs over 200k)
Averages for the 2004 tax year for zip code 32124, filed in 2005:
Average Adjusted Gross Income (AGI) in 2004: $55,697 (Individual Income Tax Returns)
Here:
$55,697
State:
$50,523
Salary/wage: $43,692 (reported on 76.4% of returns)
Here:
$43,692
State:
$39,563
(% of AGI for various income ranges: 68.9% for AGIs $10k-25k, 71.0% for AGIs $25k-50k, 67.8% for AGIs $50k-75k, 63.1% for AGIs $75k-100k, 46.7% for AGIs over 100k)
Taxable interest for individuals: $2,732 (reported on 50.6% of returns)
This zip code:
$2,732
Florida:
$3,211
(% of AGI for various income ranges: 4.1% for AGIs $10k-25k, 1.6% for AGIs $25k-50k, 2.8% for AGIs $50k-75k, 2.8% for AGIs $75k-100k, 1.9% for AGIs over 100k)
Taxable dividends: $3,820 (reported on 30.6% of returns)
Here:
$3,820
State:
$6,129
(% of AGI for various income ranges: 2.4% for AGIs $10k-25k, 1.3% for AGIs $25k-50k, 0.7% for AGIs $50k-75k, 1.2% for AGIs $75k-100k, 2.6% for AGIs over 100k)
Net capital gain/loss: +$12,853 (reported on 27.9% of returns)
Here:
+$12,853
State:
+$27,205
(% of AGI for various income ranges: -0.4% for AGIs $10k-25k, 1.6% for AGIs $25k-50k, 0.6% for AGIs $50k-75k, 3.9% for AGIs $75k-100k, 10.8% for AGIs over 100k)
Profit/loss from business: +$12,577 (reported on 15.9% of returns)
Here:
+$12,577
State:
+$10,634
(% of AGI for various income ranges: 6.6% for AGIs $10k-25k, 4.6% for AGIs $25k-50k, -0.1% for AGIs $50k-75k, 2.3% for AGIs $75k-100k, 3.5% for AGIs over 100k)
IRA payment deduction: $3,325 (reported on 3.5% of returns)
32124:
$3,325
Florida:
$3,082
Total itemized deductions: $18,325 (18% of AGI, reported on 37.2% of returns)
Here:
$18,325
State:
$20,370
Here:
18.3% of AGI
State:
20.7% of AGI
(% of AGI for various income ranges: 14.9% for AGIs $10k-25k, 15.8% for AGIs $25k-50k, 12.6% for AGIs $50k-75k, 15.9% for AGIs $75k-100k, 8.7% for AGIs over 100k)
Charity contributions deductions: $3,376 (3% of AGI, reported on 31.2% of returns)
Here:
$3,376
State:
$4,064
Here:
3.4% of AGI
State:
3.8% of AGI
(% of AGI for various income ranges: 1.1% for AGIs $10k-25k, 1.9% for AGIs $25k-50k, 1.5% for AGIs $50k-75k, 2.9% for AGIs $75k-100k, 1.7% for AGIs over 100k)
Total tax: $11,459 (reported on 77.2% of returns)
32124:
$11,459
State:
$9,431
(% of AGI for various income ranges: 4.4% for AGIs $10k-25k, 7.2% for AGIs $25k-50k, 9.7% for AGIs $50k-75k, 11.1% for AGIs $75k-100k, 21.9% for AGIs over 100k)
Earned income credit: $1,431 (reported on 11.4% of returns)
Here:
$1,431
State:
$1,808
Percentage of individuals using paid preparers for their 2004 taxes: 61.4%
Here:
61%
State:
60%
(% for various income ranges: 55.9% for AGIs below $10k, 62.5% for AGIs $10k-25k, 58.4% for AGIs $25k-50k, 55.8% for AGIs $50k-75k, 61.5% for AGIs $75k-100k, 78.5% for AGIs over 100k)
Household received Food Stamps/SNAP in the past 12 months: 39 Household did not receive Food Stamps/SNAP in the past 12 months: 2,861
Women who did not have a birth in the past 12 months: 1,177 (524 now married, 653 unmarried)
Housing units in zip code 32124 with a mortgage: 1,646 (68 second mortgage, 60 both second mortgage and home equity loan) Median monthly owner costs for units with a mortgage: $1,716 Median monthly owner costs for units without a mortgage: $633
Residents with income below the poverty level in 2022:
This zip code:
7.6%
Whole state:
12.7%
Residents with income below 50% of the poverty level in 2022:
This zip code:
5.3%
Whole state:
6.6%
Median number of rooms in houses and condos:
Here:
5.8
State:
5.9
Median number of rooms in apartments:
Here:
5.4
State:
4.2
Notable locations in this zip code not listed on our city pages
Notable locations in zip code 32124: Bennett Field (A), Old Clark Field (B), Volusia County Fire Services Station 15 Fire Science Institute (C), Daytona Beach Community College - Mary Karl Memorial Library (D), Volusia County Sheriff's Office (E), Law Enforcement Services (F), Volusia County Public Library Support Center (G), Tomoka Correctional Institution (H). Display/hide their locations on the map
Lakes and swamps: Banks Lake (A), Bonnet Lake (B), Indian Lake (C), Coon Pond (D), Scoggin Lake (E), Buck Bay (F), Little Tiger Bay (G), Bennett Swamp (H). Display/hide their locations on the map
In group quarters: 2,244 (-1 institutionalized population)
Size of family households: 1,330 2-persons, 211 3-persons, 180 4-persons, 118 5-persons, 3 6-persons, 4 7-or-more-persons
Size of nonfamily households: 745 1-person, 287 2-persons
461 married couples with children.
162 single-parent households (20 men, 142 women).
92.7% of residents of 32124 zip code speak English at home.
3.0% of residents speak Spanish at home (77% very well, 19% well, 3% not well).
1.1% of residents speak other Indo-European language at home (62% very well, 38% well).
2.7% of residents speak Asian or Pacific Island language at home (66% very well, 11% well, 23% not well).
0.2% of residents speak other language at home (100% not well).
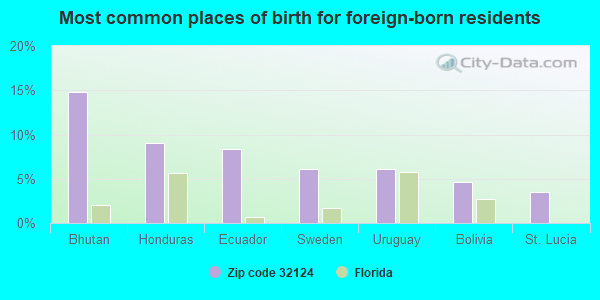
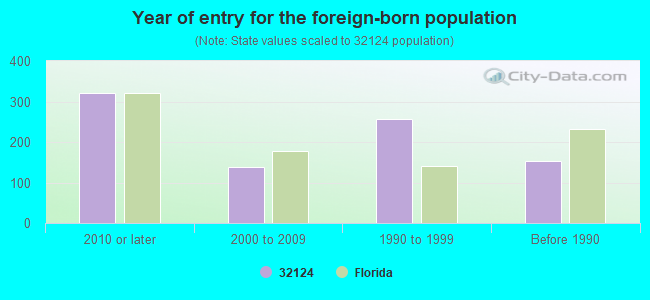
Foreign born population: 754 (9.2%) (52.9% of them are naturalized citizens)
Major facilities with environmental interests located in this zip code:
ADVANCED TECHNOLOGY CENTER (1770 TECHNOLOGY BOULEVARD in DAYTONA BEACH, FL)
(National Center for Education Statistics) - STATE ID-7821 (Resource Conservation and Recovery Act (tracking hazardous waste)) Organizations: DAYTONA BEACH COMMUNITY COLLEG (CONTACT/OWNER)
, FLAGLER COUNTY SCHOOL DISTRICT (SCHOOL DISTRICT)
, VOLUSIA COUNTY SCHOOL DISTRICT (SCHOOL DISTRICT)
RING POWER - CLOSED LOOP RECYCLE SYSTEM (401 N TOMOKA FARMS RD in DAYTONA BEACH, FL)
STATE MASTER (FDM) - WAFR-FLA016692, INDUSTRIAL WASTEWATER PROGRAM Small Quantity Generators, between 100 kg and 1000 kg of hazardous waste/month (Resource Conservation and Recovery Act (tracking hazardous waste)) - notification USED OIL PROGRAM (Resource Conservation and Recovery Act (tracking hazardous waste)) Business SIC classification: HEAVY CONSTRUCTION EQUIPMENT RENTAL AND LEASING; CARWASHES Organizations: RINGHAVER EQUIPMENT CO (CONTACT/APPLICANT)
, RING POWER CORPORATION (CONTACT/APPLICANT)
, RING POWER CORP (CONTACT/OWNER)
, RINGHAVER EQUIPMENT CO (CONTACT/PERMIT)
Alternative names: RING POWER CORP, RINGHAVER EQUIPMENT CO
DEPARTMENT OF CORRECTIONS EDUCATIONAL PROGRAM (3875 TIGER BAY ROAD in DAYTONA BEACH, FL)
(National Center for Education Statistics) - STATE ID-9894 Organizations: VOLUSIA COUNTY SCHOOL DISTRICT (SCHOOL DISTRICT)
SPEEDWAY PULL-N-SAVE AUTO PART (3157 W. INTERNATIONAL SPEEDWAY in DAYTONA BEACH, FL)
National Pollutant Discharge Elimination System NON-MAJOR (Tracking pollutant discharge elimination systems) - permit (Resource Conservation and Recovery Act (tracking hazardous waste)) Organizations: GARY BEAGELL (CONTACT/OWNER)
Alternative names: A & B AUTO SALVAGE, SPEEDWAY PULL-N-SAVE AUTO PARTS
JOYELLE AT LPGA INTERNATIONAL (JOYELLE CIRCLE & TOURNAMENT DR in DAYTONA BEACH, FL)
National Pollutant Discharge Elimination System NON-MAJOR (Tracking pollutant discharge elimination systems) - permit Organizations: DOUGLAS LEWIS (CONTACT/OWNER)
MASON COMMERCE CENTER (MASON AVE/WILLIAMSON BLVD in DAYTONA BEACH, FL)
National Pollutant Discharge Elimination System NON-MAJOR (Tracking pollutant discharge elimination systems) - permit Organizations: TED GARN (CONTACT/OWNER)
CORNERSTONE OFFICE PARK LOT 1 (CORNER OF WILLIAMSON BLVD &LPG in DAYTONA BEACH, FL)
National Pollutant Discharge Elimination System NON-MAJOR (Tracking pollutant discharge elimination systems) - permit Organizations: MATTHEW PHILLIPS (CONTACT/OWNER)
ARDMORE INTERNATIONAL JETS INC (226 CESSNA BLVD in DAYTONA BEACH, FL)
DAYTONA AUTOMALL II (W OF I-95, N OF US 92, E OF TO in DAYTONA BEACH, FL)
National Pollutant Discharge Elimination System NON-MAJOR (Tracking pollutant discharge elimination systems) - permit Organizations: TED GARN (CONTACT/OWNER)
Housing units lacking complete plumbing facilities: 0.9% Housing units lacking complete kitchen facilities: 3.9%
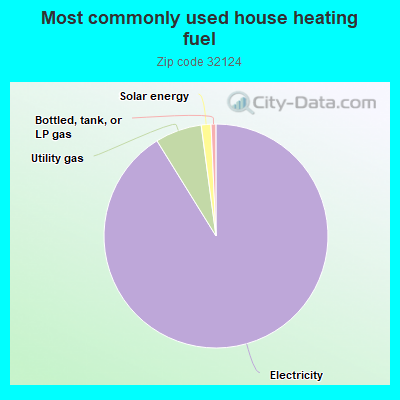
91.0%Electricity
6.7%Utility gas
1.4%Solar energy
0.7%Bottled, tank, or LP gas
Population in 1990: 7,360. Population change in the 1990s: +5,483 (+74.5%).
Place of birth for U.S.-born residents:
This state: 2,624
Northeast: 1,760
Midwest: 1,199
South: 1,383
West: 366
44% of the 32124 zip code residents lived in the same house 5 years ago. Out of people who lived in different houses, 47% lived in this county. Out of people who lived in different counties, 50% lived in Florida.
77% of the 32124 zip code residents lived in the same house 1 year ago. Out of people who lived in different houses, 47% moved from this county. Out of people who lived in different houses, 28% moved from different county within same state. Out of people who lived in different houses, 16% moved from different state. Out of people who lived in different houses, 4% moved from abroad.
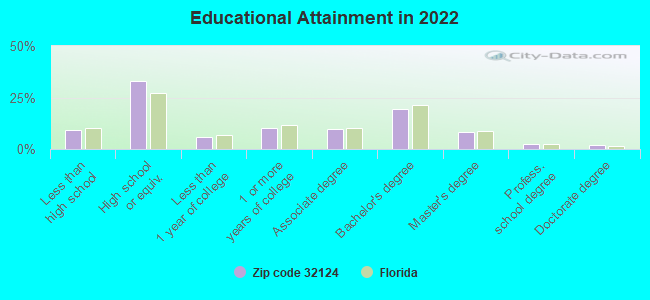
Private vs. public school enrollment:
Students in private schools in grades 1 to 8 (elementary and middle school): 39
Here:
15.7%
Florida:
15.8%
Students in private schools in grades 9 to 12 (high school): 20
Here:
9.9%
Florida:
12.9%
Students in private undergraduate colleges: 109
Here:
47.7%
Florida:
23.6%
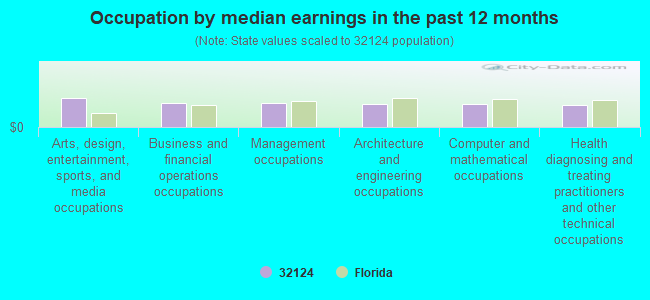
Occupation by median earnings in the past 12 months ($)
102,103Arts, design, entertainment, sports, and media occupations
85,048Business and financial operations occupations
83,040Management occupations
81,501Architecture and engineering occupations
80,196Computer and mathematical occupations
77,373Health diagnosing and treating practitioners and other technical occupations
Companies with federal contracts located in this zip code:
TITAN SCHOOLS, INC (3042 W INTERNATIONAL SPEED in DAYTONA BEACH, FL) : $9,000 in 2 contractsin 2005
$4,500 with Army for Education Services. Signed on 2005-10-26. Completion date: 2005-10-26.
$4,500, same as above.Signed on 2005-10-24. Completion date: 2005-10-24.
Top industries in this zip code by the number of employees in 2005:
Construction: Highway, Street, and Bridge Construction (100-249: 1)
Wholesale Trade: Wholesale Trade Agents and Brokers (100-249: 1)
Health Care and Social Assistance: Nursing Care Facilities (100-249: 1)
Other Services (except Public Administration): Other Similar Organizations (except Business, Professional, Labor, and Political Organizations) (50-99: 1, 20-49: 1)
Health Care and Social Assistance: Other Residential Care Facilities (20-49: 3)
Health Care and Social Assistance: Outpatient Mental Health and Substance Abuse Centers (20-49: 2, 10-19: 2)
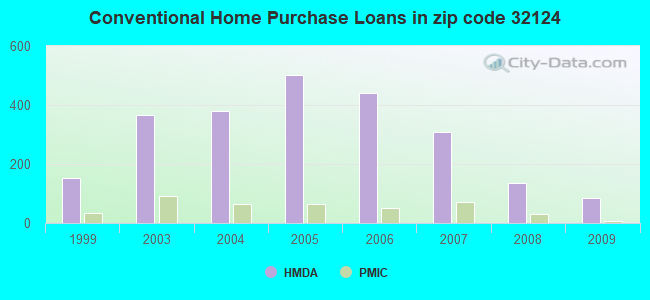
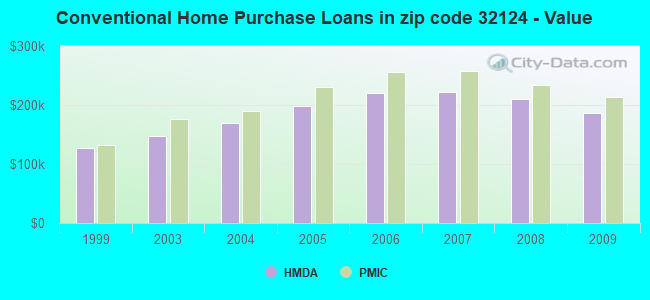
Detailed PMIC statistics for the following Tracts:0832.04
2002 - 2018 National Fire Incident Reporting System (NFIRS) incidents
According to the data from the years 2002 - 2018 the average number of fires per year is 32. The highest number of reported fire incidents - 48 took place in 2016, and the least - 15 in 2005. The data has a rising trend.
When looking into fire subcategories, the most reports belonged to: Outside Fires (54.4%), and Mobile Property/Vehicle Fires (34.9%).
Fire incident types reported to NFIRS in Zip Code 32124

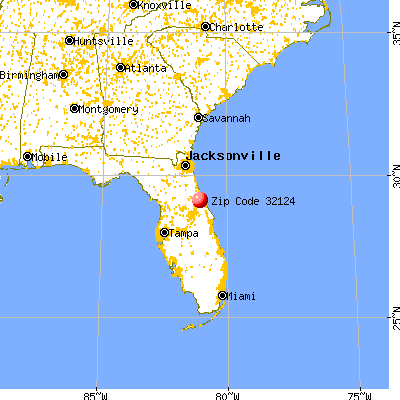


 Nearest zip codes: 32114, 32128, 32117, 32119, 32174, 32129.


 According to the data from the years 2002 - 2018 the average number of fires per year is 32. The highest number of reported fire incidents - 48 took place in 2016, and the least - 15 in 2005. The data has a rising trend.
 When looking into fire subcategories, the most reports belonged to: Outside Fires (54.4%), and Mobile Property/Vehicle Fires (34.9%).