Estimated zip code population in 2022: 24,376 Zip code population in 2010: 16,647 Zip code population in 2000: 12,109
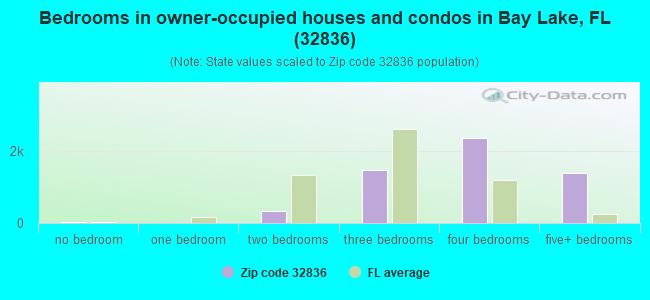
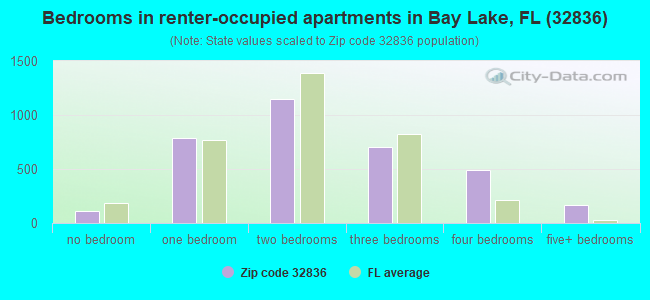
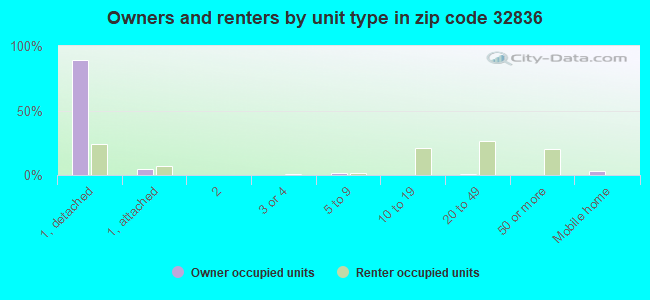
Houses and condos: 10,470 Renter-occupied apartments: 3,409
% of renters here:
38%
State:
33%
March 2022 cost of living index in zip code 32836: 94.7 (less than average, U.S. average is 100)
Land area: 15.7 sq. mi. Water area: 4.5 sq. mi.
Population density: 1,557 people per square mile
(low).
OSM Map
General Map
Google Map
MSN Map
OSM Map
General Map
Google Map
MSN Map
OSM Map
General Map
Google Map
MSN Map
OSM Map
General Map
Google Map
MSN Map
Please wait while loading the map...
Real estate property taxes paid for housing units in 2022:
This zip code:
0.9% ($6,787)
Florida:
0.7% ($2,529)
Median real estate property taxes paid for housing units with mortgages in 2022: $6,796 (0.9%) Median real estate property taxes paid for housing units with no mortgage in 2022: $6,702 (0.9%)
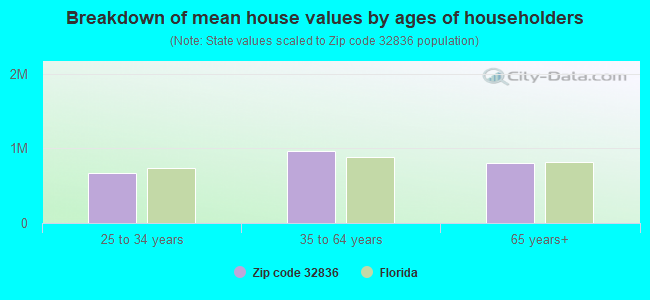
Estimated median house/condo value in 2022: $730,013
32836:
$730,013
Florida:
$354,100
According to our research of Florida and other state lists, there were 5 registered sex offenders living in 32836 zip code as of April 19, 2024. The ratio of all residents to sex offenders in zip code 32836 is 3,577 to 1. The ratio of registered sex offenders to all residents in this zip code is much lower than the state average.
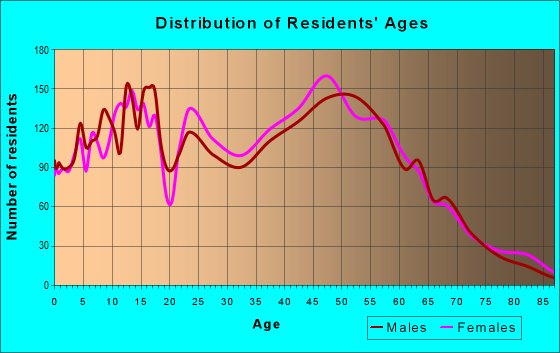
Median resident age:
This zip code:
37.5 years
Florida median age:
42.7 years
Average household size:
This zip code:
2.7 people
Florida:
2.5 people
Averages for the 2020 tax year for zip code 32836, filed in 2021:
Average Adjusted Gross Income (AGI) in 2020: $175,262 (Individual Income Tax Returns)
Here:
$175,262
State:
$82,200
Salary/wage: $111,009 (reported on 81.0% of returns)
Here:
$111,009
State:
$58,347
(% of AGI for various income ranges: 1262.1% for AGIs below $25k, 3226.8% for AGIs $25k-50k, 6665.7% for AGIs $50k-75k, 10018.9% for AGIs $75k-100k, 19282.6% for AGIs $100k-200k, 117360.2% for AGIs over 200k)
Taxable interest for individuals: $9,852 (reported on 33.9% of returns)
This zip code:
$9,852
Florida:
$4,272
(% of AGI for various income ranges: 25.4% for AGIs below $25k, 54.3% for AGIs $25k-50k, 133.5% for AGIs $50k-75k, 205.6% for AGIs $75k-100k, 319.7% for AGIs $100k-200k, 5569.5% for AGIs over 200k)
Ordinary dividends: $22,478 (reported on 29.2% of returns)
Here:
$22,478
State:
$15,863
(% of AGI for various income ranges: 48.5% for AGIs below $25k, 67.8% for AGIs $25k-50k, 150.8% for AGIs $50k-75k, 425.6% for AGIs $75k-100k, 664.9% for AGIs $100k-200k, 11146.8% for AGIs over 200k)
Net capital gain/loss in AGI: +$119,299 (reported on 29.3% of returns)
Here:
+$119,299
State:
+$62,983
(% of AGI for various income ranges: 39.5% for AGIs below $25k, 80.2% for AGIs $25k-50k, 227.8% for AGIs $50k-75k, 716.4% for AGIs $75k-100k, 1185.7% for AGIs $100k-200k, 66910.4% for AGIs over 200k)
Profit/loss from business: +$16,640 (reported on 23.1% of returns)
Here:
+$16,640
State:
+$9,719
(% of AGI for various income ranges: 185.0% for AGIs below $25k, 275.7% for AGIs $25k-50k, 344.7% for AGIs $50k-75k, 525.8% for AGIs $75k-100k, 736.5% for AGIs $100k-200k, 3996.6% for AGIs over 200k)
Taxable individual retirement arrangement distribution: $36,357 (reported on 7.5% of returns)
32836:
$36,357
Florida:
$24,823
(% of AGI for various income ranges: 33.8% for AGIs below $25k, 74.0% for AGIs $25k-50k, 212.9% for AGIs $50k-75k, 647.3% for AGIs $75k-100k, 853.0% for AGIs $100k-200k, 2919.1% for AGIs over 200k)
Self-employed (Keogh) retirement plans: $25,733 (reported on 0.8% of returns)
32836:
$25,733
Florida:
$29,694
(% of AGI for various income ranges: 18.5% for AGIs $25k-50k, 354.6% for AGIs over 200k)
Total itemized deductions: $59,085 (reported on 14.5% of returns)
Here:
$59,085
State:
$45,393
(% of AGI for various income ranges: 89.0% for AGIs below $25k, 139.0% for AGIs $25k-50k, 371.2% for AGIs $50k-75k, 809.3% for AGIs $75k-100k, 1400.5% for AGIs $100k-200k, 13010.0% for AGIs over 200k)
Charity contributions: $30,958 (reported on 11.4% of returns)
Here:
$30,958
State:
$20,178
(% of AGI for various income ranges: 5.5% for AGIs below $25k, 21.3% for AGIs $25k-50k, 32.2% for AGIs $50k-75k, 163.6% for AGIs $75k-100k, 273.1% for AGIs $100k-200k, 6379.6% for AGIs over 200k)
Taxes paid: $8,087 (reported on 14.3% of returns)
32836:
$8,087
State:
$6,967
(% of AGI for various income ranges: 16.8% for AGIs below $25k, 28.4% for AGIs $25k-50k, 73.5% for AGIs $50k-75k, 183.6% for AGIs $75k-100k, 337.0% for AGIs $100k-200k, 1383.9% for AGIs over 200k)
Earned income credit: $2,082 (reported on 13.8% of returns)
Here:
$2,082
State:
$2,306
(% of AGI for various income ranges: 78.9% for AGIs below $25k, 73.4% for AGIs $25k-50k, 1.4% for AGIs $50k-75k)
Percentage of individuals using paid preparers for their 2020 taxes: 92.3%
Here:
92%
State:
92%
(% for various income ranges: 91.4% for AGIs below $25k, 93.9% for AGIs $25k-50k, 92.3% for AGIs $50k-75k, 89.9% for AGIs $75k-100k, 91.7% for AGIs $100k-200k, 93.4% for AGIs over 200k)
Averages for the 2012 tax year for zip code 32836, filed in 2013:
Average Adjusted Gross Income (AGI) in 2012: $122,662 (Individual Income Tax Returns)
Here:
$122,662
State:
$60,316
Salary/wage: $86,524 (reported on 86.2% of returns)
Here:
$86,524
State:
$45,277
(% of AGI for various income ranges: 86.2% for AGIs below $25k, 83.0% for AGIs $25k-50k, 73.0% for AGIs $50k-75k, 73.5% for AGIs $75k-100k, 76.6% for AGIs $100k-200k, 51.4% for AGIs over 200k)
Taxable interest for individuals: $5,160 (reported on 36.9% of returns)
This zip code:
$5,160
Florida:
$3,587
(% of AGI for various income ranges: 1.4% for AGIs below $25k, 1.0% for AGIs $25k-50k, 1.6% for AGIs $50k-75k, 1.9% for AGIs $75k-100k, 0.8% for AGIs $100k-200k, 1.8% for AGIs over 200k)
Ordinary dividends: $10,834 (reported on 28.6% of returns)
Here:
$10,834
State:
$12,831
(% of AGI for various income ranges: 1.9% for AGIs below $25k, 1.8% for AGIs $25k-50k, 2.3% for AGIs $50k-75k, 2.3% for AGIs $75k-100k, 1.8% for AGIs $100k-200k, 2.9% for AGIs over 200k)
Net capital gain/loss in AGI: +$20,210 (reported on 25.9% of returns)
Here:
+$20,210
State:
+$33,493
(% of AGI for various income ranges: 0.4% for AGIs $25k-50k, 0.9% for AGIs $50k-75k, 1.5% for AGIs $75k-100k, 1.2% for AGIs $100k-200k, 6.1% for AGIs over 200k)
Profit/loss from business: +$20,723 (reported on 17.3% of returns)
Here:
+$20,723
State:
+$10,012
(% of AGI for various income ranges: 7.2% for AGIs below $25k, 3.0% for AGIs $25k-50k, 4.8% for AGIs $50k-75k, 2.2% for AGIs $75k-100k, 3.6% for AGIs $100k-200k, 2.4% for AGIs over 200k)
Taxable individual retirement arrangement distribution: $32,319 (reported on 8.3% of returns)
32836:
$32,319
Florida:
$21,544
(% of AGI for various income ranges: 1.5% for AGIs below $25k, 2.3% for AGIs $25k-50k, 3.4% for AGIs $50k-75k, 2.7% for AGIs $75k-100k, 3.0% for AGIs $100k-200k, 1.9% for AGIs over 200k)
Self-employment retirement plans: $20,338 (reported on 0.9% of returns)
32836:
$20,338
Florida:
$20,611
Total itemized deductions: $32,437 (12% of AGI, reported on 35.8% of returns)
Here:
$32,437
State:
$25,533
Here:
12.0% of AGI
State:
18.0% of AGI
(% of AGI for various income ranges: 10.8% for AGIs below $25k, 11.5% for AGIs $25k-50k, 13.8% for AGIs $50k-75k, 15.4% for AGIs $75k-100k, 13.1% for AGIs $100k-200k, 7.5% for AGIs over 200k)
Charity contributions: $6,101 (reported on 29.9% of returns)
Here:
$6,101
State:
$5,698
(% of AGI for various income ranges: 0.5% for AGIs below $25k, 0.9% for AGIs $25k-50k, 1.6% for AGIs $50k-75k, 1.5% for AGIs $75k-100k, 1.9% for AGIs $100k-200k, 1.5% for AGIs over 200k)
Taxes paid: $9,996 (reported on 35.3% of returns)
32836:
$9,996
State:
$6,203
(% of AGI for various income ranges: 2.4% for AGIs below $25k, 2.5% for AGIs $25k-50k, 3.3% for AGIs $50k-75k, 4.2% for AGIs $75k-100k, 3.8% for AGIs $100k-200k, 2.6% for AGIs over 200k)
Earned income credit: $2,323 (reported on 13.3% of returns)
Here:
$2,323
State:
$2,372
(% of AGI for various income ranges: 5.2% for AGIs below $25k, 0.9% for AGIs $25k-50k)
Percentage of individuals using paid preparers for their 2012 taxes: 53.6%
Here:
54%
State:
54%
(% for various income ranges: 47.0% for AGIs below $25k, 49.7% for AGIs $25k-50k, 54.5% for AGIs $50k-75k, 53.4% for AGIs $75k-100k, 57.4% for AGIs $100k-200k, 76.0% for AGIs over 200k)
Averages for the 2004 tax year for zip code 32836, filed in 2005:
Average Adjusted Gross Income (AGI) in 2004: $108,665 (Individual Income Tax Returns)
Here:
$108,665
State:
$50,523
Salary/wage: $78,676 (reported on 87.0% of returns)
Here:
$78,676
State:
$39,563
(% of AGI for various income ranges: 133.0% for AGIs below $10k, 86.0% for AGIs $10k-25k, 82.6% for AGIs $25k-50k, 73.6% for AGIs $50k-75k, 75.7% for AGIs $75k-100k, 58.4% for AGIs over 100k)
Taxable interest for individuals: $3,076 (reported on 48.0% of returns)
This zip code:
$3,076
Florida:
$3,211
(% of AGI for various income ranges: 7.6% for AGIs below $10k, 1.9% for AGIs $10k-25k, 1.8% for AGIs $25k-50k, 2.8% for AGIs $50k-75k, 1.6% for AGIs $75k-100k, 1.2% for AGIs over 100k)
Taxable dividends: $3,579 (reported on 33.2% of returns)
Here:
$3,579
State:
$6,129
(% of AGI for various income ranges: 7.6% for AGIs below $10k, 1.1% for AGIs $10k-25k, 1.3% for AGIs $25k-50k, 1.5% for AGIs $50k-75k, 1.6% for AGIs $75k-100k, 1.0% for AGIs over 100k)
Net capital gain/loss: +$37,052 (reported on 31.0% of returns)
Here:
+$37,052
State:
+$27,205
(% of AGI for various income ranges: -1.5% for AGIs below $10k, -0.0% for AGIs $10k-25k, 0.6% for AGIs $25k-50k, 1.5% for AGIs $50k-75k, 2.7% for AGIs $75k-100k, 13.0% for AGIs over 100k)
Profit/loss from business: +$19,258 (reported on 16.8% of returns)
Here:
+$19,258
State:
+$10,634
(% of AGI for various income ranges: 5.6% for AGIs below $10k, 6.1% for AGIs $10k-25k, 3.3% for AGIs $25k-50k, 4.9% for AGIs $50k-75k, 3.8% for AGIs $75k-100k, 2.6% for AGIs over 100k)
Profit/loss from farming: +$909 (reported on 0.2% of returns)
Here:
+$909
State:
-$6,005
IRA payment deduction: $3,457 (reported on 3.2% of returns)
32836:
$3,457
Florida:
$3,082
(% of AGI for various income ranges: 0.4% for AGIs below $10k, 0.1% for AGIs $10k-25k, 0.2% for AGIs $25k-50k, 0.3% for AGIs $50k-75k, 0.2% for AGIs $75k-100k, 0.1% for AGIs over 100k)
Self-employed pension: $16,511 (reported on 1.2% of returns)
Here:
$16,511
Florida:
$15,857
Total itemized deductions: $28,648 (14% of AGI, reported on 42.8% of returns)
Here:
$28,648
State:
$20,370
Here:
14.2% of AGI
State:
20.7% of AGI
(% of AGI for various income ranges: 20.6% for AGIs below $10k, 12.3% for AGIs $10k-25k, 16.0% for AGIs $25k-50k, 19.8% for AGIs $50k-75k, 22.9% for AGIs $75k-100k, 9.4% for AGIs over 100k)
Charity contributions deductions: $5,174 (3% of AGI, reported on 37.4% of returns)
Here:
$5,174
State:
$4,064
Here:
2.5% of AGI
State:
3.8% of AGI
(% of AGI for various income ranges: 0.7% for AGIs below $10k, 0.9% for AGIs $10k-25k, 1.3% for AGIs $25k-50k, 1.9% for AGIs $50k-75k, 2.5% for AGIs $75k-100k, 1.8% for AGIs over 100k)
Total tax: $28,153 (reported on 77.7% of returns)
32836:
$28,153
State:
$9,431
(% of AGI for various income ranges: 3.5% for AGIs below $10k, 4.5% for AGIs $10k-25k, 7.0% for AGIs $25k-50k, 9.5% for AGIs $50k-75k, 10.0% for AGIs $75k-100k, 23.3% for AGIs over 100k)
Earned income credit: $1,816 (reported on 11.5% of returns)
Here:
$1,816
State:
$1,808
Percentage of individuals using paid preparers for their 2004 taxes: 58.9%
Here:
59%
State:
60%
(% for various income ranges: 54.5% for AGIs below $10k, 55.6% for AGIs $10k-25k, 54.2% for AGIs $25k-50k, 59.3% for AGIs $50k-75k, 60.0% for AGIs $75k-100k, 68.4% for AGIs over 100k)
Likely homosexual households (counted as self-reported same-sex unmarried-partner households)
Lesbian couples: 0.0% of all households
Gay men: 0.3% of all households
Household received Food Stamps/SNAP in the past 12 months: 508 Household did not receive Food Stamps/SNAP in the past 12 months: 8,444
Women who had a birth in the past 12 months: 301 (317 now married, 0 unmarried) Women who did not have a birth in the past 12 months: 6,303 (3,016 now married, 3,288 unmarried)
Housing units in zip code 32836 with a mortgage: 3,568 (351 second mortgage, 329 both second mortgage and home equity loan) Houses without a mortgage: 191
Median monthly owner costs for units with a mortgage: $3,092 Median monthly owner costs for units without a mortgage: $1,065
Residents with income below the poverty level in 2022:
This zip code:
9.9%
Whole state:
12.7%
Residents with income below 50% of the poverty level in 2022:
This zip code:
5.3%
Whole state:
6.6%
Median number of rooms in houses and condos:
Here:
7.8
State:
5.9
Median number of rooms in apartments:
Here:
4.1
State:
4.2
Notable locations in this zip code not listed on our city pages
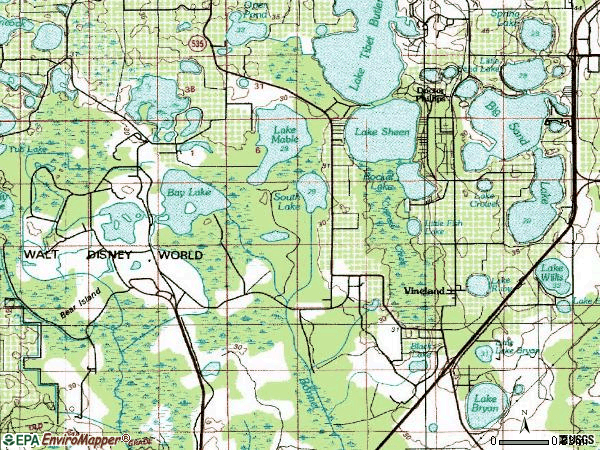
Notable locations in zip code 32836: Doctor Phillips (A), Pompano Beach Golf Course (B), Placid Lakes Country Club (C), Orange County Fire Rescue Department Station 36 (D), Reedy Creek Emergency Services Station 4 (E). Display/hide their locations on the map
Churches in zip code 32836 include: India Pentecostal Church (A), First Baptist Church of Vineland (B), Good Samaritan Chapel (C). Display/hide their locations on the map
Lakes and swamps: Bay Lake (A), Big Sand Lake (B), Black Lake (C), South Lake (D), Pocket Lake (E), Lake Crowell (F), Cypress Creek (G), Little Fish Lake (H). Display/hide their locations on the map
4,116 married couples with children.
881 single-parent households (262 men, 619 women).
56.6% of residents of 32836 zip code speak English at home.
20.0% of residents speak Spanish at home (55% very well, 19% well, 18% not well, 9% not at all).
12.7% of residents speak other Indo-European language at home (81% very well, 12% well, 7% not well).
5.2% of residents speak Asian or Pacific Island language at home (71% very well, 27% well, 2% not well, 1% not at all).
5.5% of residents speak other language at home (93% very well, 6% well).
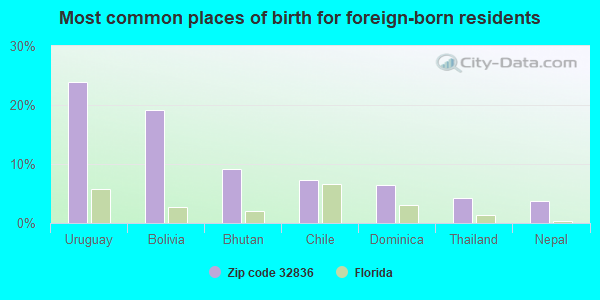
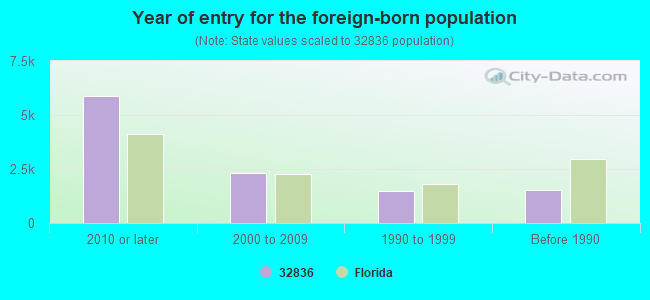
Foreign born population: 8,988 (36.9%) (52.5% of them are naturalized citizens)
Major facilities with environmental interests located in this zip code:
CYPRESS WALK WATER PLANT (60 GRAND CYPRESS BLVD (A) in ORLANDO, FL)
Small Quantity Generators, between 100 kg and 1000 kg of hazardous waste/month (Resource Conservation and Recovery Act (tracking hazardous waste)) - notification (Resource Conservation and Recovery Act (tracking hazardous waste)) Organizations: ORANGE COUNTY UTILITIES (CONTACT/OWNER)
, WILLIAM SINGLENTON SR, CHIEF ENG (CONTACT/OWNER)
Alternative names: CYPRESS WALK WATER PRODUCTION FACILITY, GRAND CYPRESS FLORIDA INC
SAND LAKE PROPERTY (APOPKA-VINELAND & SAND LAKE RD in ORLANDO, FL)
National Pollutant Discharge Elimination System NON-MAJOR (Tracking pollutant discharge elimination systems) - permit National Pollutant Discharge Elimination System NON-MAJOR (Tracking pollutant discharge elimination systems) - permit Alternative names: ABD DEVELOPMENT COMPANY, VANNICE CONSTRUCTION CO INC
GRANDE PINES (REAMS RD & DEL MAR AVE in ORLANDO, FL)
National Pollutant Discharge Elimination System NON-MAJOR (Tracking pollutant discharge elimination systems) - permit Organizations: KEITH BASS (CONTACT/OWNER)
POINT CYPRESS TOWNHOMES (8952 S APOPKA VINELAND RD in ORLANDO, FL)
National Pollutant Discharge Elimination System NON-MAJOR (Tracking pollutant discharge elimination systems) - permit Organizations: DAVID BEYER (CONTACT/OWNER)
REAMS RD/DEL MAR AVENUE INTERS (REAMS RD/DEL MAR AVE in ORLANDO, FL)
National Pollutant Discharge Elimination System NON-MAJOR (Tracking pollutant discharge elimination systems) - permit Organizations: KEITH BASS (CONTACT/OWNER)
GOLDENROD VILLAGE COMMERCIAL C (4751 S. GOLDENROD ROAD in ORLANDO, FL)
National Pollutant Discharge Elimination System NON-MAJOR (Tracking pollutant discharge elimination systems) - permit Organizations: ORESTES DULZAIDES (CONTACT/OWNER)
GOLDENROD VILLAGE CONDOMINIUMS (4751 S. GOLDENROD ROAD in ORLANDO, FL)
National Pollutant Discharge Elimination System NON-MAJOR (Tracking pollutant discharge elimination systems) - permit Organizations: NADEEM SHEIKH (CONTACT/OWNER)
GRANDVIEW TOWNHOMES (10106 WINTER GARDEN VINELAND R in ORLANDO, FL)
National Pollutant Discharge Elimination System NON-MAJOR (Tracking pollutant discharge elimination systems) - permit Organizations: ART KOZIK (CONTACT/OWNER)
LAKE BURDEN SOUTH CONDOS (11651 WINTER GARDEN VINELAND R in ORLANDO, FL)
National Pollutant Discharge Elimination System NON-MAJOR (Tracking pollutant discharge elimination systems) - permit Organizations: BRIAN POTTS (CONTACT/OWNER)
LAKES OF WINDERMERE PHASE 2B (12642 OVERSTREET RD in ORLANDO, FL)
National Pollutant Discharge Elimination System NON-MAJOR (Tracking pollutant discharge elimination systems) - permit Organizations: MARY GEHRHARDT (CONTACT/OWNER)
LAKES OF WINDERMERE, PHASE 2C (13011 OVERSTREET RD in ORLANDO, FL)
National Pollutant Discharge Elimination System NON-MAJOR (Tracking pollutant discharge elimination systems) - permit Organizations: MARY GEHRHARDT (CONTACT/OWNER)
MERCEDES-BENZ AT MILLENIA (N. SIDE OF MILLENIA BLVD., E. in ORLANDO, FL)
National Pollutant Discharge Elimination System NON-MAJOR (Tracking pollutant discharge elimination systems) - permit Organizations: JOHN DAGROSA (CONTACT/OWNER)
OLD NAVY AT MILLENIA MALL (SW CONROY RD & EASTGATE DR in ORLANDO, FL)
National Pollutant Discharge Elimination System NON-MAJOR (Tracking pollutant discharge elimination systems) - permit Organizations: SCOTT SMITH (CONTACT/OWNER)
Housing units lacking complete kitchen facilities: 3.0%
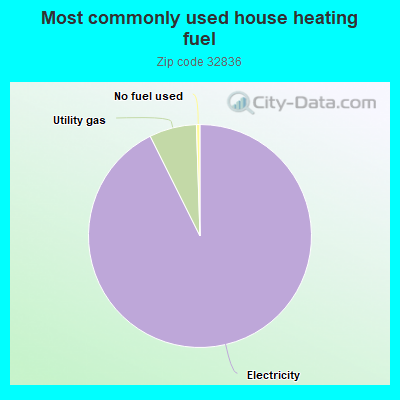
91.9%Electricity
6.8%Utility gas
0.5%No fuel used
Population in 1990: 21,329.
Place of birth for U.S.-born residents:
This state: 4,939
Northeast: 3,312
Midwest: 2,599
South: 2,109
West: 832
34% of the 32836 zip code residents lived in the same house 5 years ago. Out of people who lived in different houses, 37% lived in this county. Out of people who lived in different counties, 50% lived in Florida.
80% of the 32836 zip code residents lived in the same house 1 year ago. Out of people who lived in different houses, 34% moved from this county. Out of people who lived in different houses, 14% moved from different county within same state. Out of people who lived in different houses, 39% moved from different state. Out of people who lived in different houses, 15% moved from abroad.
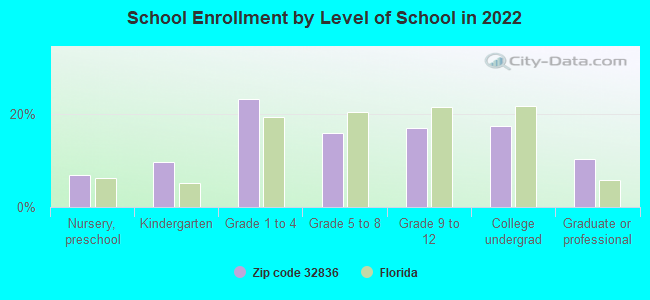
Private vs. public school enrollment:
Students in private schools in grades 1 to 8 (elementary and middle school): 337
Here:
16.3%
Florida:
15.8%
Students in private schools in grades 9 to 12 (high school): 95
Here:
10.7%
Florida:
12.9%
Students in private undergraduate colleges: 204
Here:
22.2%
Florida:
23.6%
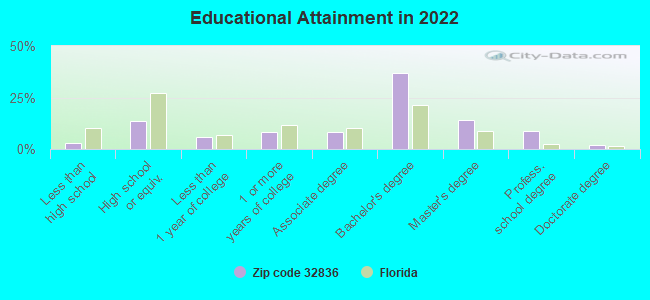
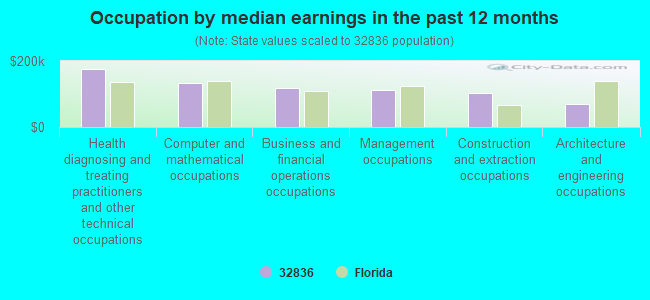
Occupation by median earnings in the past 12 months ($)
176,504Health diagnosing and treating practitioners and other technical occupations
133,937Computer and mathematical occupations
118,523Business and financial operations occupations
111,972Management occupations
103,718Construction and extraction occupations
70,828Architecture and engineering occupations
Companies with federal contracts located in this zip code (ORLANDO, FL):
INTERSTATE HOTELS & RESORTS IN (12205 S APOPKA VINELAND R) : $513,861 in 25 contractsfrom 2000 to 2006
Contracts for Military Personnel Recruitment, Lodging - Hotel/Motel, Other Education and Training Services, Lease or Rental of Facilities -- Conference Space and Facilities, and moreby Army, Transportation Security Administration, Federal Law Enforcement Training Center (disused code, now 7015), Alcohol and Tobacco Tax and Trade Bureau, and others Signed by year:2000: $56,000; 2001: $44,897; 2002: $30,000; 2003: $164,717; 2004: $74,325; 2005: $34,621; 2006: $109,301.
Biggest contracts:
$129,050 with Army for Military Personnel Recruitment. Signed on 2003-02-21. Completion date: 2003-03-07.
$106,693 with Transportation Security Administration for Lodging - Hotel/Motel. Signed on 2006-04-04. Effective on 2006-06-18. Completion date: 2006-06-23.
$42,897 with Army for Lodging - Hotel/Motel. Signed on 2001-09-28. Completion date: 2001-10-19.
$30,000 with Federal Law Enforcement Training Center (disused code, now 7015) for Lodging - Hotel/Motel. Signed on 2002-01-15. Completion date: 2002-02-15.
TACTICAL INTELLIGENCE & INVEST (9152 PHILLIPS GROVE TER; small business) : $255,850 in 5 contractsfrom 2004 to 2005
Contracts for Other Education and Training Services, Intelligence Services, Vocational/Technical by Army Signed by year:2000: $0; 2001: $0; 2002: $0; 2003: $0; 2004: $95,000; 2005: $160,850; 2006: $0.
Biggest contracts:
$95,000 with Army for Other Education and Training Services. Taking place in GA. Signed on 2004-12-28. Completion date: 2005-01-15.
$50,675 with Army for Intelligence Services. Signed on 2005-11-08. Completion date: 2005-10-28.
$49,325, same as above.Signed on 2005-10-26. Completion date: 2005-10-28.
$37,000 with Army for Vocational/Technical. Taking place in TX. Signed on 2005-08-24. Completion date: 2005-08-27.
GLOBAL INSIGHTS, INC (8900 ELLIOTTS COURT; small business) : $59,891 in 2 contractsin 2003
$59,891 with Army for Education Services. Signed on 2003-02-24. Completion date: 2003-11-26.
$0, same as above.Signed on 2003-02-24. Completion date: 2003-11-26.
CSA-7 LAKE LLC (12490 APOPKA-VINELAND RD; small business) : $2,599 in 2 contractsin 2006
$3,184 with Army for Lease or Rental of Facilities -- Conference Space and Facilities. Signed on 2006-03-02. Completion date: 2006-05-31.
-$585, same as above.Signed on 2006-04-20. Completion date: 2006-05-31.
Top industries in this zip code by the number of employees in 2005:
Health Care and Social Assistance: Offices of Physicians (except Mental Health Specialists) (10-19: 4, 5-9: 4, 1-4: 17)
Administrative and Support and Waste Management and Remediation Services: Janitorial Services (50-99: 1, 5-9: 1)
Other Services (except Public Administration): Other Similar Organizations (except Business, Professional, Labor, and Political Organizations) (50-99: 1)
Accommodation and Food Services: Snack and Nonalcoholic Beverage Bars (20-49: 1, 10-19: 2, 5-9: 1, 1-4: 1)
Real Estate and Rental and Leasing: Offices of Real Estate Agents and Brokers (5-9: 1, 1-4: 23)
People in group quarters in 2010:
25 people in workers' group living quarters and job corps centers
Fatal accident statistics in 2014:
Fatal accident count: 1
Vehicles involved in fatal accidents: 2
Fatal accidents caused by drunken drivers: 0
Fatalities: 1
Persons involved in fatal accidents: 3
Pedestrians involved in fatal accidents: 0
Fatal accident statistics in 2013:
Fatal accident count: 1
Vehicles involved in fatal accidents: 1
Fatal accidents caused by drunken drivers: 0
Fatalities: 1
Persons involved in fatal accidents: 1
Pedestrians involved in fatal accidents: 1
Home Mortgage Disclosure Act Aggregated Statistics For Year 2009 (Based on 6 partial tracts)
A) FHA, FSA/RHS & VA Home Purchase Loans
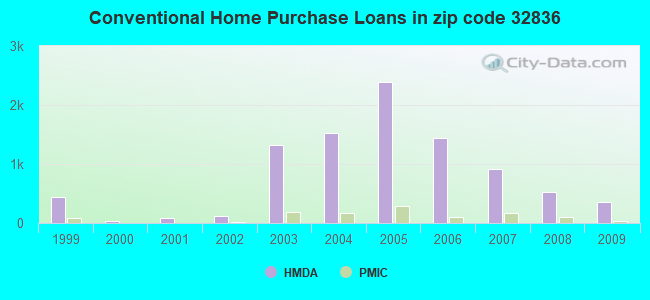
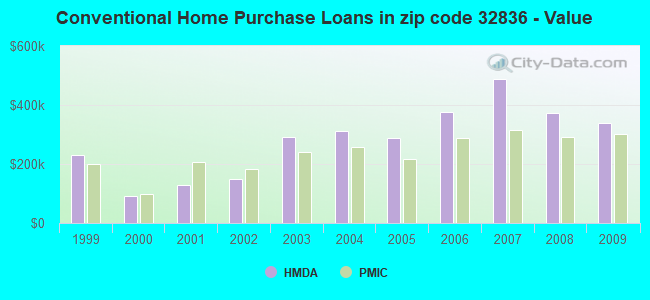
B) Conventional Home Purchase Loans
C) Refinancings
D) Home Improvement Loans
F) Non-occupant Loans on < 5 Family Dwellings (A B C & D)
G) Loans On Manufactured Home Dwelling (A B C & D)
Number
Average Value
Number
Average Value
Number
Average Value
Number
Average Value
Number
Average Value
Number
Average Value
LOANS ORIGINATED
123
$257,537
355
$338,900
499
$295,927
10
$104,481
122
$225,953
7
$39,677
APPLICATIONS APPROVED, NOT ACCEPTED
9
$260,004
31
$307,429
65
$336,549
4
$75,370
14
$275,826
5
$47,198
APPLICATIONS DENIED
18
$254,964
98
$305,734
237
$321,817
19
$123,005
72
$238,222
5
$49,376
APPLICATIONS WITHDRAWN
11
$230,474
57
$364,631
113
$340,731
7
$299,997
24
$240,742
0
$0
FILES CLOSED FOR INCOMPLETENESS
7
$219,979
17
$367,948
51
$323,876
3
$327,957
5
$231,822
2
$74,415
Aggregated Statistics For Year 2008 (Based on 6 partial tracts)
A) FHA, FSA/RHS & VA Home Purchase Loans
B) Conventional Home Purchase Loans
C) Refinancings
D) Home Improvement Loans
E) Loans on Dwellings For 5+ Families
F) Non-occupant Loans on < 5 Family Dwellings (A B C & D)
G) Loans On Manufactured Home Dwelling (A B C & D)
Number
Average Value
Number
Average Value
Number
Average Value
Number
Average Value
Number
Average Value
Number
Average Value
Number
Average Value
LOANS ORIGINATED
94
$248,697
518
$374,336
322
$375,323
14
$131,314
0
$0
146
$290,706
9
$58,150
APPLICATIONS APPROVED, NOT ACCEPTED
10
$258,805
104
$377,270
86
$289,629
7
$102,794
0
$0
36
$386,461
3
$53,627
APPLICATIONS DENIED
20
$205,414
168
$377,316
246
$402,156
26
$197,795
1
$1,060,840
103
$239,938
10
$66,817
APPLICATIONS WITHDRAWN
17
$226,772
98
$397,762
88
$340,290
4
$48,220
4
$268,400
43
$291,310
2
$59,645
FILES CLOSED FOR INCOMPLETENESS
4
$135,615
33
$389,283
39
$430,711
1
$199,130
0
$0
21
$396,759
0
$0
Aggregated Statistics For Year 2007 (Based on 6 partial tracts)
A) FHA, FSA/RHS & VA Home Purchase Loans
B) Conventional Home Purchase Loans
C) Refinancings
D) Home Improvement Loans
F) Non-occupant Loans on < 5 Family Dwellings (A B C & D)
G) Loans On Manufactured Home Dwelling (A B C & D)
Number
Average Value
Number
Average Value
Number
Average Value
Number
Average Value
Number
Average Value
Number
Average Value
LOANS ORIGINATED
6
$214,003
908
$487,588
641
$381,061
60
$199,968
309
$316,448
11
$60,905
APPLICATIONS APPROVED, NOT ACCEPTED
0
$0
242
$381,111
185
$415,912
23
$165,718
98
$296,942
3
$50,100
APPLICATIONS DENIED
2
$146,230
399
$422,483
457
$467,348
48
$142,913
195
$357,883
12
$69,240
APPLICATIONS WITHDRAWN
3
$147,423
138
$383,833
176
$419,760
14
$266,061
50
$249,711
2
$20,015
FILES CLOSED FOR INCOMPLETENESS
0
$0
50
$401,501
48
$467,193
4
$713,922
11
$265,942
0
$0
Aggregated Statistics For Year 2006 (Based on 6 partial tracts)
A) FHA, FSA/RHS & VA Home Purchase Loans
B) Conventional Home Purchase Loans
C) Refinancings
D) Home Improvement Loans
E) Loans on Dwellings For 5+ Families
F) Non-occupant Loans on < 5 Family Dwellings (A B C & D)
G) Loans On Manufactured Home Dwelling (A B C & D)
Number
Average Value
Number
Average Value
Number
Average Value
Number
Average Value
Number
Average Value
Number
Average Value
Number
Average Value
LOANS ORIGINATED
0
$0
1,434
$375,047
838
$397,417
75
$234,064
0
$0
529
$311,076
17
$55,902
APPLICATIONS APPROVED, NOT ACCEPTED
0
$0
279
$377,089
145
$388,245
19
$285,701
0
$0
104
$277,477
5
$63,918
APPLICATIONS DENIED
0
$0
552
$401,877
362
$409,721
61
$311,092
1
$121,000
174
$306,065
22
$53,748
APPLICATIONS WITHDRAWN
1
$195,340
290
$408,322
282
$393,967
13
$441,343
0
$0
118
$320,189
0
$0
FILES CLOSED FOR INCOMPLETENESS
0
$0
79
$420,826
74
$390,632
9
$139,769
0
$0
41
$333,398
0
$0
Aggregated Statistics For Year 2005 (Based on 6 partial tracts)
A) FHA, FSA/RHS & VA Home Purchase Loans
B) Conventional Home Purchase Loans
C) Refinancings
D) Home Improvement Loans
F) Non-occupant Loans on < 5 Family Dwellings (A B C & D)
G) Loans On Manufactured Home Dwelling (A B C & D)
Number
Average Value
Number
Average Value
Number
Average Value
Number
Average Value
Number
Average Value
Number
Average Value
LOANS ORIGINATED
2
$182,755
2,390
$286,991
927
$376,809
54
$179,163
1,135
$198,376
15
$120,643
APPLICATIONS APPROVED, NOT ACCEPTED
0
$0
302
$312,575
125
$332,405
15
$131,681
117
$188,720
4
$83,968
APPLICATIONS DENIED
0
$0
655
$280,809
324
$349,169
54
$167,140
315
$182,317
22
$118,547
APPLICATIONS WITHDRAWN
1
$60,230
346
$324,302
301
$315,685
32
$217,237
135
$200,610
1
$27,130
FILES CLOSED FOR INCOMPLETENESS
0
$0
106
$310,620
84
$304,220
5
$142,702
45
$218,564
0
$0
Aggregated Statistics For Year 2004 (Based on 6 partial tracts)
A) FHA, FSA/RHS & VA Home Purchase Loans
B) Conventional Home Purchase Loans
C) Refinancings
D) Home Improvement Loans
E) Loans on Dwellings For 5+ Families
F) Non-occupant Loans on < 5 Family Dwellings (A B C & D)
G) Loans On Manufactured Home Dwelling (A B C & D)
Number
Average Value
Number
Average Value
Number
Average Value
Number
Average Value
Number
Average Value
Number
Average Value
Number
Average Value
LOANS ORIGINATED
4
$169,428
1,524
$312,165
663
$306,833
57
$167,788
2
$30,442,940
293
$278,484
20
$53,590
APPLICATIONS APPROVED, NOT ACCEPTED
1
$72,170
170
$344,728
126
$319,925
16
$95,956
0
$0
26
$339,920
3
$54,260
APPLICATIONS DENIED
2
$230,870
277
$333,802
266
$319,941
57
$106,899
0
$0
49
$214,295
15
$46,819
APPLICATIONS WITHDRAWN
3
$125,773
169
$297,728
288
$283,754
19
$166,029
0
$0
39
$230,659
3
$112,750
FILES CLOSED FOR INCOMPLETENESS
1
$161,690
69
$351,771
60
$321,792
7
$46,481
0
$0
17
$500,417
0
$0
Aggregated Statistics For Year 2003 (Based on 6 partial tracts)
A) FHA, FSA/RHS & VA Home Purchase Loans
B) Conventional Home Purchase Loans
C) Refinancings
D) Home Improvement Loans
F) Non-occupant Loans on < 5 Family Dwellings (A B C & D)
Number
Average Value
Number
Average Value
Number
Average Value
Number
Average Value
Number
Average Value
LOANS ORIGINATED
9
$182,082
1,321
$291,846
1,744
$246,168
44
$40,740
237
$268,516
APPLICATIONS APPROVED, NOT ACCEPTED
0
$0
129
$291,476
218
$251,110
17
$81,823
49
$193,035
APPLICATIONS DENIED
1
$84,100
174
$321,360
446
$245,766
30
$112,723
40
$135,844
APPLICATIONS WITHDRAWN
1
$141,080
154
$320,544
315
$246,711
4
$153,238
30
$294,281
FILES CLOSED FOR INCOMPLETENESS
0
$0
40
$312,446
84
$288,396
5
$77,718
8
$163,765
Aggregated Statistics For Year 2002 (Based on 2 partial tracts)
A) FHA, FSA/RHS & VA Home Purchase Loans
B) Conventional Home Purchase Loans
C) Refinancings
D) Home Improvement Loans
F) Non-occupant Loans on < 5 Family Dwellings (A B C & D)
Number
Average Value
Number
Average Value
Number
Average Value
Number
Average Value
Number
Average Value
LOANS ORIGINATED
34
$134,421
115
$147,658
33
$139,086
2
$137,005
13
$154,474
APPLICATIONS APPROVED, NOT ACCEPTED
0
$0
15
$102,551
8
$108,112
1
$20,620
3
$70,720
APPLICATIONS DENIED
4
$143,248
21
$88,625
21
$96,350
2
$8,410
4
$98,482
APPLICATIONS WITHDRAWN
4
$123,170
23
$143,341
6
$104,812
0
$0
3
$137,277
FILES CLOSED FOR INCOMPLETENESS
0
$0
3
$236,753
3
$175,080
0
$0
0
$0
Aggregated Statistics For Year 2001 (Based on 2 partial tracts)
A) FHA, FSA/RHS & VA Home Purchase Loans
B) Conventional Home Purchase Loans
C) Refinancings
D) Home Improvement Loans
F) Non-occupant Loans on < 5 Family Dwellings (A B C & D)
Number
Average Value
Number
Average Value
Number
Average Value
Number
Average Value
Number
Average Value
LOANS ORIGINATED
15
$128,198
84
$128,067
26
$167,768
1
$18,990
9
$112,861
APPLICATIONS APPROVED, NOT ACCEPTED
0
$0
8
$98,618
4
$92,920
1
$40,700
0
$0
APPLICATIONS DENIED
2
$101,735
21
$66,507
12
$94,729
1
$141,080
2
$45,305
APPLICATIONS WITHDRAWN
2
$144,330
17
$157,386
4
$94,005
1
$22,250
1
$54,260
FILES CLOSED FOR INCOMPLETENESS
0
$0
2
$181,500
0
$0
1
$8,140
0
$0
Aggregated Statistics For Year 2000 (Based on 2 partial tracts)
A) FHA, FSA/RHS & VA Home Purchase Loans
B) Conventional Home Purchase Loans
C) Refinancings
D) Home Improvement Loans
F) Non-occupant Loans on < 5 Family Dwellings (A B C & D)
Number
Average Value
Number
Average Value
Number
Average Value
Number
Average Value
Number
Average Value
LOANS ORIGINATED
1
$51,550
37
$93,136
5
$60,554
2
$49,920
3
$71,443
APPLICATIONS APPROVED, NOT ACCEPTED
0
$0
11
$89,973
3
$67,823
1
$32,560
0
$0
APPLICATIONS DENIED
0
$0
14
$52,129
11
$74,879
3
$12,300
2
$53,715
APPLICATIONS WITHDRAWN
0
$0
5
$140,858
3
$62,580
0
$0
0
$0
FILES CLOSED FOR INCOMPLETENESS
0
$0
1
$21,700
1
$218,130
0
$0
1
$98,750
Aggregated Statistics For Year 1999 (Based on 2 partial tracts)
A) FHA, FSA/RHS & VA Home Purchase Loans
B) Conventional Home Purchase Loans
C) Refinancings
D) Home Improvement Loans
F) Non-occupant Loans on < 5 Family Dwellings (A B C & D)
2003 - 2018 National Fire Incident Reporting System (NFIRS) incidents
Based on the data from the years 2003 - 2018 the average number of fire incidents per year is 22. The highest number of reported fire incidents - 49 took place in 2006, and the least - 3 in 2016. The data has a decreasing trend.
When looking into fire subcategories, the most reports belonged to: Structure Fires (40.3%), and Outside Fires (27.3%).
Fire incident types reported to NFIRS in Zip Code 32836


+$909
-$6,005
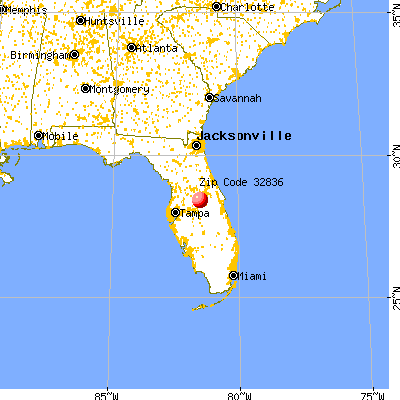
 Nearest zip codes: 32821, 32830, 32819, 34786, 32837, 32835.


 Based on the data from the years 2003 - 2018 the average number of fire incidents per year is 22. The highest number of reported fire incidents - 49 took place in 2006, and the least - 3 in 2016. The data has a decreasing trend.
 When looking into fire subcategories, the most reports belonged to: Structure Fires (40.3%), and Outside Fires (27.3%).