Estimated zip code population in 2022: 46,865 Zip code population in 2010: 41,722 Zip code population in 2000: 40,807
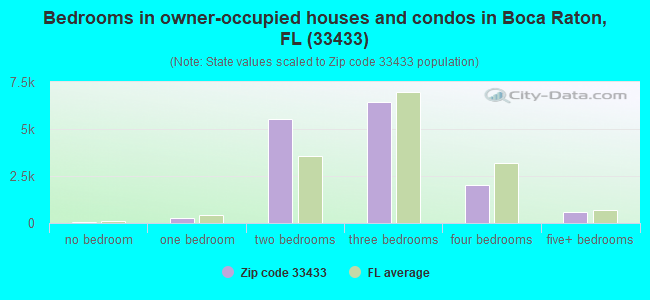
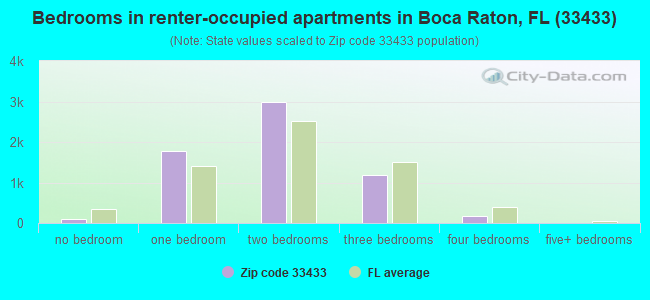
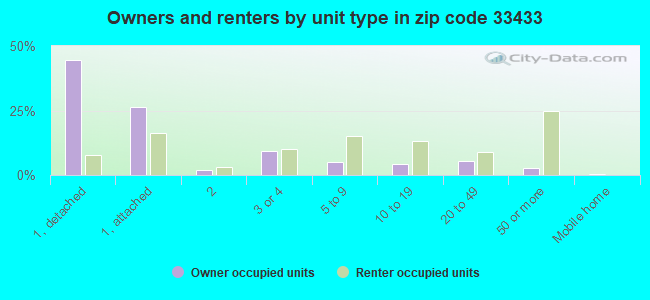
Houses and condos: 24,102 Renter-occupied apartments: 6,225
% of renters here:
29%
State:
33%
March 2022 cost of living index in zip code 33433: 102.8 (near average, U.S. average is 100)
Land area: 9.5 sq. mi. Water area: 0.0 sq. mi.
Population density: 4,939 people per square mile
(average).
OSM Map
General Map
Google Map
MSN Map
OSM Map
General Map
Google Map
MSN Map
OSM Map
General Map
Google Map
MSN Map
OSM Map
General Map
Google Map
MSN Map
Please wait while loading the map...
Real estate property taxes paid for housing units in 2022:
This zip code:
0.8% ($3,809)
Florida:
0.7% ($2,529)
Median real estate property taxes paid for housing units with mortgages in 2022: $3,837 (0.8%) Median real estate property taxes paid for housing units with no mortgage in 2022: $3,751 (0.8%)
Estimated median house/condo value in 2022: $463,772
33433:
$463,772
Florida:
$354,100
According to our research of Florida and other state lists, there were 10 registered sex offenders living in 33433 zip code as of April 18, 2024. The ratio of all residents to sex offenders in zip code 33433 is 4,305 to 1. The ratio of registered sex offenders to all residents in this zip code is much lower than the state average.
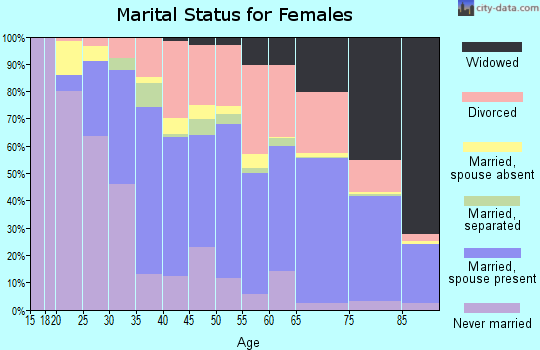
Median resident age:
This zip code:
50.3 years
Florida median age:
42.7 years
Average household size:
This zip code:
2.2 people
Florida:
2.5 people
Averages for the 2020 tax year for zip code 33433, filed in 2021:
Average Adjusted Gross Income (AGI) in 2020: $104,359 (Individual Income Tax Returns)
Here:
$104,359
State:
$82,200
Salary/wage: $73,887 (reported on 65.6% of returns)
Here:
$73,887
State:
$58,347
(% of AGI for various income ranges: 1043.1% for AGIs below $25k, 3441.9% for AGIs $25k-50k, 6383.5% for AGIs $50k-75k, 9842.5% for AGIs $75k-100k, 17498.6% for AGIs $100k-200k, 85138.2% for AGIs over 200k)
Taxable interest for individuals: $4,342 (reported on 39.1% of returns)
This zip code:
$4,342
Florida:
$4,272
(% of AGI for various income ranges: 55.9% for AGIs below $25k, 83.0% for AGIs $25k-50k, 172.8% for AGIs $50k-75k, 285.1% for AGIs $75k-100k, 508.6% for AGIs $100k-200k, 3783.1% for AGIs over 200k)
Ordinary dividends: $14,080 (reported on 35.9% of returns)
Here:
$14,080
State:
$15,863
(% of AGI for various income ranges: 121.8% for AGIs below $25k, 214.5% for AGIs $25k-50k, 437.1% for AGIs $50k-75k, 800.8% for AGIs $75k-100k, 1561.8% for AGIs $100k-200k, 12112.7% for AGIs over 200k)
Net capital gain/loss in AGI: +$25,919 (reported on 36.0% of returns)
Here:
+$25,919
State:
+$62,983
(% of AGI for various income ranges: 24.5% for AGIs below $25k, 90.5% for AGIs $25k-50k, 295.5% for AGIs $50k-75k, 604.8% for AGIs $75k-100k, 1475.0% for AGIs $100k-200k, 35084.3% for AGIs over 200k)
Profit/loss from business: +$14,168 (reported on 25.9% of returns)
Here:
+$14,168
State:
+$9,719
(% of AGI for various income ranges: 357.8% for AGIs below $25k, 414.4% for AGIs $25k-50k, 369.8% for AGIs $50k-75k, 463.9% for AGIs $75k-100k, 859.7% for AGIs $100k-200k, 5991.2% for AGIs over 200k)
Taxable individual retirement arrangement distribution: $25,201 (reported on 13.9% of returns)
33433:
$25,201
Florida:
$24,823
(% of AGI for various income ranges: 115.1% for AGIs below $25k, 185.6% for AGIs $25k-50k, 437.7% for AGIs $50k-75k, 875.4% for AGIs $75k-100k, 1488.5% for AGIs $100k-200k, 5122.0% for AGIs over 200k)
Self-employed (Keogh) retirement plans: $26,362 (reported on 0.7% of returns)
33433:
$26,362
Florida:
$29,694
(% of AGI for various income ranges: 13.6% for AGIs $25k-50k, 41.2% for AGIs $100k-200k, 631.4% for AGIs over 200k)
Total itemized deductions: $44,669 (reported on 14.1% of returns)
Here:
$44,669
State:
$45,393
(% of AGI for various income ranges: 186.2% for AGIs below $25k, 358.8% for AGIs $25k-50k, 714.8% for AGIs $50k-75k, 1137.1% for AGIs $75k-100k, 1808.3% for AGIs $100k-200k, 13685.7% for AGIs over 200k)
Charity contributions: $14,543 (reported on 12.0% of returns)
Here:
$14,543
State:
$20,178
(% of AGI for various income ranges: 8.2% for AGIs below $25k, 30.2% for AGIs $25k-50k, 69.2% for AGIs $50k-75k, 140.4% for AGIs $75k-100k, 353.1% for AGIs $100k-200k, 6063.5% for AGIs over 200k)
Taxes paid: $6,045 (reported on 14.0% of returns)
33433:
$6,045
State:
$6,967
(% of AGI for various income ranges: 23.9% for AGIs below $25k, 50.9% for AGIs $25k-50k, 106.7% for AGIs $50k-75k, 183.9% for AGIs $75k-100k, 320.6% for AGIs $100k-200k, 1429.4% for AGIs over 200k)
Earned income credit: $2,018 (reported on 11.6% of returns)
Here:
$2,018
State:
$2,306
(% of AGI for various income ranges: 85.2% for AGIs below $25k, 64.0% for AGIs $25k-50k, 0.6% for AGIs $50k-75k)
Percentage of individuals using paid preparers for their 2020 taxes: 91.7%
Here:
92%
State:
92%
(% for various income ranges: 90.1% for AGIs below $25k, 93.1% for AGIs $25k-50k, 92.1% for AGIs $50k-75k, 91.3% for AGIs $75k-100k, 92.0% for AGIs $100k-200k, 93.1% for AGIs over 200k)
Averages for the 2012 tax year for zip code 33433, filed in 2013:
Average Adjusted Gross Income (AGI) in 2012: $80,185 (Individual Income Tax Returns)
Here:
$80,185
State:
$60,316
Salary/wage: $59,436 (reported on 66.7% of returns)
Here:
$59,436
State:
$45,277
(% of AGI for various income ranges: 57.7% for AGIs below $25k, 67.5% for AGIs $25k-50k, 62.7% for AGIs $50k-75k, 56.0% for AGIs $75k-100k, 55.5% for AGIs $100k-200k, 35.8% for AGIs over 200k)
Taxable interest for individuals: $5,209 (reported on 43.7% of returns)
This zip code:
$5,209
Florida:
$3,587
(% of AGI for various income ranges: 4.1% for AGIs below $25k, 2.2% for AGIs $25k-50k, 2.6% for AGIs $50k-75k, 3.3% for AGIs $75k-100k, 2.9% for AGIs $100k-200k, 2.7% for AGIs over 200k)
Ordinary dividends: $13,602 (reported on 36.5% of returns)
Here:
$13,602
State:
$12,831
(% of AGI for various income ranges: 8.0% for AGIs below $25k, 4.6% for AGIs $25k-50k, 5.0% for AGIs $50k-75k, 5.6% for AGIs $75k-100k, 6.3% for AGIs $100k-200k, 6.7% for AGIs over 200k)
Net capital gain/loss in AGI: +$23,357 (reported on 35.0% of returns)
Here:
+$23,357
State:
+$33,493
(% of AGI for various income ranges: 0.1% for AGIs $25k-50k, 0.6% for AGIs $50k-75k, 1.4% for AGIs $75k-100k, 2.5% for AGIs $100k-200k, 22.7% for AGIs over 200k)
Profit/loss from business: +$13,873 (reported on 20.4% of returns)
Here:
+$13,873
State:
+$10,012
(% of AGI for various income ranges: 15.2% for AGIs below $25k, 5.2% for AGIs $25k-50k, 2.8% for AGIs $50k-75k, 2.6% for AGIs $75k-100k, 2.5% for AGIs $100k-200k, 2.6% for AGIs over 200k)
Taxable individual retirement arrangement distribution: $25,411 (reported on 19.6% of returns)
33433:
$25,411
Florida:
$21,544
(% of AGI for various income ranges: 6.2% for AGIs below $25k, 4.3% for AGIs $25k-50k, 5.4% for AGIs $50k-75k, 7.5% for AGIs $75k-100k, 8.4% for AGIs $100k-200k, 5.5% for AGIs over 200k)
Self-employment retirement plans: $19,360 (reported on 0.7% of returns)
33433:
$19,360
Florida:
$20,611
(% of AGI for various income ranges: 0.2% for AGIs below $25k, 0.1% for AGIs $50k-75k, 0.1% for AGIs $100k-200k, 0.3% for AGIs over 200k)
Total itemized deductions: $27,974 (20% of AGI, reported on 39.7% of returns)
Here:
$27,974
State:
$25,533
Here:
19.9% of AGI
State:
18.0% of AGI
(% of AGI for various income ranges: 23.0% for AGIs below $25k, 17.2% for AGIs $25k-50k, 16.2% for AGIs $50k-75k, 16.0% for AGIs $75k-100k, 14.5% for AGIs $100k-200k, 10.5% for AGIs over 200k)
Charity contributions: $4,811 (reported on 34.3% of returns)
Here:
$4,811
State:
$5,698
(% of AGI for various income ranges: 1.3% for AGIs below $25k, 1.4% for AGIs $25k-50k, 1.6% for AGIs $50k-75k, 1.7% for AGIs $75k-100k, 2.1% for AGIs $100k-200k, 2.5% for AGIs over 200k)
Taxes paid: $6,408 (reported on 38.9% of returns)
33433:
$6,408
State:
$6,203
(% of AGI for various income ranges: 3.4% for AGIs below $25k, 3.0% for AGIs $25k-50k, 3.1% for AGIs $50k-75k, 3.2% for AGIs $75k-100k, 3.4% for AGIs $100k-200k, 2.9% for AGIs over 200k)
Earned income credit: $1,944 (reported on 11.9% of returns)
Here:
$1,944
State:
$2,372
(% of AGI for various income ranges: 4.4% for AGIs below $25k, 0.6% for AGIs $25k-50k)
Percentage of individuals using paid preparers for their 2012 taxes: 67.2%
Here:
67%
State:
54%
(% for various income ranges: 63.9% for AGIs below $25k, 64.6% for AGIs $25k-50k, 66.0% for AGIs $50k-75k, 69.6% for AGIs $75k-100k, 72.2% for AGIs $100k-200k, 84.9% for AGIs over 200k)
Averages for the 2004 tax year for zip code 33433, filed in 2005:
Average Adjusted Gross Income (AGI) in 2004: $71,730 (Individual Income Tax Returns)
Here:
$71,730
State:
$50,523
Salary/wage: $55,163 (reported on 65.5% of returns)
Here:
$55,163
State:
$39,563
(% of AGI for various income ranges: 56.0% for AGIs $10k-25k, 65.0% for AGIs $25k-50k, 56.8% for AGIs $50k-75k, 56.2% for AGIs $75k-100k, 42.0% for AGIs over 100k)
Taxable interest for individuals: $6,398 (reported on 60.4% of returns)
This zip code:
$6,398
Florida:
$3,211
(% of AGI for various income ranges: 8.6% for AGIs $10k-25k, 5.3% for AGIs $25k-50k, 5.1% for AGIs $50k-75k, 5.4% for AGIs $75k-100k, 4.8% for AGIs over 100k)
Taxable dividends: $9,805 (reported on 46.6% of returns)
Here:
$9,805
State:
$6,129
(% of AGI for various income ranges: 7.5% for AGIs $10k-25k, 5.1% for AGIs $25k-50k, 6.5% for AGIs $50k-75k, 5.6% for AGIs $75k-100k, 6.2% for AGIs over 100k)
Net capital gain/loss: +$22,649 (reported on 44.4% of returns)
Here:
+$22,649
State:
+$27,205
(% of AGI for various income ranges: -0.3% for AGIs $10k-25k, 0.5% for AGIs $25k-50k, 1.6% for AGIs $50k-75k, 3.1% for AGIs $75k-100k, 21.4% for AGIs over 100k)
Profit/loss from business: +$13,759 (reported on 18.3% of returns)
Here:
+$13,759
State:
+$10,634
(% of AGI for various income ranges: 10.1% for AGIs $10k-25k, 4.3% for AGIs $25k-50k, 3.9% for AGIs $50k-75k, 2.2% for AGIs $75k-100k, 2.7% for AGIs over 100k)
IRA payment deduction: $3,581 (reported on 4.1% of returns)
33433:
$3,581
Florida:
$3,082
(% of AGI for various income ranges: 0.4% for AGIs $10k-25k, 0.4% for AGIs $25k-50k, 0.3% for AGIs $50k-75k, 0.3% for AGIs $75k-100k, 0.1% for AGIs over 100k)
Self-employed pension: $16,943 (reported on 0.9% of returns)
Here:
$16,943
Florida:
$15,857
(% of AGI for various income ranges: 0.2% for AGIs $25k-50k, 0.2% for AGIs $50k-75k, 0.2% for AGIs $75k-100k, 0.3% for AGIs over 100k)
Total itemized deductions: $22,173 (20% of AGI, reported on 50.0% of returns)
Here:
$22,173
State:
$20,370
Here:
19.8% of AGI
State:
20.7% of AGI
(% of AGI for various income ranges: 30.9% for AGIs $10k-25k, 22.4% for AGIs $25k-50k, 20.2% for AGIs $50k-75k, 18.1% for AGIs $75k-100k, 10.4% for AGIs over 100k)
Charity contributions deductions: $4,354 (4% of AGI, reported on 44.6% of returns)
Here:
$4,354
State:
$4,064
Here:
3.7% of AGI
State:
3.8% of AGI
(% of AGI for various income ranges: 2.4% for AGIs $10k-25k, 2.2% for AGIs $25k-50k, 2.4% for AGIs $50k-75k, 2.5% for AGIs $75k-100k, 2.8% for AGIs over 100k)
Total tax: $14,909 (reported on 78.9% of returns)
33433:
$14,909
State:
$9,431
(% of AGI for various income ranges: 4.5% for AGIs $10k-25k, 7.3% for AGIs $25k-50k, 10.0% for AGIs $50k-75k, 11.3% for AGIs $75k-100k, 20.7% for AGIs over 100k)
Earned income credit: $1,384 (reported on 7.3% of returns)
Here:
$1,384
State:
$1,808
Percentage of individuals using paid preparers for their 2004 taxes: 69.5%
Here:
69%
State:
60%
(% for various income ranges: 64.5% for AGIs below $10k, 70.0% for AGIs $10k-25k, 67.9% for AGIs $25k-50k, 69.6% for AGIs $50k-75k, 68.1% for AGIs $75k-100k, 77.6% for AGIs over 100k)
Likely homosexual households (counted as self-reported same-sex unmarried-partner households)
Lesbian couples: 0.1% of all households
Gay men: 0.1% of all households
Household received Food Stamps/SNAP in the past 12 months: 538 Household did not receive Food Stamps/SNAP in the past 12 months: 20,750
Women who had a birth in the past 12 months: 301 (287 now married, 25 unmarried) Women who did not have a birth in the past 12 months: 8,435 (4,218 now married, 4,220 unmarried)
Housing units in zip code 33433 with a mortgage: 8,174 (772 second mortgage, 3 home equity loan, 688 both second mortgage and home equity loan) Houses without a mortgage: 280
Median monthly owner costs for units with a mortgage: $2,101 Median monthly owner costs for units without a mortgage: $918
Residents with income below the poverty level in 2022:
This zip code:
8.4%
Whole state:
12.7%
Residents with income below 50% of the poverty level in 2022:
This zip code:
3.9%
Whole state:
6.6%
Median number of rooms in houses and condos:
Here:
5.4
State:
5.9
Median number of rooms in apartments:
Here:
4.1
State:
4.2
Notable locations in this zip code not listed on our city pages
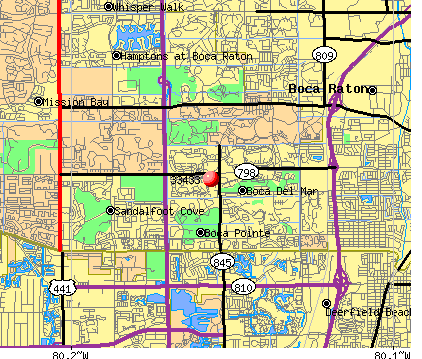
Notable locations in zip code 33433: Baytree Golf Course (A), Baymeadows Golf Club (B), Bay Colony Golf Club (C), Bay Beach Golf Course (D), Baseline Golf Course (E), Banyan Golf Course (F), Fontana Plaza (G), Royal Palm Plaza (H), Fire Station Number 55 (I), Palm Beach County Fire Rescue Station 55 (J). Display/hide their locations on the map
7,125 married couples with children.
1,499 single-parent households (472 men, 1,027 women).
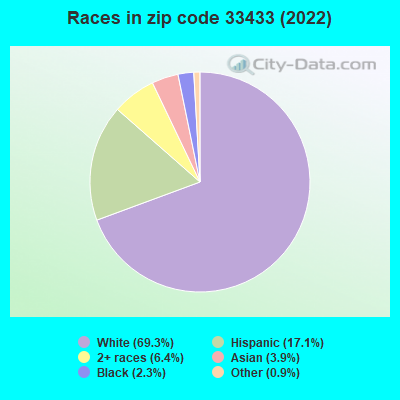
65.7% of residents of 33433 zip code speak English at home.
14.6% of residents speak Spanish at home (61% very well, 24% well, 11% not well, 3% not at all).
16.3% of residents speak other Indo-European language at home (60% very well, 22% well, 14% not well, 4% not at all).
1.6% of residents speak Asian or Pacific Island language at home (58% very well, 28% well, 14% not well).
2.7% of residents speak other language at home (95% very well, 5% well).
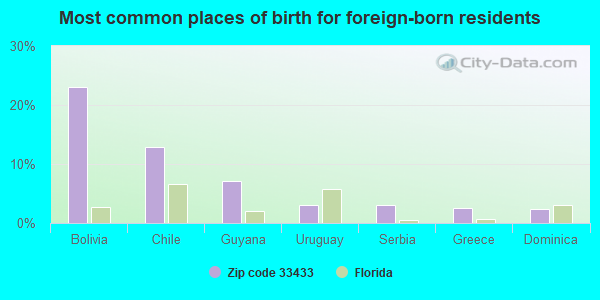
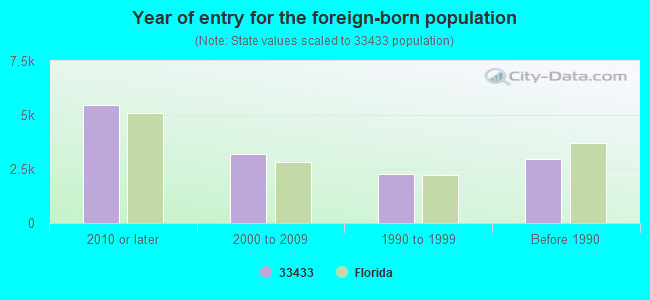
Foreign born population: 13,139 (28.0%) (58.1% of them are naturalized citizens)
Major facilities with environmental interests located in this zip code:
SHELL #100664 (7006 PALMETTO CIRCLE NORTH in BOCA RATON, FL)
STATE MASTER (FDM) - WAFR-FLG912051, INDUSTRIAL WASTEWATER PROGRAM National Pollutant Discharge Elimination System NON-MAJOR (Tracking pollutant discharge elimination systems) - permit Business SIC classification: GASOLINE SERVICE STATIONS Organizations: GROUNDWATER & ENVIRONMENTAL SERVICES, INC. (CONTACT/AGENT)
, SHELL OIL PRODUCTS US/MOTIVA ENTERPRISES LLC (CONTACT/APPLICANT)
, ANNETTE DOKKEN (CONTACT/OWNER)
, SHELL OIL PRODUCTS US/MOTIVA ENTERPRISES LLC (CONTACT/PERMIT)
DEL PRADO ELEMENTARY SCHOOL (7900 DEL PRADO CIR in BOCA RATON, FL)
(National Center for Education Statistics) - STATE ID-1741 Small Quantity Generators, between 100 kg and 1000 kg of hazardous waste/month (Resource Conservation and Recovery Act (tracking hazardous waste)) - notification Organizations: MICHAEL SNYDER, ENVC (CONTACT/OWNER)
, PALM BEACH COUNTY SCHOOL DISTRICT (SCHOOL DISTRICT)
Alternative names: PALM BEACH CO DEL PRADO ELEMENTARY
HAMMOCK POINTE ELEMENTARY SCHOOL (8400 SW 8TH ST in BOCA RATON, FL)
(National Center for Education Statistics) - STATE ID-2081 Organizations: PALM BEACH COUNTY SCHOOL DISTRICT (SCHOOL DISTRICT)
BOCA'S PREMIER DRY CLEANERS INC (21073 POWERLINE ROAD in BOCA RATON, FL)
AIR MINOR (AIRS/AFS) (Resource Conservation and Recovery Act (tracking hazardous waste)) Business SIC classification: DRYCLEANING PLANTS, EXCEPT RUG CLEANING Organizations: BOCAS ELITE DRY CLEANERS INC (CONTACT/OWNER)
Alternative names: BOCAS ELITE DRY CLEANERS, PEACOCK DRY CLEANERS INC, PEACOCK DRY CLEANERS INC
KEREKES PLAZA (NE, JOG RD. & BOYNTON BEACH BL in BOYNTON BEACH, FL)
National Pollutant Discharge Elimination System NON-MAJOR (Tracking pollutant discharge elimination systems) - permit Organizations: JOEL WANTMAN (CONTACT/OWNER)
ALDOS CLEANER (5970 SW 18 STREET in BOCA RATON, FL)
(Resource Conservation and Recovery Act (tracking hazardous waste)) Organizations: SAL CATALDO PRES (CONTACT/OWNER)
JORGEN ANTON CLEANERS (6060 SW 18 ST BAY 117 in BOCA RATON, FL)
AIR MINOR (AIRS/AFS) Business SIC classification: DRYCLEANING PLANTS, EXCEPT RUG CLEANING
CONTINENTAL CONCRETE - BOCA RA (24151 BOCA RIO ROAD in BOCA RATON, FL)
National Pollutant Discharge Elimination System NON-MAJOR (Tracking pollutant discharge elimination systems) - permit
1 HOUR MARTINIZING (21065 JOG ROAD in BOCA RATON, FL)
Small Quantity Generators, between 100 kg and 1000 kg of hazardous waste/month (Resource Conservation and Recovery Act (tracking hazardous waste)) - notification Organizations: GARY DESSLER, PRESIDENT (CONTACT/OWNER)
Housing units lacking complete kitchen facilities: 1.2%
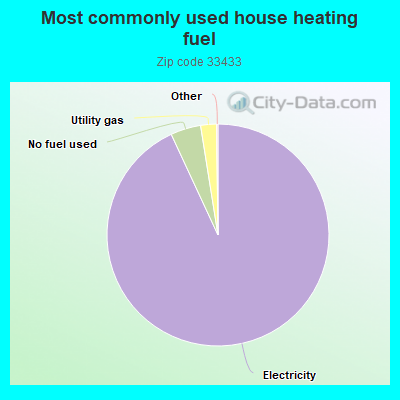
93.0%Electricity
4.4%No fuel used
2.3%Utility gas
Population in 1990: 35,495. Population change in the 1990s: +5,312 (+15.0%).
Place of birth for U.S.-born residents:
This state: 9,942
Northeast: 15,943
Midwest: 3,337
South: 2,744
West: 1,308
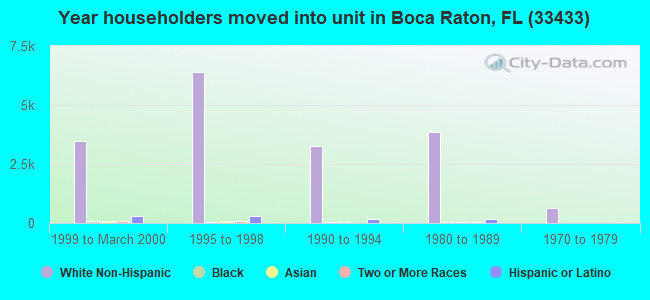
50% of the 33433 zip code residents lived in the same house 5 years ago. Out of people who lived in different houses, 43% lived in this county. Out of people who lived in different counties, 50% lived in Florida.
89% of the 33433 zip code residents lived in the same house 1 year ago. Out of people who lived in different houses, 46% moved from this county. Out of people who lived in different houses, 21% moved from different county within same state. Out of people who lived in different houses, 24% moved from different state. Out of people who lived in different houses, 9% moved from abroad.
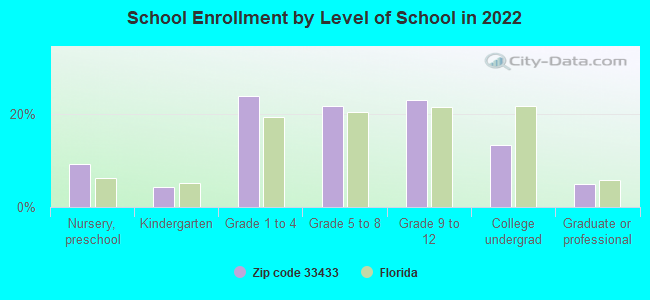
Private vs. public school enrollment:
Students in private schools in grades 1 to 8 (elementary and middle school): 833
Here:
19.9%
Florida:
15.8%
Students in private schools in grades 9 to 12 (high school): 537
Here:
25.5%
Florida:
12.9%
Students in private undergraduate colleges: 415
Here:
33.8%
Florida:
23.6%
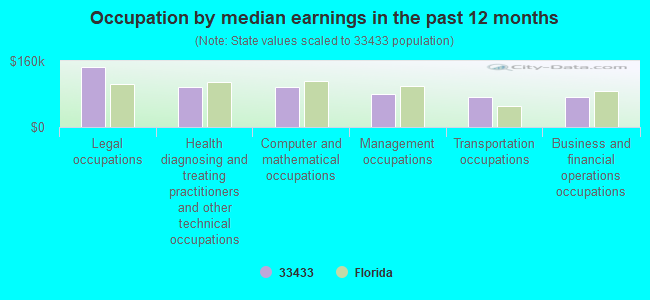
Occupation by median earnings in the past 12 months ($)
145,542Legal occupations
98,130Health diagnosing and treating practitioners and other technical occupations
95,800Computer and mathematical occupations
79,563Management occupations
73,783Transportation occupations
71,614Business and financial operations occupations
Companies with federal contracts located in this zip code (BOCA RATON, FL):
RAPPAPORT, ALAFRED D ESTATE OF (6644 MAPLE LN; small business) : $370,000 in 5 contractsfrom 1999 to 2000
Contracts for Lease or Rental of Facilities -- Office Buildings by Public Buildings Service Signed by year:2000: $296,000; 2001: $0; 2002: $0; 2003: $0; 2004: $0; 2005: $0; 2006: $0.
Biggest contracts:
$74,000 with Public Buildings Service for Lease or Rental of Facilities -- Office Buildings. Taking place in IN. Signed on 2000-12-15. Completion date: 2000-12-15.
$74,000, same as above.Signed on 2000-06-15. Completion date: 2000-06-15.
$74,000, same as above.Signed on 2000-03-15. Completion date: 2000-03-15.
$74,000, same as above.Signed on 2000-09-15. Completion date: 2000-09-15.
H & R COMPUTERS APPLICATIONS I (21218 ST ANDREWS BLVD; small business) : $246,993 in 11 contractsfrom 2002 to 2006
Contracts for ADP Supplies, ADP Software, Laundry and Dry Cleaning Equipment, Technical Representation Services -- Miscellaneous by Army Signed by year:2000: $0; 2001: $0; 2002: $105,289; 2003: $98,461; 2004: $30,743; 2005: $0; 2006: $12,500.
Biggest contracts:
$99,915 with Army for ADP Supplies. Taking place in AK. Signed on 2002-09-27. Completion date: 2003-01-02.
$83,765, same as above.Signed on 2003-09-30. Completion date: 2004-02-29.
$12,500 with Army for ADP Software. Signed on 2006-02-14. Completion date: 2006-10-31.
$12,000 with Army for ADP Software. Taking place in AK. Signed on 2003-12-12. Completion date: 2004-10-31.
COASTAL INSPECTION TECHNOLOGIE (21218 ST ANDREWS BLVD STE; small business) : $119,981 in 3 contractsfrom 2003 to 2005
$86,670 with Air Force for Physical Properties Testing and Inspection. Signed on 2005-07-01. Completion date: 2005-08-30.
$28,500 with Navy for X-Ray Equipment and Supplies: Medical, Dental, Veterinary. Taking place in NV. Signed on 2003-09-19. Completion date: 2003-11-17.
$4,811 with Army for Laboratory Equipment and Supplies. Taking place in GA. Signed on 2004-09-23. Completion date: 2004-10-19.
BC INVENTORIES,INC (7200 W CAMINO REAL; small business) : $72,043 in 9 contractsfrom 2002 to 2005
Contracts for Nuts and Washers, Airframe Structural Components, Miscellaneous Aircraft Accessories and Components, Packing and Gasket Materials by Air Force, Navy Signed by year:2000: $0; 2001: $0; 2002: $50,000; 2003: $0; 2004: $18,943; 2005: $3,100; 2006: $0.
Biggest contracts:
$50,000 with Air Force for Nuts and Washers. Signed on 2002-07-11. Completion date: 2002-08-02.
$8,933 with Navy for Airframe Structural Components. Signed on 2004-10-14. Completion date: 2004-12-14.
$5,595 with Navy for Miscellaneous Aircraft Accessories and Components. Signed on 2004-11-30. Completion date: 2004-11-23.
$3,565 with Air Force for Airframe Structural Components. Signed on 2004-12-01. Completion date: 2004-12-04.
ABRAMOVITZ, STANLEY (6562 VIA REGINA; small business) : $28,307 in 5 contractsfrom 2002 to 2004
Contracts for Other Architect and Engineering Services, Technical Assistance, Engineering and Technical Services by U.S. Army Corps of Engineers - civil program financing only, Army Signed by year:2000: $0; 2001: $0; 2002: $14,507; 2003: $5,800; 2004: $8,000; 2005: $0; 2006: $0.
Biggest contracts:
$7,307 with U.S. Army Corps of Engineers - civil program financing only for Other Architect and Engineering Services. Taking place in ND. Signed on 2002-07-10. Completion date: 2002-09-30.
$7,200, same as above.Signed on 2002-05-29. Completion date: 2002-09-30.
$5,800 with U.S. Army Corps of Engineers - civil program financing only for Technical Assistance. Signed on 2003-05-07. Completion date: 2003-06-06.
$4,000 with Army for Engineering and Technical Services. Taking place in MO. Signed on 2004-03-03. Completion date: 2004-02-26.
THEODORE VILLAFANA (6154 VISTA LINDA LN; small business) : $15,404 in 3 contractsfrom 2004 to 2006
$5,452 with Army for Lectures For Training. Taking place in HI. Signed on 2006-06-20. Completion date: 2006-07-07.
$5,421, same as above.Signed on 2005-05-23. Completion date: 2005-07-09.
$4,531, same as above.Signed on 2004-06-16. Completion date: 2004-07-10.
HIGH'BORN TECHNOLOGY USA, INC (5970 SW 18TH STREET; small business) : $14,645 in 2 contractsfrom 2004 to 2005
$15,000 with Navy for ADP Components. Signed on 2004-11-29. Completion date: 2004-12-15.
-$355, same as above.Signed on 2005-10-06. Completion date: 2004-12-15.
GLOBAL EQUIPMENT MARKETING, IN (23282 COSTA DEL SOL BLVD; small business) : $14,450 in 2 contractsin 2005
$14,450 with Army for Gears, Pulleys, Sprockets, and Transmission Chain. Signed on 2005-09-29. Completion date: 2005-10-03.
$0 with Army for Gears, Pulleys, Sprockets, and Transmission Chain. Taking place in MD. Signed on 2005-11-23. Completion date: 2006-01-14.
AUGUSTAM SOURCING L L C (22084 BOCA PLACE DR APT 11; small business)
$9,408 with Air Force for Electrical and Electronic assemblies, Boards, Cards, and Associated Hardware. Signed on 2005-10-26. Completion date: 2005-12-15.
BUSINESS SERVICE MANAGEMENT, I (23428 SAN REMO DR; small business)
$5,999 with Army for ADP Input/Output and Storage Devices. Signed on 2005-01-24. Completion date: 2005-02-15.
Top industries in this zip code by the number of employees in 2005:
2004 - 2018 National Fire Incident Reporting System (NFIRS) incidents
According to the data from the years 2004 - 2018 the average number of fire incidents per year is 24. The highest number of fire incidents - 36 took place in 2007, and the least - 2 in 2005. The data has a rising trend.
When looking into fire subcategories, the most reports belonged to: Outside Fires (36.6%), and Structure Fires (35.2%).
Fire incident types reported to NFIRS in Zip Code 33433


 Nearest zip codes: 33434, 33442, 33486, 33428, 33073, 33496.
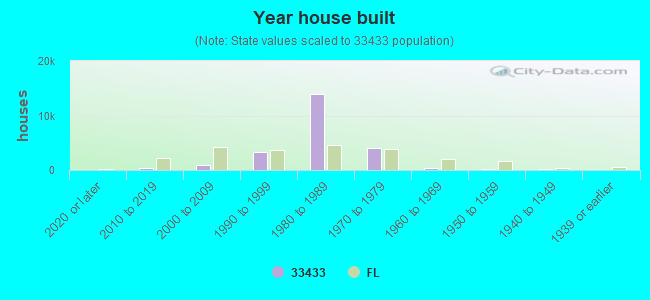


 According to the data from the years 2004 - 2018 the average number of fire incidents per year is 24. The highest number of fire incidents - 36 took place in 2007, and the least - 2 in 2005. The data has a rising trend.
 When looking into fire subcategories, the most reports belonged to: Outside Fires (36.6%), and Structure Fires (35.2%).