Estimated zip code population in 2022: 37,192 Zip code population in 2010: 23,119 Zip code population in 2000: 8,513
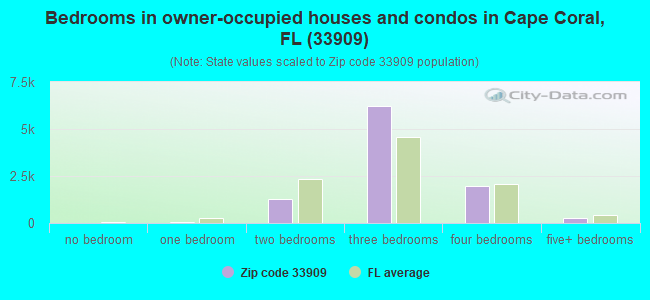
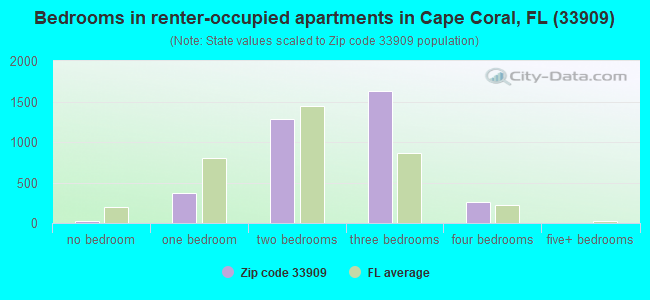
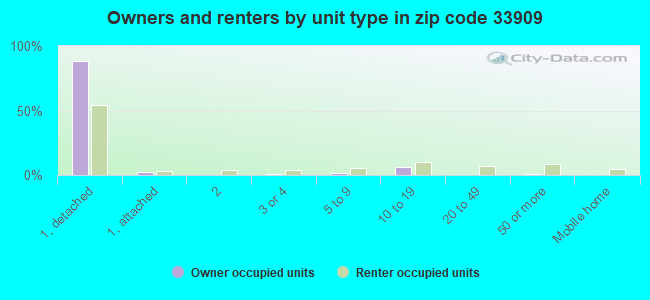
Houses and condos: 14,242 Renter-occupied apartments: 3,614
% of renters here:
27%
State:
33%
March 2022 cost of living index in zip code 33909: 92.3 (less than average, U.S. average is 100)
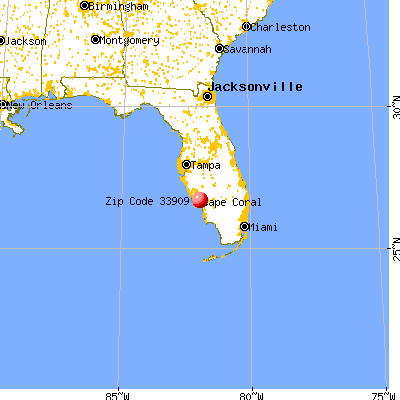
Land area: 18.0 sq. mi. Water area: 1.0 sq. mi.
Population density: 2,071 people per square mile
(low).
OSM Map
General Map
Google Map
MSN Map
OSM Map
General Map
Google Map
MSN Map
OSM Map
General Map
Google Map
MSN Map
OSM Map
General Map
Google Map
MSN Map
Please wait while loading the map...
Real estate property taxes paid for housing units in 2022:
This zip code:
0.8% ($2,441)
Florida:
0.7% ($2,529)
Median real estate property taxes paid for housing units with mortgages in 2022: $2,595 (0.8%) Median real estate property taxes paid for housing units with no mortgage in 2022: $2,000 (0.7%)
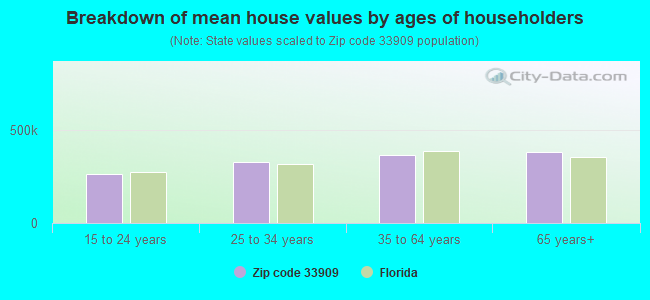
Estimated median house/condo value in 2022: $316,048
33909:
$316,048
Florida:
$354,100
According to our research of Florida and other state lists, there were 46 registered sex offenders living in 33909 zip code as of April 18, 2024. The ratio of all residents to sex offenders in zip code 33909 is 590 to 1. The ratio of registered sex offenders to all residents in this zip code is near the state average.
Median resident age:
This zip code:
38.3 years
Florida median age:
42.7 years
Average household size:
This zip code:
2.8 people
Florida:
2.5 people
Averages for the 2020 tax year for zip code 33909, filed in 2021:
Average Adjusted Gross Income (AGI) in 2020: $48,686 (Individual Income Tax Returns)
Here:
$48,686
State:
$82,200
Salary/wage: $44,029 (reported on 81.4% of returns)
Here:
$44,029
State:
$58,347
(% of AGI for various income ranges: 1122.8% for AGIs below $25k, 3625.9% for AGIs $25k-50k, 6564.1% for AGIs $50k-75k, 9429.1% for AGIs $75k-100k, 15652.4% for AGIs $100k-200k, 54950.0% for AGIs over 200k)
Taxable interest for individuals: $827 (reported on 17.5% of returns)
This zip code:
$827
Florida:
$4,272
(% of AGI for various income ranges: 8.2% for AGIs below $25k, 7.6% for AGIs $25k-50k, 24.3% for AGIs $50k-75k, 24.3% for AGIs $75k-100k, 75.7% for AGIs $100k-200k, 590.0% for AGIs over 200k)
Ordinary dividends: $2,820 (reported on 9.9% of returns)
Here:
$2,820
State:
$15,863
(% of AGI for various income ranges: 11.3% for AGIs below $25k, 16.2% for AGIs $25k-50k, 35.0% for AGIs $50k-75k, 65.5% for AGIs $75k-100k, 153.8% for AGIs $100k-200k, 1351.7% for AGIs over 200k)
Net capital gain/loss in AGI: +$10,197 (reported on 9.6% of returns)
Here:
+$10,197
State:
+$62,983
(% of AGI for various income ranges: 3.7% for AGIs below $25k, 17.5% for AGIs $25k-50k, 61.1% for AGIs $50k-75k, 106.0% for AGIs $75k-100k, 474.3% for AGIs $100k-200k, 15795.0% for AGIs over 200k)
Profit/loss from business: +$8,248 (reported on 21.7% of returns)
Here:
+$8,248
State:
+$9,719
(% of AGI for various income ranges: 232.5% for AGIs below $25k, 201.0% for AGIs $25k-50k, 195.4% for AGIs $50k-75k, 192.1% for AGIs $75k-100k, 389.8% for AGIs $100k-200k, 3335.0% for AGIs over 200k)
Taxable individual retirement arrangement distribution: $17,275 (reported on 6.3% of returns)
33909:
$17,275
Florida:
$24,823
(% of AGI for various income ranges: 35.7% for AGIs below $25k, 59.0% for AGIs $25k-50k, 155.6% for AGIs $50k-75k, 252.4% for AGIs $75k-100k, 701.9% for AGIs $100k-200k, 4003.3% for AGIs over 200k)
Total itemized deductions: $26,395 (reported on 4.2% of returns)
Here:
$26,395
State:
$45,393
(% of AGI for various income ranges: 30.5% for AGIs below $25k, 97.3% for AGIs $25k-50k, 196.9% for AGIs $50k-75k, 286.5% for AGIs $75k-100k, 483.1% for AGIs $100k-200k, 3681.7% for AGIs over 200k)
Charity contributions: $5,644 (reported on 3.0% of returns)
Here:
$5,644
State:
$20,178
(% of AGI for various income ranges: 2.3% for AGIs below $25k, 10.7% for AGIs $25k-50k, 20.9% for AGIs $50k-75k, 35.2% for AGIs $75k-100k, 96.6% for AGIs $100k-200k, 1216.7% for AGIs over 200k)
Taxes paid: $5,314 (reported on 4.1% of returns)
33909:
$5,314
State:
$6,967
(% of AGI for various income ranges: 5.2% for AGIs below $25k, 18.5% for AGIs $25k-50k, 35.7% for AGIs $50k-75k, 61.3% for AGIs $75k-100k, 103.8% for AGIs $100k-200k, 680.0% for AGIs over 200k)
Earned income credit: $2,366 (reported on 22.8% of returns)
Here:
$2,366
State:
$2,306
(% of AGI for various income ranges: 124.4% for AGIs below $25k, 82.9% for AGIs $25k-50k, 1.7% for AGIs $50k-75k)
Percentage of individuals using paid preparers for their 2020 taxes: 93.7%
Here:
94%
State:
92%
(% for various income ranges: 92.6% for AGIs below $25k, 94.4% for AGIs $25k-50k, 94.3% for AGIs $50k-75k, 94.3% for AGIs $75k-100k, 93.6% for AGIs $100k-200k, 95.2% for AGIs over 200k)
Averages for the 2012 tax year for zip code 33909, filed in 2013:
Average Adjusted Gross Income (AGI) in 2012: $37,118 (Individual Income Tax Returns)
Here:
$37,118
State:
$60,316
Salary/wage: $34,353 (reported on 85.1% of returns)
Here:
$34,353
State:
$45,277
(% of AGI for various income ranges: 75.7% for AGIs below $25k, 85.1% for AGIs $25k-50k, 82.5% for AGIs $50k-75k, 77.1% for AGIs $75k-100k, 73.5% for AGIs $100k-200k, 52.2% for AGIs over 200k)
Taxable interest for individuals: $929 (reported on 18.4% of returns)
This zip code:
$929
Florida:
$3,587
(% of AGI for various income ranges: 0.5% for AGIs below $25k, 0.3% for AGIs $25k-50k, 0.4% for AGIs $50k-75k, 0.4% for AGIs $75k-100k, 0.8% for AGIs $100k-200k, 1.3% for AGIs over 200k)
Ordinary dividends: $2,501 (reported on 9.8% of returns)
Here:
$2,501
State:
$12,831
(% of AGI for various income ranges: 0.9% for AGIs below $25k, 0.6% for AGIs $25k-50k, 0.3% for AGIs $50k-75k, 0.7% for AGIs $75k-100k, 1.1% for AGIs $100k-200k)
Net capital gain/loss in AGI: +$1,437 (reported on 7.3% of returns)
Here:
+$1,437
State:
+$33,493
(% of AGI for various income ranges: 0.1% for AGIs $25k-50k, 0.1% for AGIs $50k-75k, 0.5% for AGIs $75k-100k, 1.5% for AGIs $100k-200k)
Profit/loss from business: +$7,984 (reported on 17.3% of returns)
Here:
+$7,984
State:
+$10,012
(% of AGI for various income ranges: 12.3% for AGIs below $25k, 2.6% for AGIs $25k-50k, 1.5% for AGIs $50k-75k, 1.1% for AGIs $75k-100k, 3.2% for AGIs $100k-200k)
Taxable individual retirement arrangement distribution: $12,821 (reported on 6.3% of returns)
33909:
$12,821
Florida:
$21,544
(% of AGI for various income ranges: 1.8% for AGIs below $25k, 1.6% for AGIs $25k-50k, 2.1% for AGIs $50k-75k, 2.3% for AGIs $75k-100k, 4.2% for AGIs $100k-200k)
Total itemized deductions: $17,130 (26% of AGI, reported on 18.5% of returns)
Here:
$17,130
State:
$25,533
Here:
26.4% of AGI
State:
18.0% of AGI
(% of AGI for various income ranges: 6.5% for AGIs below $25k, 8.3% for AGIs $25k-50k, 8.9% for AGIs $50k-75k, 9.2% for AGIs $75k-100k, 9.9% for AGIs $100k-200k, 9.0% for AGIs over 200k)
Charity contributions: $2,641 (reported on 13.3% of returns)
Here:
$2,641
State:
$5,698
(% of AGI for various income ranges: 0.4% for AGIs below $25k, 0.8% for AGIs $25k-50k, 1.1% for AGIs $50k-75k, 1.2% for AGIs $75k-100k, 1.2% for AGIs $100k-200k, 1.9% for AGIs over 200k)
Taxes paid: $3,033 (reported on 18.0% of returns)
33909:
$3,033
State:
$6,203
(% of AGI for various income ranges: 1.0% for AGIs below $25k, 1.2% for AGIs $25k-50k, 1.4% for AGIs $50k-75k, 1.6% for AGIs $75k-100k, 2.2% for AGIs $100k-200k, 2.3% for AGIs over 200k)
Earned income credit: $2,505 (reported on 30.1% of returns)
Here:
$2,505
State:
$2,372
(% of AGI for various income ranges: 9.6% for AGIs below $25k, 1.6% for AGIs $25k-50k)
Percentage of individuals using paid preparers for their 2012 taxes: 47.8%
Here:
48%
State:
54%
(% for various income ranges: 49.1% for AGIs below $25k, 44.2% for AGIs $25k-50k, 47.7% for AGIs $50k-75k, 45.9% for AGIs $75k-100k, 57.1% for AGIs $100k-200k, 80.0% for AGIs over 200k)
Averages for the 2004 tax year for zip code 33909, filed in 2005:
Average Adjusted Gross Income (AGI) in 2004: $36,076 (Individual Income Tax Returns)
Here:
$36,076
State:
$50,523
Salary/wage: $33,554 (reported on 90.0% of returns)
Here:
$33,554
State:
$39,563
(% of AGI for various income ranges: 102.6% for AGIs below $10k, 83.8% for AGIs $10k-25k, 88.4% for AGIs $25k-50k, 86.7% for AGIs $50k-75k, 87.9% for AGIs $75k-100k, 62.6% for AGIs over 100k)
Taxable interest for individuals: $868 (reported on 30.3% of returns)
This zip code:
$868
Florida:
$3,211
(% of AGI for various income ranges: 2.5% for AGIs below $10k, 1.0% for AGIs $10k-25k, 0.6% for AGIs $25k-50k, 0.6% for AGIs $50k-75k, 0.6% for AGIs $75k-100k, 1.0% for AGIs over 100k)
Taxable dividends: $1,166 (reported on 11.1% of returns)
Here:
$1,166
State:
$6,129
(% of AGI for various income ranges: 1.1% for AGIs below $10k, 0.4% for AGIs $10k-25k, 0.4% for AGIs $25k-50k, 0.2% for AGIs $50k-75k, 0.2% for AGIs $75k-100k, 0.6% for AGIs over 100k)
Net capital gain/loss: +$14,335 (reported on 9.6% of returns)
Here:
+$14,335
State:
+$27,205
(% of AGI for various income ranges: -1.6% for AGIs below $10k, -0.3% for AGIs $10k-25k, 1.0% for AGIs $25k-50k, 1.4% for AGIs $50k-75k, 1.6% for AGIs $75k-100k, 20.0% for AGIs over 100k)
Profit/loss from business: +$7,528 (reported on 16.0% of returns)
Here:
+$7,528
State:
+$10,634
(% of AGI for various income ranges: 10.8% for AGIs below $10k, 7.3% for AGIs $10k-25k, 3.0% for AGIs $25k-50k, 2.5% for AGIs $50k-75k, 1.6% for AGIs $75k-100k, 2.4% for AGIs over 100k)
IRA payment deduction: $2,227 (reported on 2.2% of returns)
33909:
$2,227
Florida:
$3,082
(% of AGI for various income ranges: 0.2% for AGIs $10k-25k, 0.1% for AGIs $25k-50k, 0.1% for AGIs $50k-75k, 0.2% for AGIs $75k-100k, 0.2% for AGIs over 100k)
Total itemized deductions: $14,878 (28% of AGI, reported on 31.9% of returns)
Here:
$14,878
State:
$20,370
Here:
27.8% of AGI
State:
20.7% of AGI
(% of AGI for various income ranges: 13.2% for AGIs below $10k, 13.6% for AGIs $10k-25k, 14.6% for AGIs $25k-50k, 13.3% for AGIs $50k-75k, 12.2% for AGIs $75k-100k, 10.5% for AGIs over 100k)
Charity contributions deductions: $2,161 (4% of AGI, reported on 23.3% of returns)
Here:
$2,161
State:
$4,064
Here:
3.8% of AGI
State:
3.8% of AGI
(% of AGI for various income ranges: 0.7% for AGIs below $10k, 0.8% for AGIs $10k-25k, 1.2% for AGIs $25k-50k, 1.4% for AGIs $50k-75k, 1.9% for AGIs $75k-100k, 2.0% for AGIs over 100k)
Total tax: $4,068 (reported on 73.4% of returns)
33909:
$4,068
State:
$9,431
(% of AGI for various income ranges: 3.4% for AGIs below $10k, 4.1% for AGIs $10k-25k, 6.2% for AGIs $25k-50k, 8.1% for AGIs $50k-75k, 10.1% for AGIs $75k-100k, 15.5% for AGIs over 100k)
Earned income credit: $1,844 (reported on 21.3% of returns)
Here:
$1,844
State:
$1,808
Percentage of individuals using paid preparers for their 2004 taxes: 55.3%
Here:
55%
State:
60%
(% for various income ranges: 46.5% for AGIs below $10k, 59.1% for AGIs $10k-25k, 56.1% for AGIs $25k-50k, 53.8% for AGIs $50k-75k, 55.4% for AGIs $75k-100k, 65.9% for AGIs over 100k)
Likely homosexual households (counted as self-reported same-sex unmarried-partner households)
Lesbian couples: 0.3% of all households
Gay men: 0.3% of all households
Household received Food Stamps/SNAP in the past 12 months: 1,486 Household did not receive Food Stamps/SNAP in the past 12 months: 11,922
Women who had a birth in the past 12 months: 284 (176 now married, 106 unmarried) Women who did not have a birth in the past 12 months: 8,615 (3,386 now married, 5,228 unmarried)
Housing units in zip code 33909 with a mortgage: 7,054 (266 second mortgage, 31 home equity loan, 239 both second mortgage and home equity loan) Houses without a mortgage: 76
Median monthly owner costs for units with a mortgage: $1,519 Median monthly owner costs for units without a mortgage: $517
Residents with income below the poverty level in 2022:
This zip code:
8.6%
Whole state:
12.7%
Residents with income below 50% of the poverty level in 2022:
This zip code:
3.8%
Whole state:
6.6%
Median number of rooms in houses and condos:
Here:
5.7
State:
5.9
Median number of rooms in apartments:
Here:
5.0
State:
4.2
Notable locations in this zip code not listed on our city pages
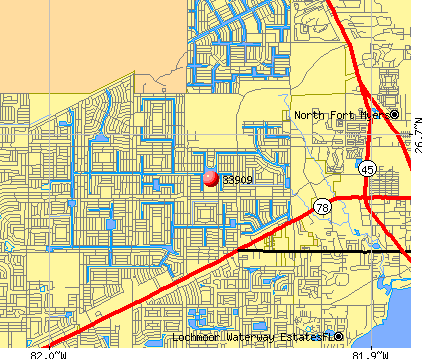
Notable locations in zip code 33909: Pine Island Plaza (A), Hancock Bridge Square (B), Cape Coral Fire Department Station 5 (C), Lee County Emergency Medical Services (D), Cape Coral Fire Department Station 10 (E), Childrens Science Center (F). Display/hide their locations on the map
Churches in zip code 33909 include: New Testament Baptist Church (A), Kings Way Christian Center (B), First Apostolic Church of Cape Coral (C), Coral Ridge Baptist Church (D), Calvary Wesleyan Church (E). Display/hide their locations on the map
In group quarters: 29 (-1 institutionalized population)
Size of family households: 4,072 2-persons, 2,074 3-persons, 2,092 4-persons, 887 5-persons, 198 6-persons, 302 7-or-more-persons
Size of nonfamily households: 3,096 1-person, 611 2-persons, 40 3-persons
5,268 married couples with children.
2,383 single-parent households (519 men, 1,864 women).
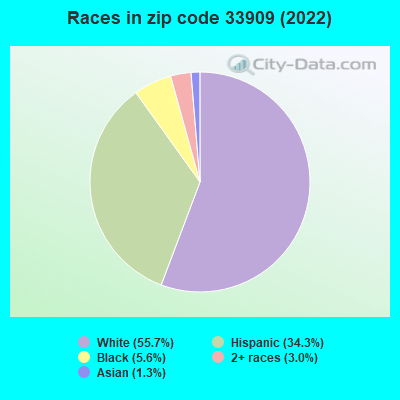
70.2% of residents of 33909 zip code speak English at home.
26.1% of residents speak Spanish at home (50% very well, 24% well, 19% not well, 7% not at all).
2.5% of residents speak other Indo-European language at home (68% very well, 31% well, 1% not well).
0.5% of residents speak Asian or Pacific Island language at home (71% very well, 29% well).
0.1% of residents speak other language at home (100% very well).
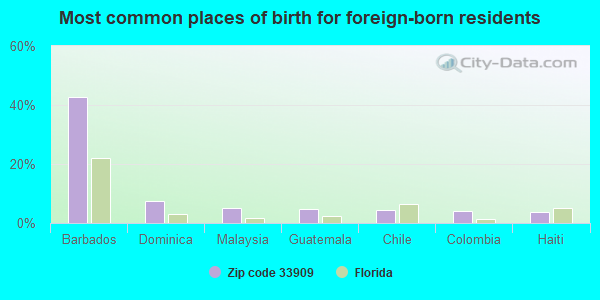
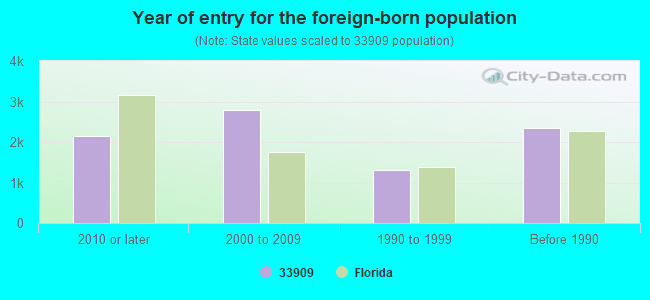
Foreign born population: 7,539 (20.3%) (70.4% of them are naturalized citizens)
Major facilities with environmental interests located in this zip code:
ACTION CRAFT (2603 ANDALUSIA BOULEVARD in CAPE CORAL, FL)
AIR SYNTHETIC MINOR (AIRS/AFS) (Integrated Compliance Information System) - ICIS-04-1998-0270, FORMAL ENFORCEMENT ACTION, ICIS-04-2004-1811, CRITERIA AND HAZARDOUS AIR POLLUTANT INVENTORY (Inventory of air pollution sources) National Pollutant Discharge Elimination System NON-MAJOR (Tracking pollutant discharge elimination systems) - permit Small Quantity Generators, between 100 kg and 1000 kg of hazardous waste/month (Resource Conservation and Recovery Act (tracking hazardous waste)) - notification TRI REPORTER (Tracking of toxic chemicals releasing facilities) Business SIC classification: PLASTICS PRODUCTS; BOAT BUILDING AND REPAIRING Business NAICS classification: BOAT BUILDING. Organizations: PAUL GUARD (CONTACT/OWNER)
, JACK & VIRGINIA SHEA (CONTACT/OWNER)
Alternative names: COASTLINE BOATS
PREMIUM PARA SAIL BOATS INCORPORATED (928 N.E. 24TH LN. UNIT 4 in CAPE CORAL, FL)
ENFORCEMENT/COMPLIANCE ACTIVITY (Integrated Compliance Information System) (Integrated Compliance Information System) - ICIS-04-1998-0267, FORMAL ENFORCEMENT ACTION CRITERIA AND HAZARDOUS AIR POLLUTANT INVENTORY (Inventory of air pollution sources) Small Quantity Generators, between 100 kg and 1000 kg of hazardous waste/month (Resource Conservation and Recovery Act (tracking hazardous waste)) TRI REPORTER (Tracking of toxic chemicals releasing facilities) Business SIC classification: BOAT BUILDING AND REPAIRING Business NAICS classification: BOAT BUILDING. Organizations: RICHARD VANDERLAAN (CONTACT/OWNER)
Alternative names: PREMIUM PARASAIL BOATS INC
GUY'S GARAGE (1302 NE PINE ISLAND ROAD in CAPE CORAL, FL)
AIR MINOR (AIRS/AFS) (Integrated Compliance Information System) - ICIS-04-1999-0386, FORMAL ENFORCEMENT ACTION Business SIC classification: GENERAL AUTOMOTIVE REPAIR SHOPS
MARINER HIGH SCHOOL (701 CHIQUITA BLVD., NORTH in CAPE CORAL, FL)
(National Center for Education Statistics) - STATE ID-0721 Organizations: LEE COUNTY SCHOOL DISTRICT (SCHOOL DISTRICT)
PARK 720 PHASE 2 (720 NE 25TH AVENUE in CAPE CORAL, FL)
National Pollutant Discharge Elimination System NON-MAJOR (Tracking pollutant discharge elimination systems) - permit National Pollutant Discharge Elimination System NON-MAJOR (Tracking pollutant discharge elimination systems) - permit Organizations: BRIAN KIRBY (CONTACT/OWNER)
KISMET LAKES (3703 KISMET PARKWAY in CAPE CORAL, FL)
National Pollutant Discharge Elimination System NON-MAJOR (Tracking pollutant discharge elimination systems) - permit National Pollutant Discharge Elimination System NON-MAJOR (Tracking pollutant discharge elimination systems) - permit Alternative names: HONC CONSTRUCTION INC
LINKSIDE AT BURNT STORE MARINA (SWC ROMANO KEY CT & MARIANNE K in CAPE CORAL, FL)
National Pollutant Discharge Elimination System NON-MAJOR (Tracking pollutant discharge elimination systems) - permit National Pollutant Discharge Elimination System NON-MAJOR (Tracking pollutant discharge elimination systems) - permit Alternative names: LEE COUNTY ENGINEERING INC
7-ELEVEN STORE #24542 (798 DEL PRADO in CAPE CORAL, FL)
National Pollutant Discharge Elimination System NON-MAJOR (Tracking pollutant discharge elimination systems) - permit Organizations: WILLO SMITH (CONTACT/OWNER)
Alternative names: AMOCO #178
GREYSTONE NORTH & GREYSTONE SO (PONDELLA COMMERCE PARK in CAPE CORAL, FL)
National Pollutant Discharge Elimination System NON-MAJOR (Tracking pollutant discharge elimination systems) - permit Organizations: LYNN KIRBY (CONTACT/OWNER)
HIGHLAND EXCAVATING KEMP BUILD (2635 NE 9TH AVE in CAPE CORAL, FL)
National Pollutant Discharge Elimination System NON-MAJOR (Tracking pollutant discharge elimination systems) - permit Organizations: SIMON BARTON (CONTACT/OWNER)
Alternative names: PORTER COMMERCE PARK
SHOP (434 NE 3RD AVE. in CAPE CORAL, FL)
National Pollutant Discharge Elimination System NON-MAJOR (Tracking pollutant discharge elimination systems) - permit Organizations: HARRY ALDERMAN (CONTACT/OWNER)
SHAMROCK PARK (901 NE 27TH LANE in CAPE CORAL, FL)
National Pollutant Discharge Elimination System NON-MAJOR (Tracking pollutant discharge elimination systems) - permit Organizations: SIMON BARTON (CONTACT/OWNER)
Alternative names: PEBBLE BROOKE
Housing units lacking complete plumbing facilities: 0.2% Housing units lacking complete kitchen facilities: 0.2%
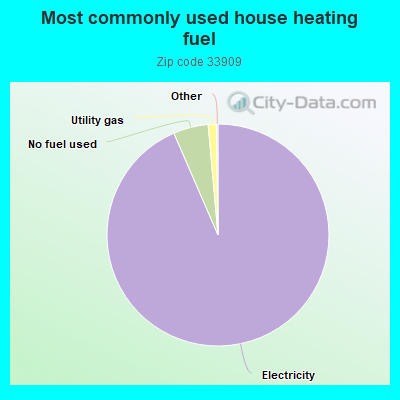
93.5%Electricity
5.1%No fuel used
1.2%Utility gas
Population in 1990: 8,622.
Place of birth for U.S.-born residents:
This state: 11,798
Northeast: 7,542
Midwest: 5,096
South: 2,278
West: 1,655
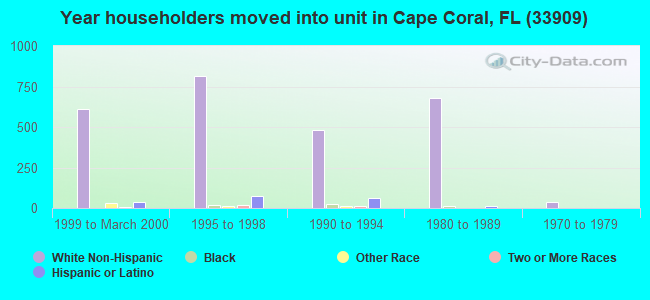
50% of the 33909 zip code residents lived in the same house 5 years ago. Out of people who lived in different houses, 59% lived in this county. Out of people who lived in different counties, 50% lived in Florida.
90% of the 33909 zip code residents lived in the same house 1 year ago. Out of people who lived in different houses, 47% moved from this county. Out of people who lived in different houses, 14% moved from different county within same state. Out of people who lived in different houses, 33% moved from different state. Out of people who lived in different houses, 8% moved from abroad.
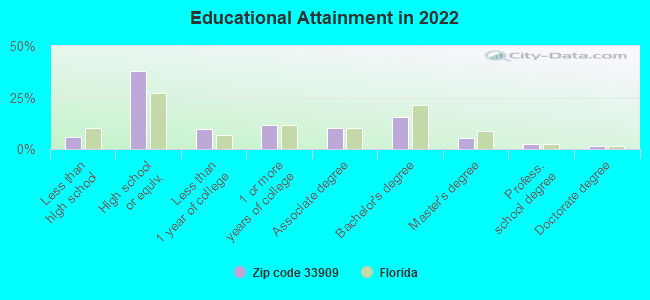
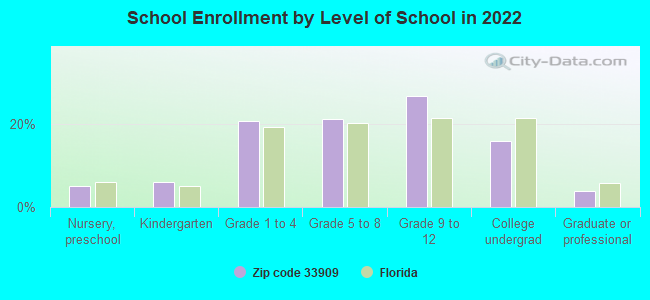
Private vs. public school enrollment:
Students in private schools in grades 1 to 8 (elementary and middle school): 194
Here:
5.4%
Florida:
15.8%
Students in private schools in grades 9 to 12 (high school): 177
Here:
7.7%
Florida:
12.9%
Students in private undergraduate colleges: 269
Here:
19.6%
Florida:
23.6%
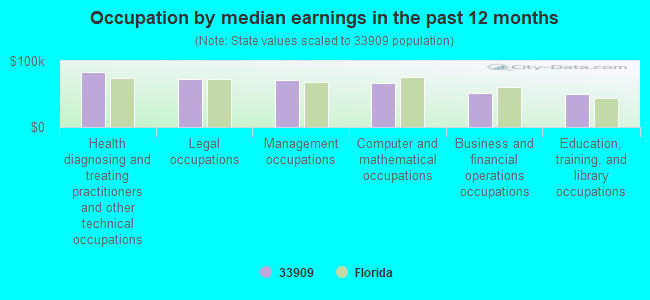
Occupation by median earnings in the past 12 months ($)
83,587Health diagnosing and treating practitioners and other technical occupations
72,549Legal occupations
71,068Management occupations
67,199Computer and mathematical occupations
50,790Business and financial operations occupations
49,961Education, training, and library occupations
Companies with federal contracts located in this zip code:
PREMIUM PARASAIL BOATS, INC (928 NE 24TH LANE in CAPE CORAL, FL; small business) : $2,048,255 in 6 contractsfrom 2001 to 2006
Contracts for Lease or Rental of Equipment -- Ships, Small Craft, Pontoons, and Floating Docks, Maintenance, Repair and Rebuilding of Equipment -- Miscellaneous by Air Force Signed by year:2000: $0; 2001: $324,409; 2002: $1,685,910; 2003: $0; 2004: $0; 2005: $39,639; 2006: -$1,703.
Biggest contracts:
$1,319,892 with Air Force for Lease or Rental of Equipment -- Ships, Small Craft, Pontoons, and Floating Docks. Signed on 2002-08-19. Completion date: 2002-08-19.
$329,973, same as above.Signed on 2002-09-30. Completion date: 2003-08-19.
$324,409, same as above.Signed on 2001-09-07. Completion date: 2001-09-07.
$39,639 with Air Force for Maintenance, Repair and Rebuilding of Equipment -- Miscellaneous. Signed on 2005-09-28. Completion date: 2006-01-17.
CAPE AEROSPACE LLC (2659 N E 9TH AVE in CAPE CORAL, FL; small business) : $1,013,777 in 7 contractsfrom 2000 to 2005
Contracts for Miscellaneous Weapons, Aircraft Maintenance and Repair Shop Specialized Equipment, Guns, through 30 mm, Specialized Shipping and Storage Containers, and moreby Army, Air Force, Navy Signed by year:2000: $76,069; 2001: $82,800; 2002: $39,600; 2003: $400,000; 2004: $398,326; 2005: $16,982; 2006: $0.
Biggest contracts:
$400,000 with Army for Miscellaneous Weapons. Signed on 2003-09-11. Completion date: 2004-09-11.
$398,326, same as above.Signed on 2004-08-11. Completion date: 2005-01-30.
$82,800 with Air Force for Aircraft Maintenance and Repair Shop Specialized Equipment. Signed on 2001-08-30. Completion date: 2002-02-28.
$76,069, same as above.Signed on 2000-08-04. Completion date: 2000-06-26.
LOWE'S HOME CENTERS, INC (1651 NE PINE ISLAND RD in CAPE CORAL, FL) : $8,320 in 2 contractsin 2004
$4,160 with U.S. Army Corps of Engineers - civil program financing only for Tents and Tarpaulins. Signed on 2004-08-25. Completion date: 2004-08-25.
$4,160 with Army for Tents and Tarpaulins. Signed on 2004-08-25. Completion date: 2004-08-25.
Top industries in this zip code by the number of employees in 2005:
2002 - 2018 National Fire Incident Reporting System (NFIRS) incidents
According to the data from the years 2002 - 2018 the average number of fire incidents per year is 75. The highest number of fires - 109 took place in 2006, and the least - 42 in 2017. The data has a dropping trend.
When looking into fire subcategories, the most incidents belonged to: Outside Fires (56.8%), and Structure Fires (20.0%).
Fire incident types reported to NFIRS in Zip Code 33909


 Nearest zip codes: 33903, 33990, 33993, 33901, 33991, 33917.
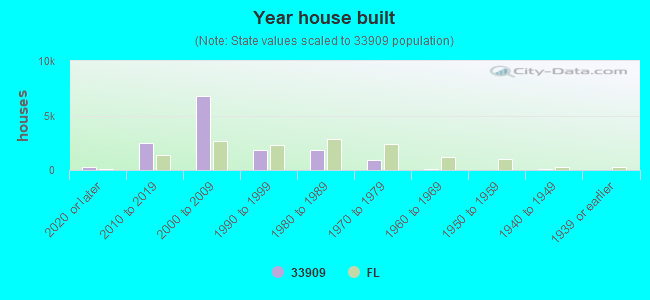


 According to the data from the years 2002 - 2018 the average number of fire incidents per year is 75. The highest number of fires - 109 took place in 2006, and the least - 42 in 2017. The data has a dropping trend.
 When looking into fire subcategories, the most incidents belonged to: Outside Fires (56.8%), and Structure Fires (20.0%).