Estimated zip code population in 2022: 8,089 Zip code population in 2010: 7,232 Zip code population in 2000: 5,773
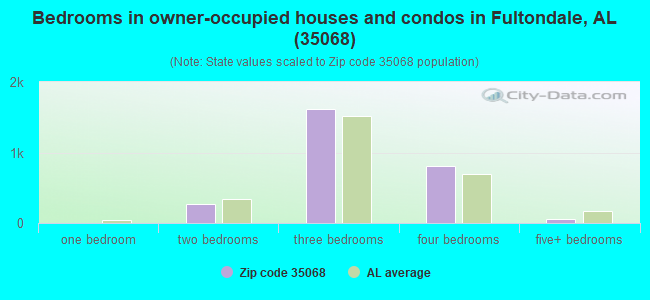
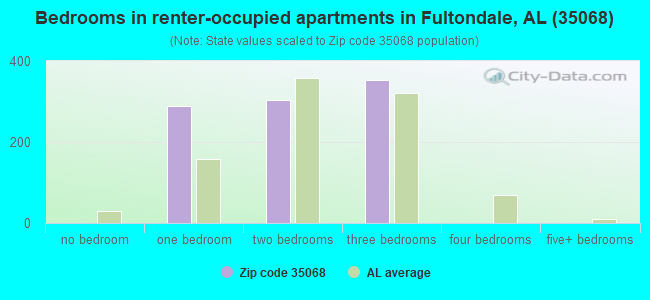
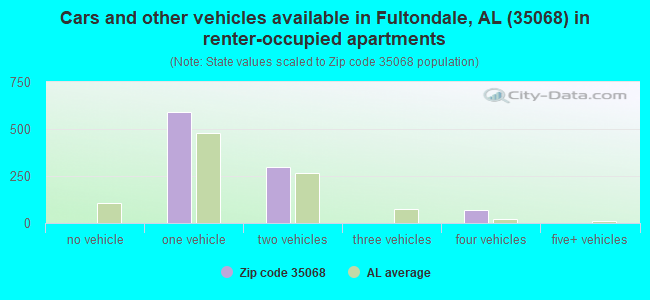
Houses and condos: 3,772 Renter-occupied apartments: 945
% of renters here:
25%
State:
30%
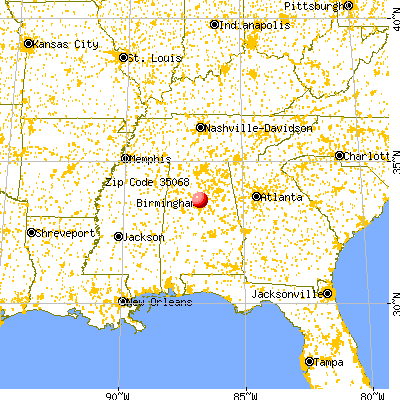
March 2022 cost of living index in zip code 35068: 87.2 (less than average, U.S. average is 100)
Land area: 14.0 sq. mi. Water area: 0.0 sq. mi.
Population density: 579 people per square mile
(low).
OSM Map
General Map
Google Map
MSN Map
OSM Map
General Map
Google Map
MSN Map
OSM Map
General Map
Google Map
MSN Map
OSM Map
General Map
Google Map
MSN Map
Please wait while loading the map...
Real estate property taxes paid for housing units in 2022:
This zip code:
0.5% ($926)
Alabama:
0.4% ($718)
Median real estate property taxes paid for housing units with mortgages in 2022: $1,039 (0.4%) Median real estate property taxes paid for housing units with no mortgage in 2022: $667 (0.5%)
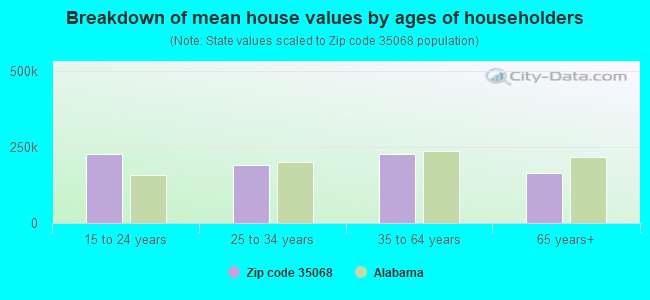
Estimated median house/condo value in 2022: $204,819
35068:
$204,819
Alabama:
$200,900
According to our research of Alabama and other state lists, there were 14 registered sex offenders living in 35068 zip code as of April 25, 2024. The ratio of all residents to sex offenders in zip code 35068 is 588 to 1. The ratio of registered sex offenders to all residents in this zip code is lower than the state average.
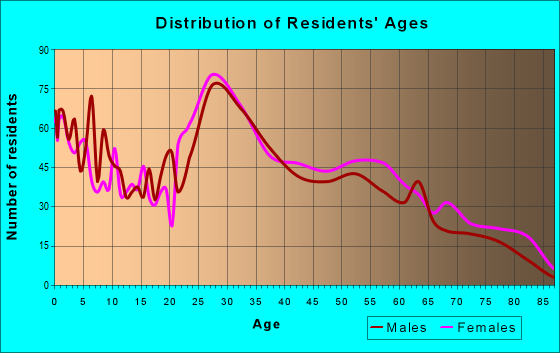
Median resident age:
This zip code:
39.9 years
Alabama median age:
39.6 years
Average household size:
This zip code:
2.2 people
Alabama:
2.5 people
Averages for the 2020 tax year for zip code 35068, filed in 2021:
Average Adjusted Gross Income (AGI) in 2020: $51,229 (Individual Income Tax Returns)
Here:
$51,229
State:
$63,984
Salary/wage: $49,002 (reported on 85.4% of returns)
Here:
$49,002
State:
$52,834
(% of AGI for various income ranges: 1340.8% for AGIs below $25k, 3991.4% for AGIs $25k-50k, 6746.3% for AGIs $50k-75k, 11543.7% for AGIs $75k-100k, 16352.3% for AGIs $100k-200k)
Taxable interest for individuals: $834 (reported on 18.7% of returns)
This zip code:
$834
Alabama:
$1,615
(% of AGI for various income ranges: 12.0% for AGIs below $25k, 16.0% for AGIs $25k-50k, 16.8% for AGIs $50k-75k, 32.2% for AGIs $75k-100k, 54.2% for AGIs $100k-200k)
Ordinary dividends: $2,470 (reported on 7.3% of returns)
Here:
$2,470
State:
$7,660
(% of AGI for various income ranges: 8.4% for AGIs below $25k, 7.4% for AGIs $25k-50k, 22.1% for AGIs $50k-75k, 60.0% for AGIs $75k-100k, 116.9% for AGIs $100k-200k)
Net capital gain/loss in AGI: +$3,893 (reported on 6.8% of returns)
Here:
+$3,893
State:
+$23,528
(% of AGI for various income ranges: 3.8% for AGIs below $25k, 7.7% for AGIs $25k-50k, 34.7% for AGIs $50k-75k, 51.5% for AGIs $75k-100k, 247.7% for AGIs $100k-200k)
Profit/loss from business: +$4,751 (reported on 17.0% of returns)
Here:
+$4,751
State:
+$9,534
(% of AGI for various income ranges: 97.6% for AGIs below $25k, 56.5% for AGIs $25k-50k, 90.0% for AGIs $50k-75k, 48.5% for AGIs $75k-100k, 473.8% for AGIs $100k-200k)
Taxable individual retirement arrangement distribution: $12,921 (reported on 5.8% of returns)
35068:
$12,921
Alabama:
$19,004
(% of AGI for various income ranges: 53.3% for AGIs below $25k, 55.0% for AGIs $25k-50k, 90.5% for AGIs $50k-75k, 207.8% for AGIs $75k-100k, 384.6% for AGIs $100k-200k)
Total itemized deductions: $22,500 (reported on 8.8% of returns)
Here:
$22,500
State:
$37,338
(% of AGI for various income ranges: 39.1% for AGIs below $25k, 113.6% for AGIs $25k-50k, 344.6% for AGIs $50k-75k, 576.7% for AGIs $75k-100k, 1201.5% for AGIs $100k-200k)
Charity contributions: $8,306 (reported on 7.8% of returns)
Here:
$8,306
State:
$18,005
(% of AGI for various income ranges: 37.2% for AGIs $25k-50k, 95.6% for AGIs $50k-75k, 193.0% for AGIs $75k-100k, 475.0% for AGIs $100k-200k)
Taxes paid: $5,044 (reported on 8.8% of returns)
35068:
$5,044
State:
$6,484
(% of AGI for various income ranges: 3.7% for AGIs below $25k, 15.8% for AGIs $25k-50k, 77.0% for AGIs $50k-75k, 146.7% for AGIs $75k-100k, 305.8% for AGIs $100k-200k)
Earned income credit: $2,542 (reported on 16.8% of returns)
Here:
$2,542
State:
$2,628
(% of AGI for various income ranges: 122.3% for AGIs below $25k, 64.3% for AGIs $25k-50k)
Percentage of individuals using paid preparers for their 2020 taxes: 92.9%
Here:
93%
State:
93%
(% for various income ranges: 91.2% for AGIs below $25k, 94.3% for AGIs $25k-50k, 94.7% for AGIs $50k-75k, 93.0% for AGIs $75k-100k, 92.5% for AGIs $100k-200k, 80.0% for AGIs over 200k)
Averages for the 2012 tax year for zip code 35068, filed in 2013:
Average Adjusted Gross Income (AGI) in 2012: $44,140 (Individual Income Tax Returns)
Here:
$44,140
State:
$52,001
Salary/wage: $42,354 (reported on 86.0% of returns)
Here:
$42,354
State:
$43,822
(% of AGI for various income ranges: 76.7% for AGIs below $25k, 86.5% for AGIs $25k-50k, 83.7% for AGIs $50k-75k, 85.7% for AGIs $75k-100k, 76.6% for AGIs $100k-200k)
Taxable interest for individuals: $1,067 (reported on 23.5% of returns)
This zip code:
$1,067
Alabama:
$1,592
(% of AGI for various income ranges: 1.1% for AGIs below $25k, 0.7% for AGIs $25k-50k, 0.4% for AGIs $50k-75k, 0.2% for AGIs $75k-100k, 0.6% for AGIs $100k-200k)
Ordinary dividends: $1,921 (reported on 8.3% of returns)
Here:
$1,921
State:
$5,697
(% of AGI for various income ranges: 0.8% for AGIs below $25k, 0.3% for AGIs $25k-50k, 0.2% for AGIs $50k-75k, 0.2% for AGIs $75k-100k, 0.5% for AGIs $100k-200k)
Profit/loss from business: +$5,445 (reported on 14.0% of returns)
Here:
+$5,445
State:
+$9,151
(% of AGI for various income ranges: 5.9% for AGIs below $25k, 1.2% for AGIs $25k-50k, 1.0% for AGIs $50k-75k, 1.0% for AGIs $75k-100k, 1.7% for AGIs $100k-200k)
Taxable individual retirement arrangement distribution: $11,354 (reported on 7.4% of returns)
35068:
$11,354
Alabama:
$14,992
(% of AGI for various income ranges: 2.8% for AGIs below $25k, 1.9% for AGIs $25k-50k, 1.9% for AGIs $50k-75k, 1.4% for AGIs $75k-100k, 1.9% for AGIs $100k-200k)
Total itemized deductions: $16,083 (24% of AGI, reported on 34.1% of returns)
Here:
$16,083
State:
$21,388
Here:
23.7% of AGI
State:
20.1% of AGI
(% of AGI for various income ranges: 11.4% for AGIs below $25k, 11.0% for AGIs $25k-50k, 13.4% for AGIs $50k-75k, 13.7% for AGIs $75k-100k, 12.6% for AGIs $100k-200k)
Charity contributions: $4,124 (reported on 29.2% of returns)
Here:
$4,124
State:
$5,925
(% of AGI for various income ranges: 1.5% for AGIs below $25k, 2.2% for AGIs $25k-50k, 2.8% for AGIs $50k-75k, 3.1% for AGIs $75k-100k, 3.6% for AGIs $100k-200k)
Taxes paid: $3,855 (reported on 34.1% of returns)
35068:
$3,855
State:
$5,272
(% of AGI for various income ranges: 1.3% for AGIs below $25k, 2.2% for AGIs $25k-50k, 3.2% for AGIs $50k-75k, 3.5% for AGIs $75k-100k, 4.2% for AGIs $100k-200k)
Earned income credit: $2,315 (reported on 18.6% of returns)
Here:
$2,315
State:
$2,646
(% of AGI for various income ranges: 7.1% for AGIs below $25k, 0.8% for AGIs $25k-50k)
Percentage of individuals using paid preparers for their 2012 taxes: 54.4%
Here:
54%
State:
60%
(% for various income ranges: 54.9% for AGIs below $25k, 52.2% for AGIs $25k-50k, 55.6% for AGIs $50k-75k, 57.6% for AGIs $75k-100k, 56.0% for AGIs $100k-200k)
Averages for the 2004 tax year for zip code 35068, filed in 2005:
Average Adjusted Gross Income (AGI) in 2004: $39,514 (Individual Income Tax Returns)
Here:
$39,514
State:
$42,302
Salary/wage: $36,797 (reported on 86.3% of returns)
Here:
$36,797
State:
$36,626
(% of AGI for various income ranges: 75.6% for AGIs below $10k, 75.0% for AGIs $10k-25k, 86.8% for AGIs $25k-50k, 87.6% for AGIs $50k-75k, 86.0% for AGIs $75k-100k, 60.3% for AGIs over 100k)
Taxable interest for individuals: $1,195 (reported on 35.0% of returns)
This zip code:
$1,195
Alabama:
$1,827
(% of AGI for various income ranges: 5.2% for AGIs below $10k, 2.4% for AGIs $10k-25k, 1.0% for AGIs $25k-50k, 0.5% for AGIs $50k-75k, 0.8% for AGIs $75k-100k, 0.8% for AGIs over 100k)
Taxable dividends: $1,621 (reported on 12.6% of returns)
Here:
$1,621
State:
$4,206
(% of AGI for various income ranges: 1.2% for AGIs below $10k, 0.6% for AGIs $10k-25k, 0.4% for AGIs $25k-50k, 0.4% for AGIs $50k-75k, 0.4% for AGIs $75k-100k, 0.8% for AGIs over 100k)
Net capital gain/loss: +$4,060 (reported on 9.1% of returns)
Here:
+$4,060
State:
+$13,031
(% of AGI for various income ranges: -0.7% for AGIs below $10k, 0.2% for AGIs $10k-25k, -0.1% for AGIs $25k-50k, 0.6% for AGIs $50k-75k, 1.1% for AGIs $75k-100k, 3.4% for AGIs over 100k)
Profit/loss from business: +$6,915 (reported on 12.8% of returns)
Here:
+$6,915
State:
+$8,302
(% of AGI for various income ranges: 4.6% for AGIs below $10k, 4.9% for AGIs $10k-25k, 2.0% for AGIs $25k-50k, 1.5% for AGIs $50k-75k, 0.6% for AGIs $75k-100k, 3.1% for AGIs over 100k)
IRA payment deduction: $3,036 (reported on 2.0% of returns)
35068:
$3,036
Alabama:
$3,006
Total itemized deductions: $16,532 (26% of AGI, reported on 36.8% of returns)
Here:
$16,532
State:
$17,623
Here:
26.4% of AGI
State:
20.8% of AGI
(% of AGI for various income ranges: 14.2% for AGIs below $10k, 9.3% for AGIs $10k-25k, 20.1% for AGIs $25k-50k, 14.5% for AGIs $50k-75k, 15.6% for AGIs $75k-100k, 13.1% for AGIs over 100k)
Charity contributions deductions: $3,697 (6% of AGI, reported on 33.4% of returns)
Here:
$3,697
State:
$4,768
Here:
5.8% of AGI
State:
5.4% of AGI
(% of AGI for various income ranges: 1.2% for AGIs below $10k, 1.7% for AGIs $10k-25k, 2.5% for AGIs $25k-50k, 3.0% for AGIs $50k-75k, 3.4% for AGIs $75k-100k, 5.0% for AGIs over 100k)
Total tax: $4,917 (reported on 76.4% of returns)
35068:
$4,917
State:
$6,905
(% of AGI for various income ranges: 2.2% for AGIs below $10k, 3.8% for AGIs $10k-25k, 7.0% for AGIs $25k-50k, 8.8% for AGIs $50k-75k, 10.4% for AGIs $75k-100k, 17.7% for AGIs over 100k)
Earned income credit: $1,812 (reported on 14.9% of returns)
Here:
$1,812
State:
$2,048
Percentage of individuals using paid preparers for their 2004 taxes: 62.4%
Here:
62%
State:
65%
(% for various income ranges: 55.6% for AGIs below $10k, 66.5% for AGIs $10k-25k, 62.5% for AGIs $25k-50k, 61.4% for AGIs $50k-75k, 60.1% for AGIs $75k-100k, 69.2% for AGIs over 100k)
Household received Food Stamps/SNAP in the past 12 months: 245 Household did not receive Food Stamps/SNAP in the past 12 months: 3,454
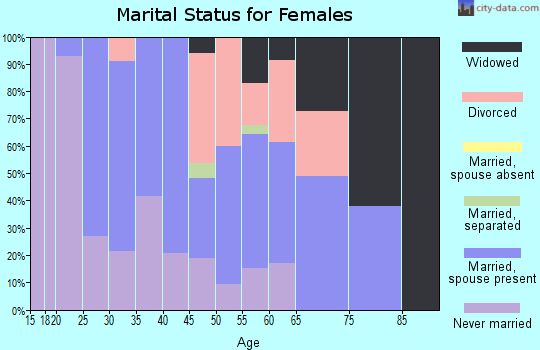
Women who had a birth in the past 12 months: 62 (59 now married, 8 unmarried) Women who did not have a birth in the past 12 months: 1,943 (859 now married, 1,083 unmarried)
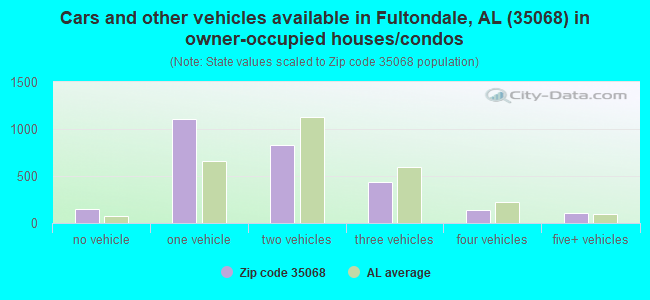
Housing units in zip code 35068 with a mortgage: 1,680 (93 second mortgage, 98 both second mortgage and home equity loan) Houses without a mortgage: 5
Median monthly owner costs for units with a mortgage: $1,270 Median monthly owner costs for units without a mortgage: $367
Residents with income below the poverty level in 2022:
This zip code:
10.1%
Whole state:
16.2%
Residents with income below 50% of the poverty level in 2022:
This zip code:
8.1%
Whole state:
8.6%
Median number of rooms in houses and condos:
Here:
6.1
State:
6.5
Median number of rooms in apartments:
Here:
4.8
State:
4.7
Notable locations in this zip code not listed on our city pages
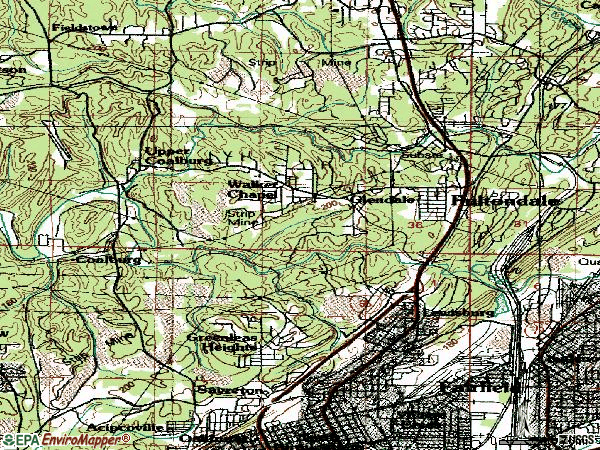
Churches in zip code 35068 include: Walker Chapel United Methodist Church (A), First Baptist Church of Fultondale (B), Coalburg Church (C), Apostolic Faith Assembly (D). Display/hide their locations on the map
In group quarters: 6 (-1 institutionalized population)
Size of family households: 990 2-persons, 536 3-persons, 346 4-persons, 150 5-persons, 38 6-persons, 36 7-or-more-persons
Size of nonfamily households: 1,490 1-person, 54 2-persons, 66 3-persons
1,044 married couples with children.
365 single-parent households (365 women).
90.6% of residents of 35068 zip code speak English at home.
6.3% of residents speak Spanish at home (57% very well, 23% well, 21% not well).
2.5% of residents speak other Indo-European language at home (25% very well, 75% well).
0.3% of residents speak Asian or Pacific Island language at home (100% very well).
0.2% of residents speak other language at home (100% very well).
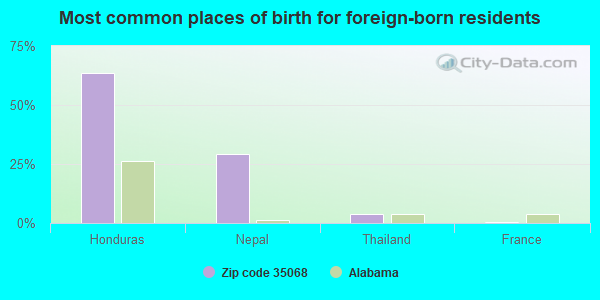
Foreign born population: 409 (5.1%) (33.2% of them are naturalized citizens)
This zip code:
5.1%
Whole state:
3.8%
64%Honduras
29%Nepal
4%Thailand
1%France
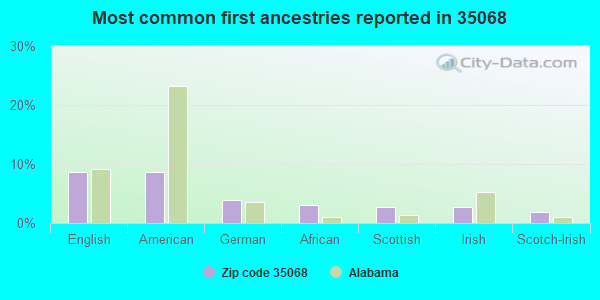
9%English
9%American
4%German
3%African
3%Scottish
3%Irish
2%Scotch-Irish
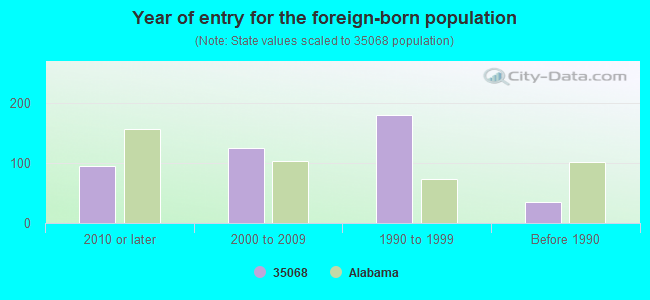
Year of entry for the foreign-born population
952010 or later
1252000 to 2009
1801990 to 1999
35Before 1990
Major facilities with environmental interests located in this zip code:
PRECISION PLATING INC (980 PINE HILL ROAD in FULTONDALE, AL)
AIR MINOR (AIRS/AFS) CRITERIA AND HAZARDOUS AIR POLLUTANT INVENTORY (Inventory of air pollution sources) HAZARDOUS WASTE BIENNIAL REPORTER (Resource Conservation and Recovery Act (tracking hazardous waste)) Small Quantity Generators, between 100 kg and 1000 kg of hazardous waste/month (Resource Conservation and Recovery Act (tracking hazardous waste)) (Resource Conservation and Recovery Act (tracking hazardous waste)) Business SIC and NAICS classification: ELECTROPLATING, PLATING, POLISHING, ANODIZING, AND COLORING Organizations: UNKNOWN (CONTACT/OWNER)
BORROW PIT EAST OF U S HWY 31 (RAYMOND JEFFREYS in FULTONDALE, AL)
National Pollutant Discharge Elimination System NON-MAJOR (Tracking pollutant discharge elimination systems) - permit National Pollutant Discharge Elimination System NON-MAJOR (Tracking pollutant discharge elimination systems) - permit Business SIC classification: HEAVY CONSTRUCTION
ONE HUNDRED OAKS SEWER CORP (2755 STONEFIELD DRIVE in FULTONDALE, AL)
National Pollutant Discharge Elimination System NON-MAJOR (Tracking pollutant discharge elimination systems) - permit Business SIC classification: OPERATORS OF RESIDENTIAL MOBILE HOME SITES Alternative names: ONE HUNDRED OAKS MOBILE HOME, ONE HUNDRED OAKS MOBILE PARK
PAN NATIONAL FENCE MANUFACTURING CO (1621 NEW CASTLE RD in FULTONDALE, AL)
(Resource Conservation and Recovery Act (tracking hazardous waste)) Business NAICS classification: ORNAMENTAL AND ARCHITECTURAL METAL WORK MANUFACTURING. Organizations: OPERNAME (CONTACT/OPERATOR)
PATIO WIRE (1621 OLD NEW CASTLE ROAD in FULTONDALE, AL)
PERFECT CAR WASH (1604 DECATUR HIGHWAY in FULTONDALE, AL)
National Pollutant Discharge Elimination System NON-MAJOR (Tracking pollutant discharge elimination systems) - permit Business SIC classification: CARWASHES
PREMIER TRUCK CENTERS INC (1801 FULTON ROAD in FULTONDALE, AL)
Conditionally Exempt Small Quantity Generators, less than 100 kg/month of hazardous waste (Resource Conservation and Recovery Act (tracking hazardous waste)) - notification USED OIL PROGRAM (Resource Conservation and Recovery Act (tracking hazardous waste)) Alternative names: VOLVO AND GMC TRUCKS, VOLVO AND GMC TRUCKS OF BIRMINGHAM
EXXON BULK PLANT #5177 (HIGHWAY 31 NORTH AND WHALEY in FULTONDALE, AL)
LORNA ROAD CHEVRON (MCCULLOUGH OIL CO in BIRMINGHAM, AL)
National Pollutant Discharge Elimination System NON-MAJOR (Tracking pollutant discharge elimination systems) - permit Business SIC classification: GASOLINE SERVICE STATIONS Alternative names: MCCULLOUGH OIL LORNA RD CHVRN
MUTUAL OIL CO INC. (1600 OLD NEWCASTLE ROAD in FULTONDALE, AL)
(Resource Conservation and Recovery Act (tracking hazardous waste))
ALABAMA OIL & GAS RECOVERY (NORTH WOOD STREET in FULTONDALE, AL)
(Resource Conservation and Recovery Act (tracking hazardous waste))
BLACK CK TRUNK EXT GARDENDALE (JORDAN EXCAVATING INCORP in FULTONDALE, AL)
National Pollutant Discharge Elimination System NON-MAJOR (Tracking pollutant discharge elimination systems) - permit Business SIC classification: WATER, SEWER, PIPELINE, AND COMMUNICATIONS AND POWER LINE CONSTRUCTION
BORROW PIT NO OF CENTRAL AVE (NORTH OF CENTRAL AVENUE in FULTONDALE, AL)
National Pollutant Discharge Elimination System NON-MAJOR (Tracking pollutant discharge elimination systems) - permit Business SIC classification: HEAVY CONSTRUCTION
Housing units lacking complete plumbing facilities: 0.3% Housing units lacking complete kitchen facilities: 1.4%
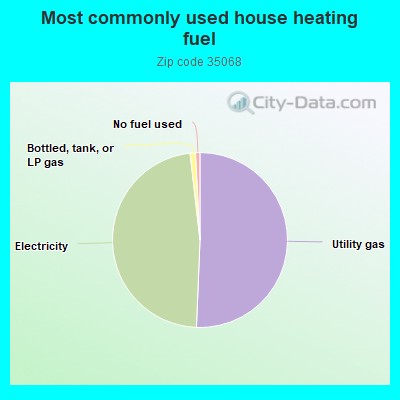
50.7%Utility gas
47.6%Electricity
1.0%Bottled, tank, or LP gas
0.8%No fuel used
Population in 1990: 5,909.
Place of birth for U.S.-born residents:
This state: 6,443
Northeast: 39
Midwest: 241
South: 845
West: 41
61% of the 35068 zip code residents lived in the same house 5 years ago. Out of people who lived in different houses, 67% lived in this county. Out of people who lived in different counties, 50% lived in Alabama.
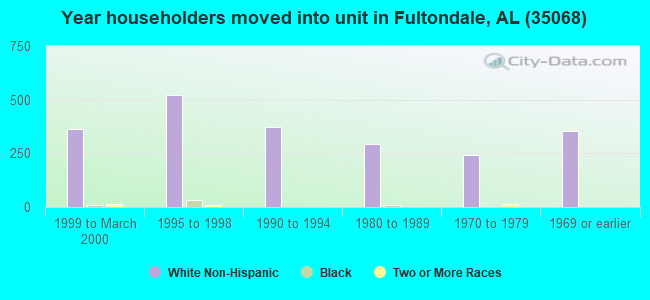
92% of the 35068 zip code residents lived in the same house 1 year ago. Out of people who lived in different houses, 58% moved from this county. Out of people who lived in different houses, 24% moved from different county within same state. Out of people who lived in different houses, 17% moved from different state.
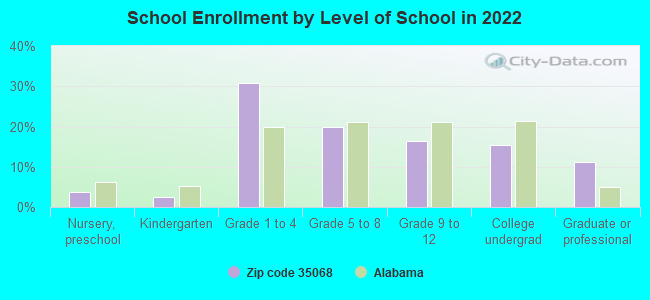
Private vs. public school enrollment:
Students in private schools in grades 1 to 8 (elementary and middle school): 393
Here:
35.1%
Alabama:
14.7%
Students in private schools in grades 9 to 12 (high school): 59
Here:
17.1%
Alabama:
16.3%
Students in private undergraduate colleges: 52
Here:
16.1%
Alabama:
14.6%
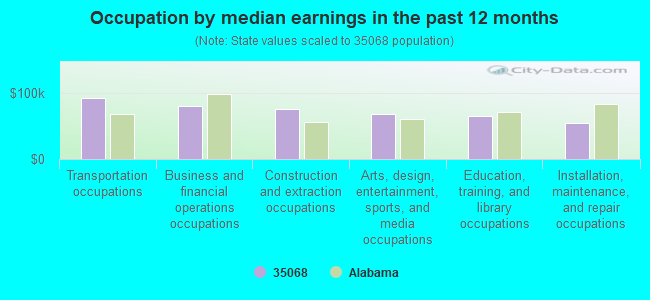
Occupation by median earnings in the past 12 months ($)
92,386Transportation occupations
80,710Business and financial operations occupations
76,443Construction and extraction occupations
68,900Arts, design, entertainment, sports, and media occupations
65,763Education, training, and library occupations
55,350Installation, maintenance, and repair occupations
Companies with federal contracts located in this zip code:
SALAZAR & SONS, INC (2714 CONE DR in FULTONDALE, AL; small business) : $111,000 in 2 contractsin 2000
$61,000 with Tennessee Valley Authority for Refractories and Fire Surfacing Materials. Taking place in IL. Signed on 2000-01-15. Completion date: 2000-04-15.
$50,000, same as above.Signed on 2000-08-15. Completion date: 2000-11-15.
J & J ELECTRIC CO INC (3524 DECATUR HWY STE 208 in FULTONDALE, AL) : $65,052 in 8 contractsfrom 2000 to 2005
Contracts for Construction of Structures and Facilities -- Other Non-Building Facilities, Miscellaneous Electrical and Electronic Components, Other Housekeeping Services, Maintenance, Repair or Alteration of Real Property -- Other Administrative Facilities and Service Buildings by Army, U.S. Army Corps of Engineers - civil program financing only Signed by year:2000: $58,888; 2001: $35,591; 2002: $0; 2003: -$36,077; 2004: $0; 2005: $6,650; 2006: $0.
Biggest contracts:
$58,888 with Army for Construction of Structures and Facilities -- Other Non-Building Facilities. Signed on 2000-09-30. Completion date: 2000-12-30.
$23,031, same as above.Signed on 2001-04-24. Completion date: 2001-10-31.
$12,560, same as above.Signed on 2001-06-07. Completion date: 2001-10-31.
$3,325 with Army for Miscellaneous Electrical and Electronic Components. Taking place in GA. Signed on 2005-06-09. Completion date: 2005-06-30.
Top industries in this zip code by the number of employees in 2005:
Wholesale Trade: Automobile and Other Motor Vehicle Merchant Wholesalers (100-249 employees: 1 establishment)
2003 - 2018 National Fire Incident Reporting System (NFIRS) incidents
According to the data from the years 2003 - 2018 the average number of fires per year is 10. The highest number of fire incidents - 49 took place in 2016, and the least - 0 in 2004. The data has a growing trend.
When looking into fire subcategories, the most reports belonged to: Structure Fires (40.4%), and Outside Fires (31.1%).
Fire incident types reported to NFIRS in Zip Code 35068


 Nearest zip codes: 35207, 35214, 35217, 35119, 35234, 35204.


 According to the data from the years 2003 - 2018 the average number of fires per year is 10. The highest number of fire incidents - 49 took place in 2016, and the least - 0 in 2004. The data has a growing trend.
 When looking into fire subcategories, the most reports belonged to: Structure Fires (40.4%), and Outside Fires (31.1%).