Estimated zip code population in 2022: 17,468 Zip code population in 2010: 14,470 Zip code population in 2000: 9,763
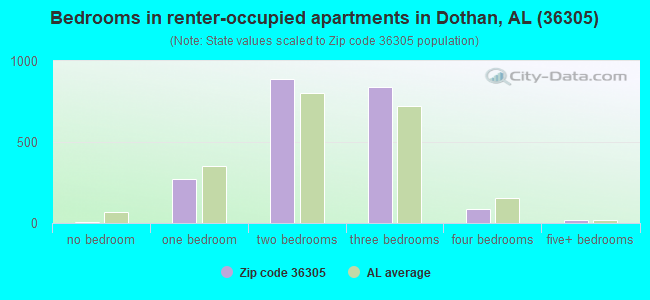
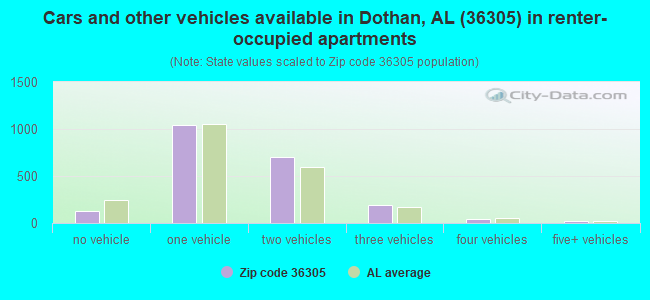
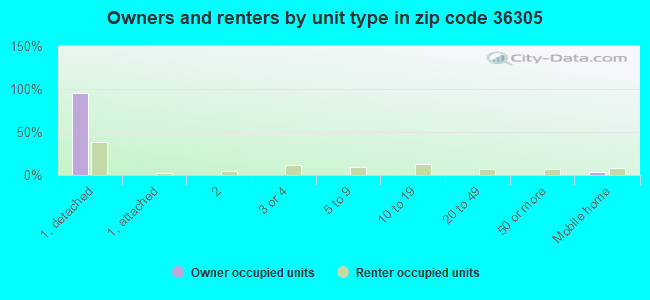
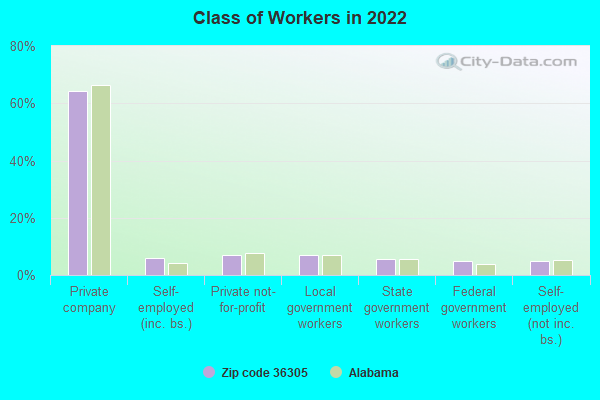
Houses and condos: 7,473 Renter-occupied apartments: 2,119
% of renters here:
31%
State:
30%
March 2022 cost of living index in zip code 36305: 81.5 (low, U.S. average is 100)
Land area: 31.8 sq. mi. Water area: 0.1 sq. mi.
Population density: 550 people per square mile
(low).
OSM Map
General Map
Google Map
MSN Map
OSM Map
General Map
Google Map
MSN Map
OSM Map
General Map
Google Map
MSN Map
OSM Map
General Map
Google Map
MSN Map
Please wait while loading the map...
Real estate property taxes paid for housing units in 2022:
This zip code:
0.3% ($751)
Alabama:
0.4% ($718)
Median real estate property taxes paid for housing units with mortgages in 2022: $829 (0.3%) Median real estate property taxes paid for housing units with no mortgage in 2022: $690 (0.3%)
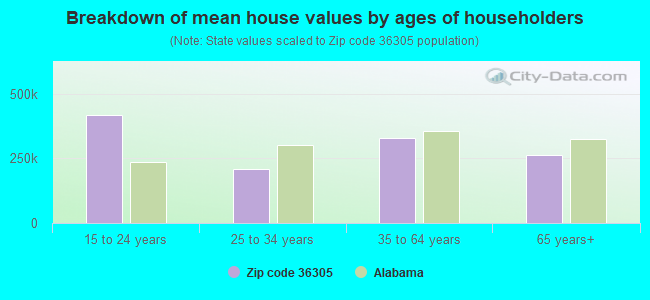
Estimated median house/condo value in 2022: $253,085
36305:
$253,085
Alabama:
$200,900
According to our research of Alabama and other state lists, there were 25 registered sex offenders living in 36305 zip code as of April 17, 2024. The ratio of all residents to sex offenders in zip code 36305 is 640 to 1. The ratio of registered sex offenders to all residents in this zip code is lower than the state average.
Median resident age:
This zip code:
41.6 years
Alabama median age:
39.6 years
Average household size:
This zip code:
2.5 people
Alabama:
2.5 people
Averages for the 2020 tax year for zip code 36305, filed in 2021:
Average Adjusted Gross Income (AGI) in 2020: $92,275 (Individual Income Tax Returns)
Here:
$92,275
State:
$63,984
Salary/wage: $73,896 (reported on 79.9% of returns)
Here:
$73,896
State:
$52,834
(% of AGI for various income ranges: 1182.4% for AGIs below $25k, 3580.1% for AGIs $25k-50k, 6443.8% for AGIs $50k-75k, 9859.8% for AGIs $75k-100k, 19004.8% for AGIs $100k-200k, 87640.6% for AGIs over 200k)
Taxable interest for individuals: $2,278 (reported on 34.8% of returns)
This zip code:
$2,278
Alabama:
$1,615
(% of AGI for various income ranges: 22.8% for AGIs below $25k, 25.9% for AGIs $25k-50k, 65.8% for AGIs $50k-75k, 125.0% for AGIs $75k-100k, 174.4% for AGIs $100k-200k, 1663.3% for AGIs over 200k)
Ordinary dividends: $10,931 (reported on 20.8% of returns)
Here:
$10,931
State:
$7,660
(% of AGI for various income ranges: 20.4% for AGIs below $25k, 36.4% for AGIs $25k-50k, 120.4% for AGIs $50k-75k, 174.8% for AGIs $75k-100k, 415.0% for AGIs $100k-200k, 6423.9% for AGIs over 200k)
Net capital gain/loss in AGI: +$21,083 (reported on 19.1% of returns)
Here:
+$21,083
State:
+$23,528
(% of AGI for various income ranges: 24.9% for AGIs below $25k, 23.9% for AGIs $25k-50k, 89.3% for AGIs $50k-75k, 208.3% for AGIs $75k-100k, 614.5% for AGIs $100k-200k, 12977.2% for AGIs over 200k)
Profit/loss from business: +$14,730 (reported on 17.1% of returns)
Here:
+$14,730
State:
+$9,534
(% of AGI for various income ranges: 104.4% for AGIs below $25k, 98.4% for AGIs $25k-50k, 183.3% for AGIs $50k-75k, 300.5% for AGIs $75k-100k, 781.4% for AGIs $100k-200k, 4382.8% for AGIs over 200k)
Taxable individual retirement arrangement distribution: $21,924 (reported on 10.1% of returns)
36305:
$21,924
Alabama:
$19,004
(% of AGI for various income ranges: 63.1% for AGIs below $25k, 119.1% for AGIs $25k-50k, 225.8% for AGIs $50k-75k, 397.6% for AGIs $75k-100k, 753.9% for AGIs $100k-200k, 3087.2% for AGIs over 200k)
Self-employed (Keogh) retirement plans: $24,180 (reported on 0.7% of returns)
36305:
$24,180
Alabama:
$26,467
(% of AGI for various income ranges: 671.7% for AGIs over 200k)
Total itemized deductions: $39,605 (reported on 10.4% of returns)
Here:
$39,605
State:
$37,338
(% of AGI for various income ranges: 50.8% for AGIs below $25k, 111.7% for AGIs $25k-50k, 303.6% for AGIs $50k-75k, 439.3% for AGIs $75k-100k, 996.4% for AGIs $100k-200k, 9687.8% for AGIs over 200k)
Charity contributions: $20,075 (reported on 9.2% of returns)
Here:
$20,075
State:
$18,005
(% of AGI for various income ranges: 6.8% for AGIs below $25k, 14.9% for AGIs $25k-50k, 64.4% for AGIs $50k-75k, 165.7% for AGIs $75k-100k, 414.5% for AGIs $100k-200k, 5186.7% for AGIs over 200k)
Taxes paid: $6,691 (reported on 10.4% of returns)
36305:
$6,691
State:
$6,484
(% of AGI for various income ranges: 5.9% for AGIs below $25k, 7.8% for AGIs $25k-50k, 35.0% for AGIs $50k-75k, 76.7% for AGIs $75k-100k, 207.2% for AGIs $100k-200k, 1660.6% for AGIs over 200k)
Earned income credit: $2,508 (reported on 14.5% of returns)
Here:
$2,508
State:
$2,628
(% of AGI for various income ranges: 109.0% for AGIs below $25k, 69.6% for AGIs $25k-50k, 2.2% for AGIs $50k-75k)
Percentage of individuals using paid preparers for their 2020 taxes: 93.9%
Here:
94%
State:
93%
(% for various income ranges: 92.1% for AGIs below $25k, 94.6% for AGIs $25k-50k, 93.3% for AGIs $50k-75k, 95.6% for AGIs $75k-100k, 94.3% for AGIs $100k-200k, 96.4% for AGIs over 200k)
Averages for the 2012 tax year for zip code 36305, filed in 2013:
Average Adjusted Gross Income (AGI) in 2012: $75,554 (Individual Income Tax Returns)
Here:
$75,554
State:
$52,001
Salary/wage: $63,855 (reported on 83.0% of returns)
Here:
$63,855
State:
$43,822
(% of AGI for various income ranges: 73.7% for AGIs below $25k, 78.9% for AGIs $25k-50k, 76.5% for AGIs $50k-75k, 76.3% for AGIs $75k-100k, 76.6% for AGIs $100k-200k, 58.4% for AGIs over 200k)
Taxable interest for individuals: $2,149 (reported on 39.0% of returns)
This zip code:
$2,149
Alabama:
$1,592
(% of AGI for various income ranges: 1.8% for AGIs below $25k, 0.9% for AGIs $25k-50k, 0.9% for AGIs $50k-75k, 0.7% for AGIs $75k-100k, 0.8% for AGIs $100k-200k, 1.5% for AGIs over 200k)
Ordinary dividends: $8,122 (reported on 20.7% of returns)
Here:
$8,122
State:
$5,697
(% of AGI for various income ranges: 1.9% for AGIs below $25k, 0.9% for AGIs $25k-50k, 0.9% for AGIs $50k-75k, 1.0% for AGIs $75k-100k, 1.1% for AGIs $100k-200k, 4.3% for AGIs over 200k)
Net capital gain/loss in AGI: +$12,066 (reported on 16.7% of returns)
Here:
+$12,066
State:
+$13,286
(% of AGI for various income ranges: 0.4% for AGIs below $25k, 0.3% for AGIs $25k-50k, 0.6% for AGIs $50k-75k, 0.7% for AGIs $75k-100k, 1.1% for AGIs $100k-200k, 6.1% for AGIs over 200k)
Profit/loss from business: +$17,130 (reported on 14.7% of returns)
Here:
+$17,130
State:
+$9,151
(% of AGI for various income ranges: 6.5% for AGIs below $25k, 2.5% for AGIs $25k-50k, 2.6% for AGIs $50k-75k, 1.8% for AGIs $75k-100k, 2.1% for AGIs $100k-200k, 4.7% for AGIs over 200k)
Taxable individual retirement arrangement distribution: $15,419 (reported on 10.5% of returns)
36305:
$15,419
Alabama:
$14,992
(% of AGI for various income ranges: 3.5% for AGIs below $25k, 2.2% for AGIs $25k-50k, 2.2% for AGIs $50k-75k, 2.4% for AGIs $75k-100k, 2.5% for AGIs $100k-200k, 1.6% for AGIs over 200k)
Self-employment retirement plans: $20,000 (reported on 0.6% of returns)
36305:
$20,000
Alabama:
$20,904
Total itemized deductions: $24,976 (18% of AGI, reported on 37.1% of returns)
Here:
$24,976
State:
$21,388
Here:
17.6% of AGI
State:
20.1% of AGI
(% of AGI for various income ranges: 10.7% for AGIs below $25k, 10.9% for AGIs $25k-50k, 12.1% for AGIs $50k-75k, 12.2% for AGIs $75k-100k, 14.2% for AGIs $100k-200k, 11.7% for AGIs over 200k)
Charity contributions: $8,025 (reported on 31.7% of returns)
Here:
$8,025
State:
$5,925
(% of AGI for various income ranges: 1.4% for AGIs below $25k, 2.1% for AGIs $25k-50k, 2.5% for AGIs $50k-75k, 3.0% for AGIs $75k-100k, 3.9% for AGIs $100k-200k, 4.1% for AGIs over 200k)
Taxes paid: $6,365 (reported on 36.9% of returns)
36305:
$6,365
State:
$5,272
(% of AGI for various income ranges: 0.9% for AGIs below $25k, 1.5% for AGIs $25k-50k, 2.2% for AGIs $50k-75k, 2.5% for AGIs $75k-100k, 3.6% for AGIs $100k-200k, 4.1% for AGIs over 200k)
Earned income credit: $2,318 (reported on 16.4% of returns)
Here:
$2,318
State:
$2,646
(% of AGI for various income ranges: 7.2% for AGIs below $25k, 1.1% for AGIs $25k-50k)
Percentage of individuals using paid preparers for their 2012 taxes: 57.1%
Here:
57%
State:
60%
(% for various income ranges: 52.5% for AGIs below $25k, 54.1% for AGIs $25k-50k, 55.1% for AGIs $50k-75k, 58.1% for AGIs $75k-100k, 63.3% for AGIs $100k-200k, 85.7% for AGIs over 200k)
Averages for the 2004 tax year for zip code 36305, filed in 2005:
Average Adjusted Gross Income (AGI) in 2004: $66,470 (Individual Income Tax Returns)
Here:
$66,470
State:
$42,302
Salary/wage: $54,141 (reported on 85.1% of returns)
Here:
$54,141
State:
$36,626
(% of AGI for various income ranges: 135.6% for AGIs below $10k, 78.3% for AGIs $10k-25k, 81.7% for AGIs $25k-50k, 82.3% for AGIs $50k-75k, 81.9% for AGIs $75k-100k, 58.4% for AGIs over 100k)
Taxable interest for individuals: $2,652 (reported on 46.4% of returns)
This zip code:
$2,652
Alabama:
$1,827
(% of AGI for various income ranges: 7.5% for AGIs below $10k, 2.8% for AGIs $10k-25k, 1.2% for AGIs $25k-50k, 1.1% for AGIs $50k-75k, 1.3% for AGIs $75k-100k, 2.1% for AGIs over 100k)
Taxable dividends: $7,006 (reported on 24.9% of returns)
Here:
$7,006
State:
$4,206
(% of AGI for various income ranges: 4.8% for AGIs below $10k, 1.5% for AGIs $10k-25k, 1.0% for AGIs $25k-50k, 1.2% for AGIs $50k-75k, 0.7% for AGIs $75k-100k, 3.9% for AGIs over 100k)
Net capital gain/loss: +$35,313 (reported on 21.1% of returns)
Here:
+$35,313
State:
+$13,031
(% of AGI for various income ranges: -3.1% for AGIs below $10k, 0.2% for AGIs $10k-25k, 0.1% for AGIs $25k-50k, 0.5% for AGIs $50k-75k, 1.6% for AGIs $75k-100k, 20.1% for AGIs over 100k)
Profit/loss from business: +$10,756 (reported on 15.2% of returns)
Here:
+$10,756
State:
+$8,302
(% of AGI for various income ranges: -0.7% for AGIs below $10k, 2.9% for AGIs $10k-25k, 2.5% for AGIs $25k-50k, 2.6% for AGIs $50k-75k, 1.8% for AGIs $75k-100k, 2.6% for AGIs over 100k)
IRA payment deduction: $3,119 (reported on 2.9% of returns)
36305:
$3,119
Alabama:
$3,006
(% of AGI for various income ranges: 0.2% for AGIs $10k-25k, 0.2% for AGIs $25k-50k, 0.3% for AGIs $50k-75k, 0.2% for AGIs $75k-100k, 0.1% for AGIs over 100k)
Self-employed pension: $20,282 (reported on 0.7% of returns)
Here:
$20,282
Alabama:
$17,165
Total itemized deductions: $20,456 (17% of AGI, reported on 40.3% of returns)
Here:
$20,456
State:
$17,623
Here:
16.5% of AGI
State:
20.8% of AGI
(% of AGI for various income ranges: 19.8% for AGIs below $10k, 11.5% for AGIs $10k-25k, 12.7% for AGIs $25k-50k, 13.9% for AGIs $50k-75k, 15.4% for AGIs $75k-100k, 11.3% for AGIs over 100k)
Charity contributions deductions: $5,984 (5% of AGI, reported on 36.3% of returns)
Here:
$5,984
State:
$4,768
Here:
4.6% of AGI
State:
5.4% of AGI
(% of AGI for various income ranges: 2.1% for AGIs below $10k, 2.0% for AGIs $10k-25k, 2.4% for AGIs $25k-50k, 3.1% for AGIs $50k-75k, 3.8% for AGIs $75k-100k, 3.5% for AGIs over 100k)
Total tax: $13,264 (reported on 77.3% of returns)
36305:
$13,264
State:
$6,905
(% of AGI for various income ranges: 3.7% for AGIs below $10k, 3.7% for AGIs $10k-25k, 6.8% for AGIs $25k-50k, 9.0% for AGIs $50k-75k, 10.5% for AGIs $75k-100k, 21.6% for AGIs over 100k)
Earned income credit: $1,921 (reported on 13.6% of returns)
Here:
$1,921
State:
$2,048
Percentage of individuals using paid preparers for their 2004 taxes: 62.3%
Here:
62%
State:
65%
(% for various income ranges: 55.8% for AGIs below $10k, 59.3% for AGIs $10k-25k, 62.2% for AGIs $25k-50k, 62.3% for AGIs $50k-75k, 61.6% for AGIs $75k-100k, 76.3% for AGIs over 100k)
Likely homosexual households (counted as self-reported same-sex unmarried-partner households)
Lesbian couples: 0.2% of all households
Gay men: 0.0% of all households
Household received Food Stamps/SNAP in the past 12 months: 398 Household did not receive Food Stamps/SNAP in the past 12 months: 6,452
Women who had a birth in the past 12 months: 152 (127 now married, 31 unmarried) Women who did not have a birth in the past 12 months: 3,874 (2,018 now married, 1,852 unmarried)
Housing units in zip code 36305 with a mortgage: 3,216 (221 second mortgage, 7 home equity loan, 174 both second mortgage and home equity loan) Houses without a mortgage: 70
Median monthly owner costs for units with a mortgage: $1,370 Median monthly owner costs for units without a mortgage: $406
Residents with income below the poverty level in 2022:
This zip code:
7.8%
Whole state:
16.2%
Residents with income below 50% of the poverty level in 2022:
This zip code:
5.1%
Whole state:
8.6%
Median number of rooms in houses and condos:
Here:
6.8
State:
6.5
Median number of rooms in apartments:
Here:
4.7
State:
4.7
Notable locations in this zip code not listed on our city pages
Notable locations in zip code 36305: Highland Oaks Golf Course (A), Beaver Creek Sewage Treatment Plant (B), Bay Springs Volunteer Fire Department (C), Wesley Manor (D), The Terrace at Grove Park (E), Dothan Fire Department Station 8 (F). Display/hide their locations on the map
Churches in zip code 36305 include: Mount Gilead Baptist Church (A), Mount Zion Baptist Church (B), Little Vine Primitive Baptist Church (C), Saint Peter Church (D), Bay Springs Baptist Church (E), Tabernacle Methodist Church (F), Green Valley Church (G), Harvest Church (H), Pathway Baptist Church (I). Display/hide their locations on the map
Cemeteries: Memory Hill Cemetery (1), Mount Zion Cemetery (2), Mount Gilead Cemetery (3), Little Vine Cemetery (4), Bay Springs Cemetery (5), Clark Cemetery (6). Display/hide their locations on the map
2,764 married couples with children.
1,023 single-parent households (193 men, 830 women).
93.0% of residents of 36305 zip code speak English at home.
3.1% of residents speak Spanish at home (74% very well, 15% well, 9% not well, 3% not at all).
2.6% of residents speak other Indo-European language at home (79% very well, 21% well, 1% not well).
1.2% of residents speak Asian or Pacific Island language at home (70% very well, 21% well, 9% not well).
0.2% of residents speak other language at home (100% very well).
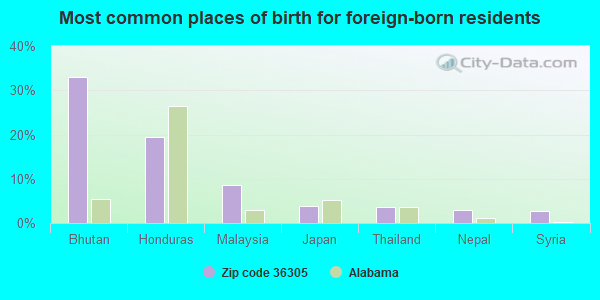
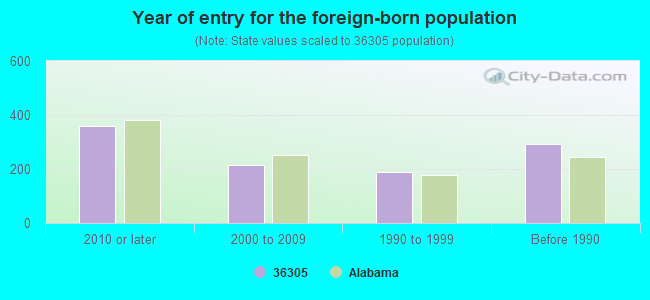
Foreign born population: 830 (4.8%) (64.0% of them are naturalized citizens)
Facilities with environmental interests located in this zip code:
SAGE GROVE SUBDIVISION (BLS LLC in DOTHAN, AL)
National Pollutant Discharge Elimination System NON-MAJOR (Tracking pollutant discharge elimination systems) - permit National Pollutant Discharge Elimination System NON-MAJOR (Tracking pollutant discharge elimination systems) - permit Business SIC classification: GENERAL CONTRACTORS-SINGLE-FAMILY HOUSES Alternative names: BLS LLC SAGE GROVE SUBDIVISION
AMERICAN LUBEFAST LLC #702 (3341 WEST MAIN STREET in DOTHAN, AL)
(Resource Conservation and Recovery Act (tracking hazardous waste)) Business NAICS classification: AUTOMOTIVE OIL CHANGE AND LUBRICATION SHOPS. Alternative names: AMERICAN LUBEFAST LLC SUPER-LUBE #702
BONDYS NISSAN INC (3693 WEST MAIN ST in DOTHAN, AL)
(Resource Conservation and Recovery Act (tracking hazardous waste)) Organizations: AL AUTOMOTIVE REAL ESTATE PARTNERSHIP (CONTACT/OWNER)
BRYANT SUBDIVISION (CHARLES BRYANT in DOTHAN, AL)
National Pollutant Discharge Elimination System NON-MAJOR (Tracking pollutant discharge elimination systems) - permit Business SIC classification: GENERAL CONTRACTORS-RESIDENTIAL BUILDINGS, OTHER THAN SINGLE-FAMILY Alternative names: CHARLES BRYANT BRYANT SUBD
MIKE SMITHS AUTOMOTIVE COLLISION CENTER (2957 HARTFORD HIGHWAY in DOTHAN, AL)
Conditionally Exempt Small Quantity Generators, less than 100 kg/month of hazardous waste (Resource Conservation and Recovery Act (tracking hazardous waste)) Organizations: DAVID EDWARDS (CONTACT/OPERATOR)
, MICHAEL C. SMITH (CONTACT/OWNER)
Housing units lacking complete plumbing facilities: 1.6% Housing units lacking complete kitchen facilities: 1.3%
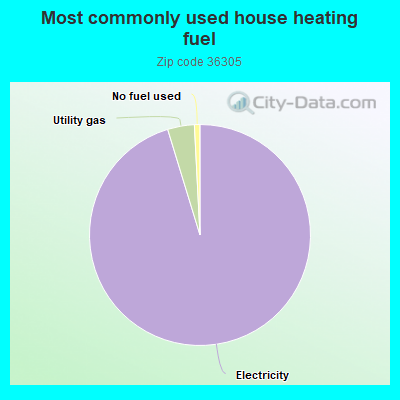
95.1%Electricity
3.9%Utility gas
0.8%No fuel used
Place of birth for U.S.-born residents:
This state: 9,952
Northeast: 503
Midwest: 1,214
South: 4,350
West: 462
44% of the 36305 zip code residents lived in the same house 5 years ago. Out of people who lived in different houses, 48% lived in this county. Out of people who lived in different counties, 50% lived in Alabama.
89% of the 36305 zip code residents lived in the same house 1 year ago. Out of people who lived in different houses, 43% moved from this county. Out of people who lived in different houses, 15% moved from different county within same state. Out of people who lived in different houses, 40% moved from different state. Out of people who lived in different houses, 5% moved from abroad.
Private vs. public school enrollment:
Students in private schools in grades 1 to 8 (elementary and middle school): 580
Here:
28.2%
Alabama:
14.7%
Students in private schools in grades 9 to 12 (high school): 549
Here:
52.6%
Alabama:
16.3%
Students in private undergraduate colleges: 91
Here:
11.2%
Alabama:
14.6%
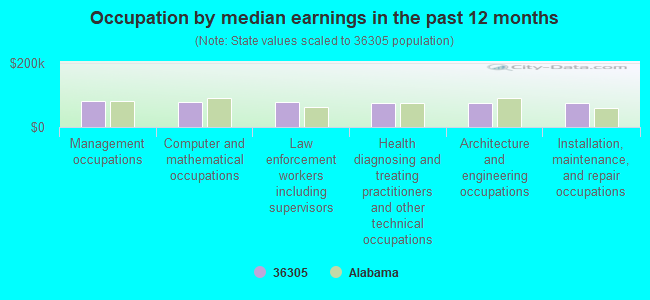
Occupation by median earnings in the past 12 months ($)
80,724Management occupations
77,453Computer and mathematical occupations
76,700Law enforcement workers including supervisors
75,276Health diagnosing and treating practitioners and other technical occupations
73,747Architecture and engineering occupations
73,105Installation, maintenance, and repair occupations
Companies with federal contracts located in this zip code (DOTHAN, AL):
PERSONNEL RESOURCES INC (5855 W MAIN ST; small business) : $747,477 in 40 contractsfrom 2000 to 2006
Contracts for Other Professional Services, Other Administrative Support Services by Army, Navy Signed by year:2000: $64,145; 2001: $28,954; 2002: $4,680; 2003: $147,174; 2004: $206,908; 2005: $289,074; 2006: $6,542.
Biggest contracts:
$132,000 with Army for Other Professional Services. Signed on 2005-10-01. Completion date: 2006-09-30.
$87,408, same as above.Signed on 2004-10-05. Completion date: 2005-09-30.
$68,064, same as above.Signed on 2004-12-20. Completion date: 2005-09-30.
$65,145 with Navy for Other Professional Services. Signed on 2001-01-06. Completion date: 2001-05-15.
HOLLAND MANUFACTURING COMPANY (5115 W STATE HIGHWAY 52; small business) : $59,946 in 5 contractsin 2005
Contracts for Machine Shop Sets, Kits, and Outfits, Bending and Forming Machines, Lease or Rental of Equipment -- Materials Handling Equipment by U.S. Army Corps of Engineers - civil program financing only, Army Signed by year:2000: $0; 2001: $0; 2002: $0; 2003: $0; 2004: $0; 2005: $59,946; 2006: $0.
Biggest contracts:
$20,890 with U.S. Army Corps of Engineers - civil program financing only for Machine Shop Sets, Kits, and Outfits. Taking place in FL. Signed on 2005-06-29. Completion date: 2005-07-21.
$20,890 with Army for Machine Shop Sets, Kits, and Outfits. Taking place in FL. Signed on 2005-06-29. Completion date: 2005-07-21.
$6,143 with Army for Bending and Forming Machines. Taking place in FL. Signed on 2005-08-04. Completion date: 2005-08-31.
$6,143 with U.S. Army Corps of Engineers - civil program financing only for Bending and Forming Machines. Taking place in FL. Signed on 2005-08-04. Completion date: 2005-08-31.
KORNEGAY, RONALD (9638 FORTNER ST; small business) : $26,820 in 2 contractsin 2005
$21,320 with Army for Other Professional Services. Signed on 2005-07-13. Completion date: 2005-11-30.
$5,500, same as above.Signed on 2005-04-07. Completion date: 2005-06-30.
COURT REPORTING ASSOCIATES, IN (256 HONEYSUCKLE ROAD, SUIT; small business) : $13,580 in 16 contractsfrom 2002 to 2006
Contracts for Court Reporting Services, Other Administrative Support Services, Legal Services by Army Signed by year:2000: $0; 2001: $0; 2002: $7,200; 2003: $4,600; 2004: $3,014; 2005: -$134; 2006: -$1,100.
Biggest contracts:
$2,400 with Army for Court Reporting Services. Signed on 2004-09-28. Completion date: 2004-10-19.
$2,400, same as above.Signed on 2002-10-23. Completion date: 2002-10-31.
$2,400, same as above.Signed on 2003-02-05. Completion date: 2003-02-12.
$1,200 with Army for Other Administrative Support Services. Signed on 2005-02-09. Completion date: 2005-02-11.
AMY FRANKLIN (109 GLENFINNAN WAY; small business) : $6,132 in 7 contractsfrom 2002 to 2004
Contracts for Gynecology Services, Other Medical Services by Army Signed by year:2000: $0; 2001: $0; 2002: $3,600; 2003: $5,988; 2004: -$3,456; 2005: $0; 2006: $0.
Biggest contracts:
$3,888 with Army for Gynecology Services. Signed on 2003-11-18. Completion date: 2004-09-30.
$3,600 with Army for Other Medical Services. Signed on 2002-10-29. Completion date: 2002-10-01.
$2,100 with Army for Gynecology Services. Signed on 2003-01-27. Completion date: 2002-09-30.
$0, same as above.Signed on 2003-11-18. Completion date: 2004-09-30.
JOSEPH WILTON SELLERS (203 TULIP LANE APT 2; small business)
$2,860 with Army for Chaplain Services. Signed on 2001-10-01. Completion date: 2002-09-30.
Top industries in this zip code by the number of employees in 2005:
Health Care and Social Assistance: General Medical and Surgical Hospitals (over 1000 employees: 1 establishment)
Health Care and Social Assistance: Continuing Care Retirement Communities (250-499: 1)
Health Care and Social Assistance: Offices of Physicians (except Mental Health Specialists) (50-99: 1, 20-49: 6, 10-19: 2, 5-9: 6, 1-4: 8)
Other Services (except Public Administration): Religious Organizations (100-249: 1, 20-49: 2, 10-19: 1, 5-9: 3, 1-4: 4)
Health Care and Social Assistance: Nursing Care Facilities (100-249: 1)
Administrative and Support and Waste Management and Remediation Services: Temporary Help Services (50-99: 2)
Accommodation and Food Services: Limited-Service Restaurants (20-49: 2, 10-19: 3)
Health Care and Social Assistance: Home Health Care Services (50-99: 1, 5-9: 1)
People in group quarters in 2010:
175 people in nursing facilities/skilled-nursing facilities
2 people in workers' group living quarters and job corps centers
People in group quarters in 2000:
395 people in nursing homes
Fatal accident statistics in 2014:
Fatal accident count: 2
Vehicles involved in fatal accidents: 2
Fatal accidents caused by drunken drivers: 1
Fatalities: 2
Persons involved in fatal accidents: 3
Pedestrians involved in fatal accidents: 1
Fatal accident statistics in 2013:
Fatal accident count: 2
Vehicles involved in fatal accidents: 4
Fatal accidents caused by drunken drivers: 0
Fatalities: 2
Persons involved in fatal accidents: 5
Pedestrians involved in fatal accidents: 0
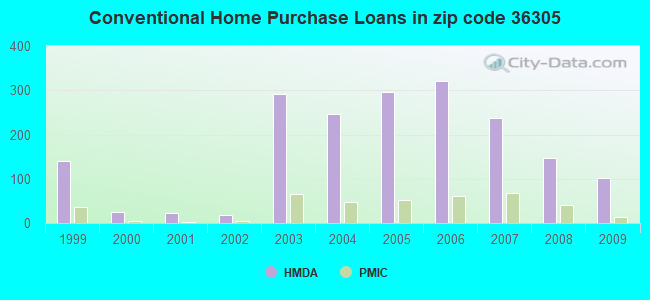
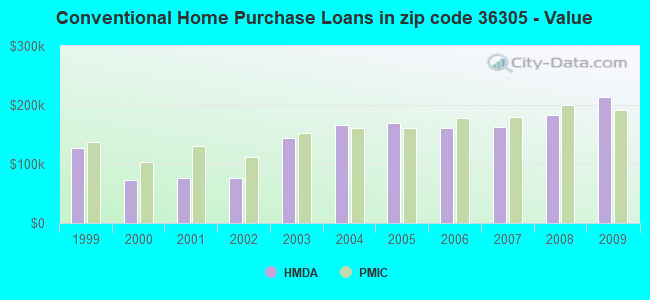
Home Mortgage Disclosure Act Aggregated Statistics For Year 2009 (Based on 1 full and 2 partial tracts)
A) FHA, FSA/RHS & VA Home Purchase Loans
B) Conventional Home Purchase Loans
C) Refinancings
D) Home Improvement Loans
F) Non-occupant Loans on < 5 Family Dwellings (A B C & D)
G) Loans On Manufactured Home Dwelling (A B C & D)
Number
Average Value
Number
Average Value
Number
Average Value
Number
Average Value
Number
Average Value
Number
Average Value
LOANS ORIGINATED
91
$168,788
101
$213,904
354
$186,460
21
$57,607
43
$180,370
7
$51,687
APPLICATIONS APPROVED, NOT ACCEPTED
2
$134,190
2
$82,965
18
$210,958
1
$56,000
2
$122,110
2
$51,820
APPLICATIONS DENIED
3
$187,380
7
$190,031
60
$158,724
5
$86,330
3
$146,673
3
$57,350
APPLICATIONS WITHDRAWN
8
$145,341
8
$212,021
78
$189,532
0
$0
2
$166,385
0
$0
FILES CLOSED FOR INCOMPLETENESS
5
$153,766
1
$218,810
23
$239,937
1
$30,920
3
$156,003
0
$0
Aggregated Statistics For Year 2008 (Based on 1 full and 2 partial tracts)
A) FHA, FSA/RHS & VA Home Purchase Loans
B) Conventional Home Purchase Loans
C) Refinancings
D) Home Improvement Loans
E) Loans on Dwellings For 5+ Families
F) Non-occupant Loans on < 5 Family Dwellings (A B C & D)
G) Loans On Manufactured Home Dwelling (A B C & D)
Number
Average Value
Number
Average Value
Number
Average Value
Number
Average Value
Number
Average Value
Number
Average Value
Number
Average Value
LOANS ORIGINATED
73
$164,650
147
$183,305
183
$166,518
22
$50,915
1
$499,150
38
$132,444
7
$58,647
APPLICATIONS APPROVED, NOT ACCEPTED
2
$166,760
15
$147,676
20
$144,371
2
$41,575
0
$0
6
$115,877
7
$56,063
APPLICATIONS DENIED
5
$155,394
11
$138,589
94
$183,043
15
$63,431
0
$0
6
$201,015
7
$62,934
APPLICATIONS WITHDRAWN
6
$156,088
22
$160,499
59
$159,389
5
$84,534
1
$5,343,720
7
$90,543
1
$68,600
FILES CLOSED FOR INCOMPLETENESS
0
$0
1
$167,380
12
$213,953
0
$0
0
$0
0
$0
0
$0
Aggregated Statistics For Year 2007 (Based on 1 full and 2 partial tracts)
A) FHA, FSA/RHS & VA Home Purchase Loans
B) Conventional Home Purchase Loans
C) Refinancings
D) Home Improvement Loans
F) Non-occupant Loans on < 5 Family Dwellings (A B C & D)
G) Loans On Manufactured Home Dwelling (A B C & D)
Number
Average Value
Number
Average Value
Number
Average Value
Number
Average Value
Number
Average Value
Number
Average Value
LOANS ORIGINATED
44
$150,077
238
$162,437
196
$159,135
30
$38,740
52
$134,404
10
$49,113
APPLICATIONS APPROVED, NOT ACCEPTED
1
$368,210
14
$118,802
31
$202,537
8
$70,706
2
$97,330
2
$30,120
APPLICATIONS DENIED
2
$165,205
26
$85,199
96
$150,409
20
$62,421
12
$98,083
16
$47,497
APPLICATIONS WITHDRAWN
6
$150,050
27
$177,980
60
$191,260
3
$67,963
3
$108,797
2
$65,435
FILES CLOSED FOR INCOMPLETENESS
0
$0
5
$143,934
10
$176,861
1
$27,040
3
$136,430
0
$0
Aggregated Statistics For Year 2006 (Based on 1 full and 2 partial tracts)
A) FHA, FSA/RHS & VA Home Purchase Loans
B) Conventional Home Purchase Loans
C) Refinancings
D) Home Improvement Loans
E) Loans on Dwellings For 5+ Families
F) Non-occupant Loans on < 5 Family Dwellings (A B C & D)
G) Loans On Manufactured Home Dwelling (A B C & D)
Number
Average Value
Number
Average Value
Number
Average Value
Number
Average Value
Number
Average Value
Number
Average Value
Number
Average Value
LOANS ORIGINATED
49
$168,690
320
$160,967
191
$169,572
31
$47,749
1
$3,113,600
59
$141,349
6
$49,300
APPLICATIONS APPROVED, NOT ACCEPTED
0
$0
17
$168,853
37
$100,923
2
$44,420
0
$0
1
$46,560
2
$62,850
APPLICATIONS DENIED
1
$19,200
32
$116,362
66
$111,267
17
$60,166
0
$0
6
$108,980
8
$35,715
APPLICATIONS WITHDRAWN
5
$174,042
24
$181,031
61
$136,848
2
$104,695
0
$0
4
$68,545
2
$34,560
FILES CLOSED FOR INCOMPLETENESS
0
$0
4
$67,315
26
$143,223
1
$142,540
0
$0
1
$58,380
0
$0
Aggregated Statistics For Year 2005 (Based on 1 full and 2 partial tracts)
A) FHA, FSA/RHS & VA Home Purchase Loans
B) Conventional Home Purchase Loans
C) Refinancings
D) Home Improvement Loans
F) Non-occupant Loans on < 5 Family Dwellings (A B C & D)
G) Loans On Manufactured Home Dwelling (A B C & D)
Number
Average Value
Number
Average Value
Number
Average Value
Number
Average Value
Number
Average Value
Number
Average Value
LOANS ORIGINATED
55
$150,533
297
$169,887
168
$150,684
22
$25,914
43
$114,683
7
$67,167
APPLICATIONS APPROVED, NOT ACCEPTED
1
$75,310
24
$95,010
44
$132,648
4
$58,630
3
$91,353
5
$69,300
APPLICATIONS DENIED
3
$108,867
45
$100,403
110
$110,486
22
$57,064
9
$43,449
16
$48,762
APPLICATIONS WITHDRAWN
3
$154,713
36
$130,009
75
$133,002
12
$78,992
7
$78,217
1
$65,320
FILES CLOSED FOR INCOMPLETENESS
0
$0
5
$117,024
22
$131,725
2
$85,040
1
$88,820
0
$0
Aggregated Statistics For Year 2004 (Based on 1 full and 2 partial tracts)
A) FHA, FSA/RHS & VA Home Purchase Loans
B) Conventional Home Purchase Loans
C) Refinancings
D) Home Improvement Loans
F) Non-occupant Loans on < 5 Family Dwellings (A B C & D)
G) Loans On Manufactured Home Dwelling (A B C & D)
Number
Average Value
Number
Average Value
Number
Average Value
Number
Average Value
Number
Average Value
Number
Average Value
LOANS ORIGINATED
45
$128,711
246
$165,835
226
$146,952
21
$36,598
41
$109,206
8
$35,638
APPLICATIONS APPROVED, NOT ACCEPTED
1
$162,490
26
$128,012
36
$128,051
2
$33,445
3
$126,547
5
$47,268
APPLICATIONS DENIED
3
$140,470
20
$111,370
104
$116,178
19
$42,914
8
$69,326
8
$30,371
APPLICATIONS WITHDRAWN
4
$119,862
20
$135,426
84
$137,367
4
$53,708
1
$102,620
1
$86,450
FILES CLOSED FOR INCOMPLETENESS
0
$0
5
$164,208
18
$169,008
1
$56,770
0
$0
0
$0
Aggregated Statistics For Year 2003 (Based on 1 full and 2 partial tracts)
A) FHA, FSA/RHS & VA Home Purchase Loans
B) Conventional Home Purchase Loans
C) Refinancings
D) Home Improvement Loans
E) Loans on Dwellings For 5+ Families
F) Non-occupant Loans on < 5 Family Dwellings (A B C & D)
Number
Average Value
Number
Average Value
Number
Average Value
Number
Average Value
Number
Average Value
Number
Average Value
LOANS ORIGINATED
78
$128,991
292
$143,308
475
$147,781
25
$53,960
1
$3,113,600
47
$94,901
APPLICATIONS APPROVED, NOT ACCEPTED
1
$230,260
24
$108,941
53
$122,418
4
$31,235
0
$0
4
$85,138
APPLICATIONS DENIED
4
$108,270
20
$66,938
108
$122,150
11
$26,375
1
$3,308,200
6
$96,835
APPLICATIONS WITHDRAWN
6
$111,750
24
$135,051
58
$140,176
2
$12,430
0
$0
4
$104,085
FILES CLOSED FOR INCOMPLETENESS
1
$174,170
2
$129,755
18
$141,553
1
$14,590
0
$0
0
$0
Aggregated Statistics For Year 2002 (Based on 2 partial tracts)
A) FHA, FSA/RHS & VA Home Purchase Loans
B) Conventional Home Purchase Loans
C) Refinancings
D) Home Improvement Loans
F) Non-occupant Loans on < 5 Family Dwellings (A B C & D)
Number
Average Value
Number
Average Value
Number
Average Value
Number
Average Value
Number
Average Value
LOANS ORIGINATED
8
$98,835
17
$76,936
39
$112,393
3
$15,927
4
$37,090
APPLICATIONS APPROVED, NOT ACCEPTED
0
$0
3
$61,967
7
$80,449
0
$0
0
$0
APPLICATIONS DENIED
0
$0
9
$49,924
15
$80,313
3
$15,203
1
$23,880
APPLICATIONS WITHDRAWN
1
$54,180
1
$85,870
8
$72,149
0
$0
0
$0
FILES CLOSED FOR INCOMPLETENESS
0
$0
0
$0
2
$90,360
0
$0
0
$0
Aggregated Statistics For Year 2001 (Based on 2 partial tracts)
A) FHA, FSA/RHS & VA Home Purchase Loans
B) Conventional Home Purchase Loans
C) Refinancings
D) Home Improvement Loans
F) Non-occupant Loans on < 5 Family Dwellings (A B C & D)
Number
Average Value
Number
Average Value
Number
Average Value
Number
Average Value
Number
Average Value
LOANS ORIGINATED
6
$90,737
22
$75,586
45
$104,422
6
$38,127
6
$61,085
APPLICATIONS APPROVED, NOT ACCEPTED
0
$0
6
$77,472
4
$66,145
1
$70,330
1
$24,620
APPLICATIONS DENIED
0
$0
23
$33,749
12
$61,344
2
$19,480
1
$11,210
APPLICATIONS WITHDRAWN
0
$0
1
$72,750
7
$63,033
0
$0
0
$0
FILES CLOSED FOR INCOMPLETENESS
0
$0
0
$0
1
$53,790
0
$0
0
$0
Aggregated Statistics For Year 2000 (Based on 2 partial tracts)
A) FHA, FSA/RHS & VA Home Purchase Loans
B) Conventional Home Purchase Loans
C) Refinancings
D) Home Improvement Loans
F) Non-occupant Loans on < 5 Family Dwellings (A B C & D)
Number
Average Value
Number
Average Value
Number
Average Value
Number
Average Value
Number
Average Value
LOANS ORIGINATED
6
$81,015
25
$73,674
14
$80,354
5
$24,700
4
$41,208
APPLICATIONS APPROVED, NOT ACCEPTED
1
$67,840
8
$49,601
3
$49,593
0
$0
0
$0
APPLICATIONS DENIED
2
$49,020
25
$40,485
9
$52,597
2
$22,445
1
$11,680
APPLICATIONS WITHDRAWN
2
$61,020
1
$90,560
3
$72,063
0
$0
0
$0
FILES CLOSED FOR INCOMPLETENESS
0
$0
0
$0
1
$88,930
0
$0
0
$0
Aggregated Statistics For Year 1999 (Based on 3 partial tracts)
A) FHA, FSA/RHS & VA Home Purchase Loans
B) Conventional Home Purchase Loans
C) Refinancings
D) Home Improvement Loans
F) Non-occupant Loans on < 5 Family Dwellings (A B C & D)
2003 - 2018 National Fire Incident Reporting System (NFIRS) incidents
Based on the data from the years 2003 - 2018 the average number of fires per year is 26. The highest number of fire incidents - 48 took place in 2011, and the least - 1 in 2005. The data has an increasing trend.
When looking into fire subcategories, the most incidents belonged to: Outside Fires (48.4%), and Structure Fires (31.8%).
Fire incident types reported to NFIRS in Zip Code 36305


 Nearest zip codes: 36303, 36301, 36371, 36352, 36375, 36350.


 Based on the data from the years 2003 - 2018 the average number of fires per year is 26. The highest number of fire incidents - 48 took place in 2011, and the least - 1 in 2005. The data has an increasing trend.
 When looking into fire subcategories, the most incidents belonged to: Outside Fires (48.4%), and Structure Fires (31.8%).