Estimated zip code population in 2022: 5,529 Zip code population in 2010: 4,679 Zip code population in 2000: 3,114
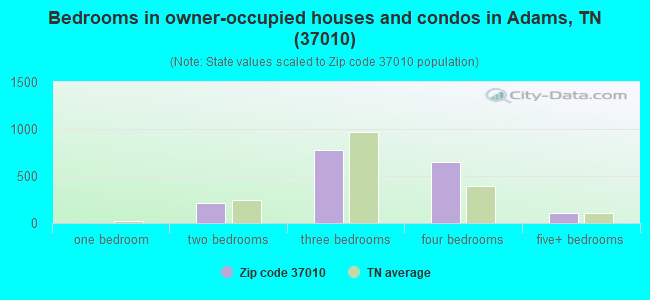
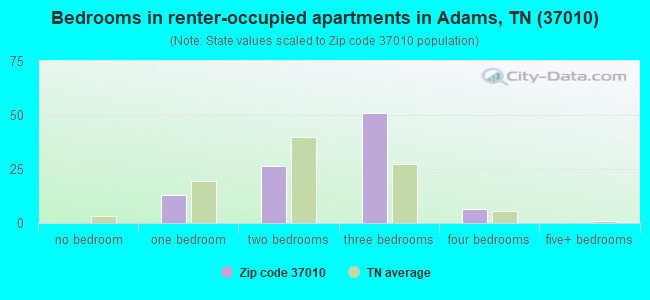
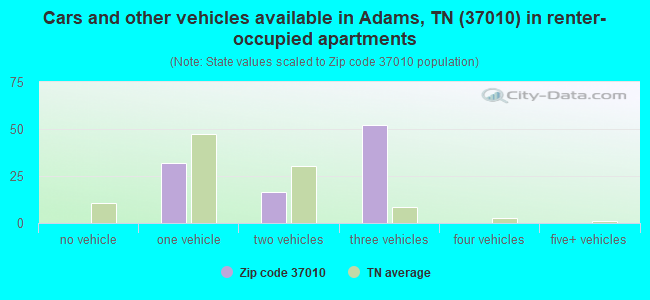
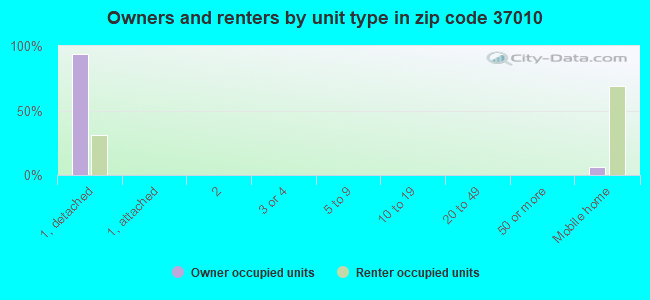
Houses and condos: 2,003 Renter-occupied apartments: 98
% of renters here:
5%
State:
33%
March 2022 cost of living index in zip code 37010: 80.3 (low, U.S. average is 100)
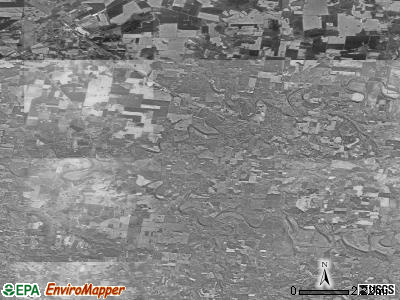
Land area: 77.3 sq. mi. Water area: 0.1 sq. mi.
Population density: 71 people per square mile
(very low).
OSM Map
General Map
Google Map
MSN Map
OSM Map
General Map
Google Map
MSN Map
OSM Map
General Map
Google Map
MSN Map
OSM Map
General Map
Google Map
MSN Map
Please wait while loading the map...
Real estate property taxes paid for housing units in 2022:
This zip code:
0.4% ($1,829)
Tennessee:
0.5% ($1,376)
Median real estate property taxes paid for housing units with mortgages in 2022: $1,963 (0.4%) Median real estate property taxes paid for housing units with no mortgage in 2022: $1,605 (0.4%)
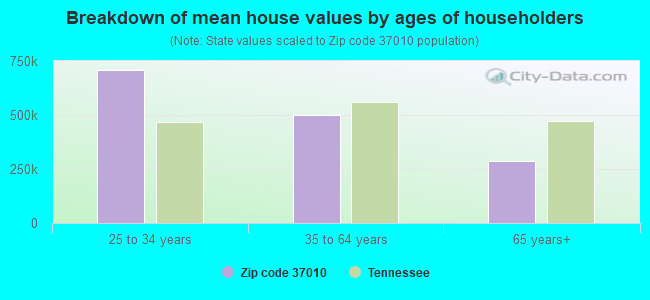
Estimated median house/condo value in 2022: $413,886
37010:
$413,886
Tennessee:
$284,800
According to our research of Tennessee and other state lists, there were 8 registered sex offenders living in 37010 zip code as of April 25, 2024. The ratio of all residents to sex offenders in zip code 37010 is 659 to 1. The ratio of registered sex offenders to all residents in this zip code is lower than the state average.
Median resident age:
This zip code:
37.7 years
Tennessee median age:
39.2 years
Average household size:
This zip code:
3.0 people
Tennessee:
2.4 people
Averages for the 2020 tax year for zip code 37010, filed in 2021:
Average Adjusted Gross Income (AGI) in 2020: $85,810 (Individual Income Tax Returns)
Here:
$85,810
State:
$69,014
Salary/wage: $61,876 (reported on 83.3% of returns)
Here:
$61,876
State:
$55,872
(% of AGI for various income ranges: 1635.8% for AGIs below $25k, 3412.0% for AGIs $25k-50k, 6203.2% for AGIs $50k-75k, 9400.9% for AGIs $75k-100k, 16800.3% for AGIs $100k-200k, 69365.0% for AGIs over 200k)
Taxable interest for individuals: $1,512 (reported on 32.0% of returns)
This zip code:
$1,512
Tennessee:
$1,945
(% of AGI for various income ranges: 10.6% for AGIs below $25k, 35.8% for AGIs $25k-50k, 20.8% for AGIs $50k-75k, 100.0% for AGIs $75k-100k, 112.4% for AGIs $100k-200k, 1222.5% for AGIs over 200k)
Ordinary dividends: $4,075 (reported on 17.5% of returns)
Here:
$4,075
State:
$8,105
(% of AGI for various income ranges: 18.3% for AGIs below $25k, 28.5% for AGIs $25k-50k, 93.2% for AGIs $50k-75k, 52.7% for AGIs $75k-100k, 214.8% for AGIs $100k-200k, 1717.5% for AGIs over 200k)
Net capital gain/loss in AGI: +$41,787 (reported on 16.4% of returns)
Here:
+$41,787
State:
+$33,664
(% of AGI for various income ranges: 15.1% for AGIs below $25k, 26.8% for AGIs $25k-50k, 102.0% for AGIs $50k-75k, 146.8% for AGIs $75k-100k, 472.4% for AGIs $100k-200k, 41200.0% for AGIs over 200k)
Profit/loss from business: +$26,000 (reported on 18.2% of returns)
Here:
+$26,000
State:
+$18,991
(% of AGI for various income ranges: 116.0% for AGIs below $25k, 289.8% for AGIs $25k-50k, 273.2% for AGIs $50k-75k, 400.9% for AGIs $75k-100k, 766.1% for AGIs $100k-200k, 17832.5% for AGIs over 200k)
Taxable individual retirement arrangement distribution: $16,419 (reported on 7.6% of returns)
37010:
$16,419
Tennessee:
$20,036
(% of AGI for various income ranges: 41.9% for AGIs below $25k, 113.8% for AGIs $25k-50k, 126.4% for AGIs $50k-75k, 178.2% for AGIs $75k-100k, 625.2% for AGIs $100k-200k)
Total itemized deductions: $34,429 (reported on 6.2% of returns)
Here:
$34,429
State:
$40,136
(% of AGI for various income ranges: 112.6% for AGIs below $25k, 222.0% for AGIs $50k-75k, 269.1% for AGIs $75k-100k, 641.2% for AGIs $100k-200k, 4982.5% for AGIs over 200k)
Charity contributions: $15,807 (reported on 5.1% of returns)
Here:
$15,807
State:
$19,852
(% of AGI for various income ranges: 160.8% for AGIs $50k-75k, 208.8% for AGIs $100k-200k, 2805.0% for AGIs over 200k)
Taxes paid: $5,906 (reported on 5.8% of returns)
37010:
$5,906
State:
$6,038
(% of AGI for various income ranges: 15.5% for AGIs below $25k, 28.0% for AGIs $50k-75k, 46.4% for AGIs $75k-100k, 110.3% for AGIs $100k-200k, 817.5% for AGIs over 200k)
Earned income credit: $2,365 (reported on 11.3% of returns)
Here:
$2,365
State:
$2,391
(% of AGI for various income ranges: 82.8% for AGIs below $25k, 73.5% for AGIs $25k-50k)
Percentage of individuals using paid preparers for their 2020 taxes: 90.2%
Here:
90%
State:
93%
(% for various income ranges: 81.8% for AGIs below $25k, 93.9% for AGIs $25k-50k, 94.3% for AGIs $50k-75k, 93.8% for AGIs $75k-100k, 94.6% for AGIs $100k-200k, 93.3% for AGIs over 200k)
Averages for the 2012 tax year for zip code 37010, filed in 2013:
Average Adjusted Gross Income (AGI) in 2012: $67,819 (Individual Income Tax Returns)
Here:
$67,819
State:
$53,767
Salary/wage: $52,033 (reported on 85.1% of returns)
Here:
$52,033
State:
$45,421
(% of AGI for various income ranges: 75.3% for AGIs below $25k, 79.0% for AGIs $25k-50k, 79.8% for AGIs $50k-75k, 78.3% for AGIs $75k-100k, 77.3% for AGIs $100k-200k, 28.5% for AGIs over 200k)
Taxable interest for individuals: $919 (reported on 35.6% of returns)
This zip code:
$919
Tennessee:
$1,732
(% of AGI for various income ranges: 0.5% for AGIs below $25k, 0.5% for AGIs $25k-50k, 0.3% for AGIs $50k-75k, 0.8% for AGIs $75k-100k, 0.3% for AGIs $100k-200k, 0.5% for AGIs over 200k)
Ordinary dividends: $3,152 (reported on 19.8% of returns)
Here:
$3,152
State:
$6,739
(% of AGI for various income ranges: 2.6% for AGIs below $25k, 1.3% for AGIs $25k-50k, 0.3% for AGIs $50k-75k, 0.7% for AGIs $75k-100k, 0.7% for AGIs $100k-200k, 1.0% for AGIs over 200k)
Net capital gain/loss in AGI: +$9,915 (reported on 15.3% of returns)
Here:
+$9,915
State:
+$19,082
(% of AGI for various income ranges: 0.2% for AGIs below $25k, 0.4% for AGIs $25k-50k, 0.4% for AGIs $50k-75k, 0.5% for AGIs $75k-100k, 2.2% for AGIs $100k-200k, 5.6% for AGIs over 200k)
Profit/loss from business: +$26,350 (reported on 18.0% of returns)
Here:
+$26,350
State:
+$15,240
(% of AGI for various income ranges: 8.6% for AGIs below $25k, 5.3% for AGIs $25k-50k, 5.9% for AGIs $50k-75k, 3.3% for AGIs $75k-100k, 4.8% for AGIs $100k-200k, 12.6% for AGIs over 200k)
Taxable individual retirement arrangement distribution: $11,825 (reported on 7.2% of returns)
37010:
$11,825
Tennessee:
$15,505
(% of AGI for various income ranges: 1.3% for AGIs below $25k, 1.2% for AGIs $25k-50k, 1.5% for AGIs $50k-75k, 1.1% for AGIs $75k-100k, 2.4% for AGIs $100k-200k)
Self-employment retirement plans: $25,250 (reported on 0.9% of returns)
37010:
$25,250
Tennessee:
$22,567
Total itemized deductions: $20,967 (16% of AGI, reported on 30.2% of returns)
Here:
$20,967
State:
$21,976
Here:
16.0% of AGI
State:
17.8% of AGI
(% of AGI for various income ranges: 7.6% for AGIs below $25k, 10.9% for AGIs $25k-50k, 9.8% for AGIs $50k-75k, 10.7% for AGIs $75k-100k, 11.6% for AGIs $100k-200k, 5.5% for AGIs over 200k)
Charity contributions: $5,042 (reported on 24.8% of returns)
Here:
$5,042
State:
$6,709
(% of AGI for various income ranges: 0.6% for AGIs below $25k, 1.7% for AGIs $25k-50k, 1.4% for AGIs $50k-75k, 2.0% for AGIs $75k-100k, 2.5% for AGIs $100k-200k, 1.6% for AGIs over 200k)
Taxes paid: $4,680 (reported on 29.7% of returns)
37010:
$4,680
State:
$4,829
(% of AGI for various income ranges: 1.2% for AGIs below $25k, 1.6% for AGIs $25k-50k, 2.0% for AGIs $50k-75k, 2.3% for AGIs $75k-100k, 2.8% for AGIs $100k-200k, 1.6% for AGIs over 200k)
Earned income credit: $2,241 (reported on 14.4% of returns)
Here:
$2,241
State:
$2,404
(% of AGI for various income ranges: 5.5% for AGIs below $25k, 1.2% for AGIs $25k-50k)
Percentage of individuals using paid preparers for their 2012 taxes: 53.6%
Here:
54%
State:
52%
(% for various income ranges: 53.1% for AGIs below $25k, 53.7% for AGIs $25k-50k, 50.0% for AGIs $50k-75k, 53.8% for AGIs $75k-100k, 51.5% for AGIs $100k-200k, 85.7% for AGIs over 200k)
Averages for the 2004 tax year for zip code 37010, filed in 2005:
Average Adjusted Gross Income (AGI) in 2004: $46,601 (Individual Income Tax Returns)
Here:
$46,601
State:
$44,088
Salary/wage: $43,130 (reported on 84.7% of returns)
Here:
$43,130
State:
$38,825
(% of AGI for various income ranges: 106.5% for AGIs below $10k, 73.7% for AGIs $10k-25k, 84.1% for AGIs $25k-50k, 81.9% for AGIs $50k-75k, 82.1% for AGIs $75k-100k, 67.7% for AGIs over 100k)
Taxable interest for individuals: $1,203 (reported on 43.9% of returns)
This zip code:
$1,203
Tennessee:
$1,802
(% of AGI for various income ranges: 2.9% for AGIs below $10k, 1.8% for AGIs $10k-25k, 0.8% for AGIs $25k-50k, 1.4% for AGIs $50k-75k, 0.8% for AGIs $75k-100k, 1.1% for AGIs over 100k)
Taxable dividends: $2,460 (reported on 20.2% of returns)
Here:
$2,460
State:
$3,727
(% of AGI for various income ranges: 4.2% for AGIs below $10k, 0.6% for AGIs $10k-25k, 0.3% for AGIs $25k-50k, 0.6% for AGIs $50k-75k, 0.6% for AGIs $75k-100k, 2.3% for AGIs over 100k)
Net capital gain/loss: +$5,511 (reported on 16.3% of returns)
Here:
+$5,511
State:
+$15,776
(% of AGI for various income ranges: 1.3% for AGIs below $10k, 0.3% for AGIs $10k-25k, 0.5% for AGIs $25k-50k, 1.4% for AGIs $50k-75k, 0.7% for AGIs $75k-100k, 4.9% for AGIs over 100k)
Profit/loss from business: +$14,733 (reported on 17.8% of returns)
Here:
+$14,733
State:
+$12,882
(% of AGI for various income ranges: 7.7% for AGIs below $10k, 5.7% for AGIs $10k-25k, 4.0% for AGIs $25k-50k, 2.9% for AGIs $50k-75k, 5.2% for AGIs $75k-100k, 9.4% for AGIs over 100k)
IRA payment deduction: $3,825 (reported on 2.5% of returns)
37010:
$3,825
Tennessee:
$2,934
Self-employed pension: $16,042 (reported on 1.5% of returns)
Here:
$16,042
Tennessee:
$16,857
Total itemized deductions: $15,691 (20% of AGI, reported on 31.0% of returns)
Here:
$15,691
State:
$18,035
Here:
19.8% of AGI
State:
19.9% of AGI
(% of AGI for various income ranges: 5.7% for AGIs $10k-25k, 9.5% for AGIs $25k-50k, 11.7% for AGIs $50k-75k, 12.2% for AGIs $75k-100k, 10.5% for AGIs over 100k)
Charity contributions deductions: $3,359 (4% of AGI, reported on 26.9% of returns)
Here:
$3,359
State:
$5,167
Here:
4.1% of AGI
State:
5.3% of AGI
(% of AGI for various income ranges: 0.8% for AGIs $10k-25k, 1.4% for AGIs $25k-50k, 1.7% for AGIs $50k-75k, 2.3% for AGIs $75k-100k, 2.7% for AGIs over 100k)
Total tax: $6,240 (reported on 80.4% of returns)
37010:
$6,240
State:
$7,482
(% of AGI for various income ranges: 3.1% for AGIs below $10k, 4.6% for AGIs $10k-25k, 6.9% for AGIs $25k-50k, 8.2% for AGIs $50k-75k, 11.2% for AGIs $75k-100k, 17.6% for AGIs over 100k)
Earned income credit: $1,506 (reported on 10.7% of returns)
Here:
$1,506
State:
$1,826
Percentage of individuals using paid preparers for their 2004 taxes: 57.0%
Here:
57%
State:
60%
(% for various income ranges: 46.6% for AGIs below $10k, 61.2% for AGIs $10k-25k, 62.4% for AGIs $25k-50k, 56.7% for AGIs $50k-75k, 54.3% for AGIs $75k-100k, 59.1% for AGIs over 100k)
Household received Food Stamps/SNAP in the past 12 months: 131 Household did not receive Food Stamps/SNAP in the past 12 months: 1,706
Women who had a birth in the past 12 months: 92 (48 now married, 42 unmarried) Women who did not have a birth in the past 12 months: 1,217 (629 now married, 588 unmarried)
Housing units in zip code 37010 with a mortgage: 1,134 (146 second mortgage, 148 both second mortgage and home equity loan) Houses without a mortgage: 68
Median monthly owner costs for units with a mortgage: $2,009 Median monthly owner costs for units without a mortgage: $432
Residents with income below the poverty level in 2022:
This zip code:
10.2%
Whole state:
13.3%
Residents with income below 50% of the poverty level in 2022:
This zip code:
2.6%
Whole state:
7.1%
Median number of rooms in houses and condos:
Here:
8.0
State:
6.5
Median number of rooms in apartments:
Here:
6.1
State:
4.4
Notable locations in this zip code not listed on our city pages
Churches in zip code 37010 include: Little Star Church (A), Little Hope Church (B), Port Royal Church (C), Sadlersville Church (D), Harmony Church (E), Bells Church (F), Mount Zion Baptist Church (G), Red River Baptist Church (H). Display/hide their locations on the map
Cemeteries: Warfield Cemetery (1), Wall Cemetery (2), Suggs Cemetery (3), Stroud Cemetery (4), Story Cemetery (5), Stainback Cemetery (6), Sherrod Cemetery (7). Display/hide their locations on the map
Streams, rivers, and creeks: Chambers Spring Branch (A), Sulphur Fork Red River (B), Brush Creek (C), West Fork Creek (D), Millers Creek (E). Display/hide their locations on the map
In group quarters: 26 (-1 institutionalized population)
Size of family households: 361 2-persons, 484 3-persons, 348 4-persons, 105 5-persons, 107 6-persons, 82 7-or-more-persons
Size of nonfamily households: 295 1-person, 48 2-persons
1,109 married couples with children.
230 single-parent households (17 men, 213 women).
95.7% of residents of 37010 zip code speak English at home.
3.2% of residents speak Spanish at home (95% very well, 5% not at all).
0.5% of residents speak other Indo-European language at home (100% very well).
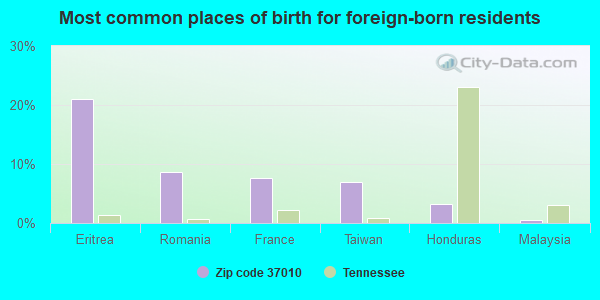
Foreign born population: 184 (3.3%) (96.0% of them are naturalized citizens)
This zip code:
3.3%
Whole state:
5.6%
21%Eritrea
9%Romania
8%France
7%Taiwan
3%Honduras
1%Malaysia
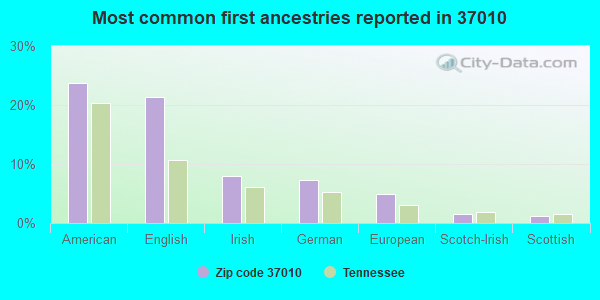
24%American
21%English
8%Irish
7%German
5%European
1%Scotch-Irish
1%Scottish
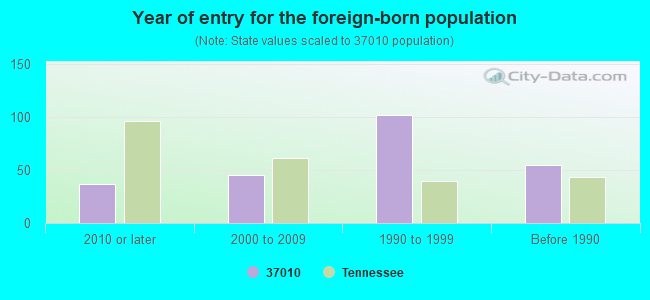
Year of entry for the foreign-born population
372010 or later
452000 to 2009
1021990 to 1999
55Before 1990
Facilities with environmental interests located in this zip code:
ADAMS-CEDAR HILL WATER SYSTEM (608 KEYSBURG ROAD in ADAMS, TN)
National Pollutant Discharge Elimination System NON-MAJOR (Tracking pollutant discharge elimination systems) - permit National Pollutant Discharge Elimination System NON-MAJOR (Tracking pollutant discharge elimination systems) - permit COMMUNITY WATER SYSTEM (SDWIS) - SDWIS-TN0000001 1T, WATER TREATMENT PLANT Business SIC classification: WATER SUPPLY Alternative names: INDUSTRIAL PLATING CO.
BAGGETT FARMS GRAIN AND SEED CO (HWY 41 N in ADAMS, TN)
AIR SYNTHETIC MINOR (AIRS/AFS)
Housing units lacking complete plumbing facilities: 4.2% Housing units lacking complete kitchen facilities: 4.1%
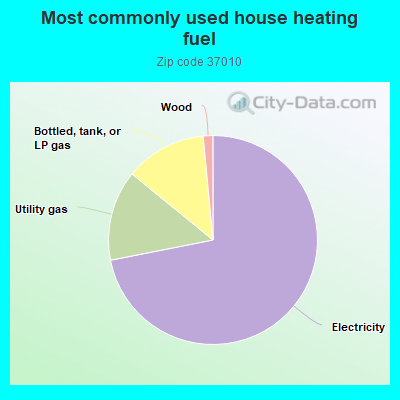
71.9%Electricity
14.0%Utility gas
12.6%Bottled, tank, or LP gas
1.5%Wood
Population in 1990: 2,660. Population change in the 1990s: +454 (+17.1%).
Place of birth for U.S.-born residents:
This state: 2,365
Northeast: 417
Midwest: 605
South: 1,347
West: 604
61% of the 37010 zip code residents lived in the same house 5 years ago. Out of people who lived in different houses, 60% lived in this county. Out of people who lived in different counties, 50% lived in Tennessee.
93% of the 37010 zip code residents lived in the same house 1 year ago. Out of people who lived in different houses, 6% moved from this county. Out of people who lived in different houses, 20% moved from different county within same state. Out of people who lived in different houses, 85% moved from different state.
Private vs. public school enrollment:
Students in private schools in grades 1 to 8 (elementary and middle school): 146
Here:
16.4%
Tennessee:
15.0%
Students in private schools in grades 9 to 12 (high school): 110
Here:
27.4%
Tennessee:
16.2%
Students in private undergraduate colleges: 50
Here:
12.4%
Tennessee:
23.5%
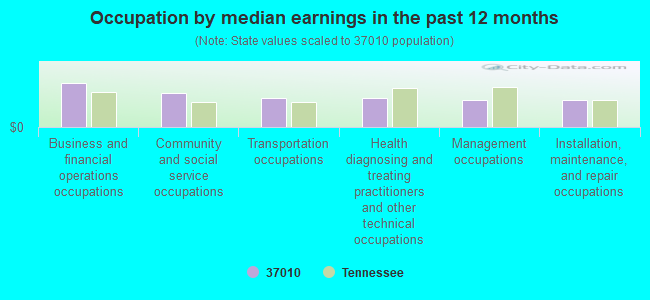
Occupation by median earnings in the past 12 months ($)
113,016Business and financial operations occupations
87,096Community and social service occupations
74,292Transportation occupations
73,793Health diagnosing and treating practitioners and other technical occupations
70,471Management occupations
70,377Installation, maintenance, and repair occupations
Top industries in this zip code by the number of employees in 2005:
Construction: Commercial and Institutional Building Construction (20-49 employees: 1 establishment)
Accommodation and Food Services: Snack and Nonalcoholic Beverage Bars (10-19: 1)
Health Care and Social Assistance: Residential Mental Retardation Facilities (10-19: 1)
Accommodation and Food Services: Full-Service Restaurants (5-9: 1, 1-4: 1)
Wholesale Trade: Grain and Field Bean Merchant Wholesalers (5-9: 1)
Construction: Painting and Wall Covering Contractors (5-9: 1)
Real Estate and Rental and Leasing: Offices of Real Estate Appraisers (5-9: 1)
Real Estate and Rental and Leasing: Lessors of Nonresidential Buildings (except Miniwarehouses) (5-9: 1)
People in group quarters in 2010:
76 people in workers' group living quarters and job corps centers
People in group quarters in 2000:
37 people in job corps and vocational training facilities
23 people in nursing homes
Fatal accident statistics in 2014:
Fatal accident count: 1
Vehicles involved in fatal accidents: 1
Fatal accidents caused by drunken drivers: 0
Fatalities: 1
Persons involved in fatal accidents: 2
Pedestrians involved in fatal accidents: 0
Fatal accident statistics in 2013:
Fatal accident count: 1
Vehicles involved in fatal accidents: 2
Fatal accidents caused by drunken drivers: 0
Fatalities: 1
Persons involved in fatal accidents: 2
Pedestrians involved in fatal accidents: 0
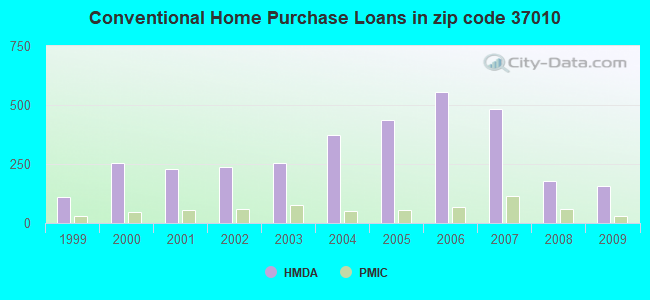
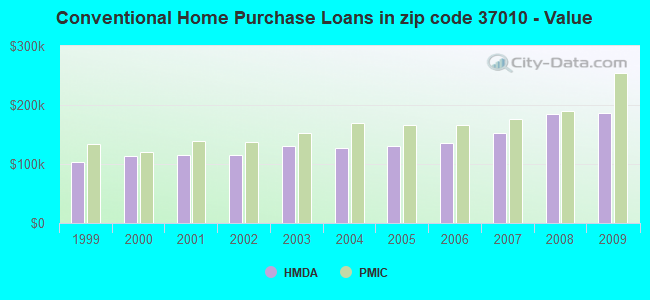
Home Mortgage Disclosure Act Aggregated Statistics For Year 2009 (Based on 6 partial tracts)
A) FHA, FSA/RHS & VA Home Purchase Loans
B) Conventional Home Purchase Loans
C) Refinancings
D) Home Improvement Loans
E) Loans on Dwellings For 5+ Families
F) Non-occupant Loans on < 5 Family Dwellings (A B C & D)
G) Loans On Manufactured Home Dwelling (A B C & D)
Number
Average Value
Number
Average Value
Number
Average Value
Number
Average Value
Number
Average Value
Number
Average Value
Number
Average Value
LOANS ORIGINATED
239
$204,490
155
$186,612
587
$190,293
25
$48,099
1
$595,410
37
$142,228
12
$48,929
APPLICATIONS APPROVED, NOT ACCEPTED
5
$137,422
7
$181,684
36
$166,421
7
$37,351
0
$0
0
$0
3
$53,363
APPLICATIONS DENIED
22
$155,201
23
$145,929
166
$176,161
22
$65,504
0
$0
11
$148,823
6
$53,372
APPLICATIONS WITHDRAWN
16
$187,582
11
$208,451
101
$188,764
6
$40,090
0
$0
6
$68,682
0
$0
FILES CLOSED FOR INCOMPLETENESS
4
$129,218
3
$233,207
36
$187,696
1
$225,300
0
$0
0
$0
0
$0
Aggregated Statistics For Year 2008 (Based on 6 partial tracts)
A) FHA, FSA/RHS & VA Home Purchase Loans
B) Conventional Home Purchase Loans
C) Refinancings
D) Home Improvement Loans
E) Loans on Dwellings For 5+ Families
F) Non-occupant Loans on < 5 Family Dwellings (A B C & D)
G) Loans On Manufactured Home Dwelling (A B C & D)
Number
Average Value
Number
Average Value
Number
Average Value
Number
Average Value
Number
Average Value
Number
Average Value
Number
Average Value
LOANS ORIGINATED
173
$196,540
180
$185,118
281
$160,376
50
$55,380
6
$510,602
43
$130,959
19
$58,086
APPLICATIONS APPROVED, NOT ACCEPTED
6
$203,140
12
$157,381
30
$183,783
9
$61,948
0
$0
3
$306,993
3
$42,737
APPLICATIONS DENIED
20
$161,165
28
$139,739
128
$153,539
58
$74,748
0
$0
12
$110,338
17
$67,165
APPLICATIONS WITHDRAWN
18
$170,858
22
$166,910
67
$149,819
8
$77,611
0
$0
7
$98,374
3
$95,800
FILES CLOSED FOR INCOMPLETENESS
2
$156,950
4
$197,445
20
$171,900
0
$0
0
$0
0
$0
0
$0
Aggregated Statistics For Year 2007 (Based on 6 partial tracts)
A) FHA, FSA/RHS & VA Home Purchase Loans
B) Conventional Home Purchase Loans
C) Refinancings
D) Home Improvement Loans
E) Loans on Dwellings For 5+ Families
F) Non-occupant Loans on < 5 Family Dwellings (A B C & D)
G) Loans On Manufactured Home Dwelling (A B C & D)
Number
Average Value
Number
Average Value
Number
Average Value
Number
Average Value
Number
Average Value
Number
Average Value
Number
Average Value
LOANS ORIGINATED
215
$196,676
483
$151,839
305
$143,483
61
$64,640
1
$898,970
58
$121,936
22
$75,801
APPLICATIONS APPROVED, NOT ACCEPTED
3
$147,357
35
$126,999
34
$141,904
15
$55,762
0
$0
4
$87,785
6
$62,017
APPLICATIONS DENIED
12
$186,194
59
$129,327
168
$138,297
56
$58,599
0
$0
11
$99,955
13
$64,526
APPLICATIONS WITHDRAWN
11
$165,415
38
$162,639
88
$154,955
6
$94,317
0
$0
5
$110,390
6
$70,383
FILES CLOSED FOR INCOMPLETENESS
2
$194,710
10
$119,940
21
$165,552
0
$0
0
$0
0
$0
0
$0
Aggregated Statistics For Year 2006 (Based on 6 partial tracts)
A) FHA, FSA/RHS & VA Home Purchase Loans
B) Conventional Home Purchase Loans
C) Refinancings
D) Home Improvement Loans
E) Loans on Dwellings For 5+ Families
F) Non-occupant Loans on < 5 Family Dwellings (A B C & D)
G) Loans On Manufactured Home Dwelling (A B C & D)
Number
Average Value
Number
Average Value
Number
Average Value
Number
Average Value
Number
Average Value
Number
Average Value
Number
Average Value
LOANS ORIGINATED
186
$184,473
557
$135,439
272
$134,972
52
$54,649
4
$480,520
64
$121,088
19
$95,127
APPLICATIONS APPROVED, NOT ACCEPTED
7
$160,970
58
$108,205
56
$133,064
11
$48,183
0
$0
10
$99,542
9
$79,384
APPLICATIONS DENIED
13
$167,058
75
$123,113
192
$133,811
44
$73,350
0
$0
12
$97,094
14
$96,493
APPLICATIONS WITHDRAWN
14
$151,979
80
$111,846
127
$148,750
9
$103,646
0
$0
12
$92,188
3
$102,763
FILES CLOSED FOR INCOMPLETENESS
0
$0
16
$135,595
31
$132,648
3
$51,043
0
$0
2
$108,125
0
$0
Aggregated Statistics For Year 2005 (Based on 6 partial tracts)
A) FHA, FSA/RHS & VA Home Purchase Loans
B) Conventional Home Purchase Loans
C) Refinancings
D) Home Improvement Loans
E) Loans on Dwellings For 5+ Families
F) Non-occupant Loans on < 5 Family Dwellings (A B C & D)
G) Loans On Manufactured Home Dwelling (A B C & D)
Number
Average Value
Number
Average Value
Number
Average Value
Number
Average Value
Number
Average Value
Number
Average Value
Number
Average Value
LOANS ORIGINATED
187
$163,761
436
$129,714
291
$134,927
48
$37,008
6
$610,858
52
$105,404
24
$74,764
APPLICATIONS APPROVED, NOT ACCEPTED
5
$166,222
36
$113,088
60
$128,911
15
$18,759
0
$0
7
$108,144
3
$47,010
APPLICATIONS DENIED
7
$135,264
57
$130,595
231
$126,098
55
$40,148
0
$0
8
$56,366
16
$54,700
APPLICATIONS WITHDRAWN
6
$108,852
28
$137,935
205
$137,522
11
$146,207
0
$0
6
$82,377
10
$84,291
FILES CLOSED FOR INCOMPLETENESS
3
$159,103
16
$122,989
24
$173,961
3
$17,917
0
$0
0
$0
1
$48,770
Aggregated Statistics For Year 2004 (Based on 6 partial tracts)
A) FHA, FSA/RHS & VA Home Purchase Loans
B) Conventional Home Purchase Loans
C) Refinancings
D) Home Improvement Loans
E) Loans on Dwellings For 5+ Families
F) Non-occupant Loans on < 5 Family Dwellings (A B C & D)
G) Loans On Manufactured Home Dwelling (A B C & D)
Number
Average Value
Number
Average Value
Number
Average Value
Number
Average Value
Number
Average Value
Number
Average Value
Number
Average Value
LOANS ORIGINATED
148
$152,811
371
$126,452
363
$121,121
47
$30,442
2
$1,238,535
38
$96,299
21
$56,984
APPLICATIONS APPROVED, NOT ACCEPTED
3
$168,600
30
$95,567
59
$117,455
7
$28,557
0
$0
4
$89,190
6
$42,943
APPLICATIONS DENIED
15
$136,947
67
$104,102
221
$110,691
32
$34,934
1
$21,400
10
$97,192
26
$60,798
APPLICATIONS WITHDRAWN
11
$162,781
31
$106,246
149
$118,289
5
$65,984
0
$0
6
$60,912
7
$79,553
FILES CLOSED FOR INCOMPLETENESS
2
$150,365
11
$107,110
20
$120,440
1
$17,420
0
$0
2
$62,775
0
$0
Aggregated Statistics For Year 2003 (Based on 6 partial tracts)
A) FHA, FSA/RHS & VA Home Purchase Loans
B) Conventional Home Purchase Loans
C) Refinancings
D) Home Improvement Loans
E) Loans on Dwellings For 5+ Families
F) Non-occupant Loans on < 5 Family Dwellings (A B C & D)
Number
Average Value
Number
Average Value
Number
Average Value
Number
Average Value
Number
Average Value
Number
Average Value
LOANS ORIGINATED
135
$136,704
254
$130,538
842
$119,937
34
$25,755
6
$275,940
41
$103,838
APPLICATIONS APPROVED, NOT ACCEPTED
0
$0
22
$132,755
85
$119,663
3
$6,000
0
$0
4
$100,545
APPLICATIONS DENIED
7
$107,244
48
$103,214
242
$117,288
23
$24,180
0
$0
19
$97,463
APPLICATIONS WITHDRAWN
8
$111,101
33
$123,502
168
$125,519
5
$34,714
0
$0
3
$115,387
FILES CLOSED FOR INCOMPLETENESS
3
$88,470
11
$133,110
21
$133,103
2
$26,755
0
$0
1
$107,020
Aggregated Statistics For Year 2002 (Based on 6 partial tracts)
A) FHA, FSA/RHS & VA Home Purchase Loans
B) Conventional Home Purchase Loans
C) Refinancings
D) Home Improvement Loans
E) Loans on Dwellings For 5+ Families
F) Non-occupant Loans on < 5 Family Dwellings (A B C & D)
Number
Average Value
Number
Average Value
Number
Average Value
Number
Average Value
Number
Average Value
Number
Average Value
LOANS ORIGINATED
123
$133,950
239
$115,179
518
$123,385
31
$19,924
4
$520,552
35
$89,173
APPLICATIONS APPROVED, NOT ACCEPTED
2
$69,955
13
$72,592
69
$100,902
7
$18,981
0
$0
2
$59,290
APPLICATIONS DENIED
5
$93,346
43
$74,697
174
$94,675
23
$7,352
0
$0
4
$65,122
APPLICATIONS WITHDRAWN
5
$128,774
16
$105,291
89
$112,680
5
$40,222
0
$0
4
$84,250
FILES CLOSED FOR INCOMPLETENESS
0
$0
4
$62,472
18
$97,998
2
$21,860
0
$0
1
$37,740
Aggregated Statistics For Year 2001 (Based on 6 partial tracts)
A) FHA, FSA/RHS & VA Home Purchase Loans
B) Conventional Home Purchase Loans
C) Refinancings
D) Home Improvement Loans
E) Loans on Dwellings For 5+ Families
F) Non-occupant Loans on < 5 Family Dwellings (A B C & D)
Number
Average Value
Number
Average Value
Number
Average Value
Number
Average Value
Number
Average Value
Number
Average Value
LOANS ORIGINATED
118
$112,893
227
$114,869
445
$117,432
37
$24,005
1
$457,060
32
$80,575
APPLICATIONS APPROVED, NOT ACCEPTED
0
$0
33
$67,811
51
$112,540
6
$29,528
0
$0
3
$119,860
APPLICATIONS DENIED
9
$97,326
60
$65,457
131
$99,096
29
$20,876
0
$0
4
$74,548
APPLICATIONS WITHDRAWN
6
$123,448
20
$87,112
97
$97,314
7
$27,769
0
$0
3
$122,620
FILES CLOSED FOR INCOMPLETENESS
0
$0
10
$78,324
23
$120,688
0
$0
0
$0
2
$89,895
Aggregated Statistics For Year 2000 (Based on 6 partial tracts)
A) FHA, FSA/RHS & VA Home Purchase Loans
B) Conventional Home Purchase Loans
C) Refinancings
D) Home Improvement Loans
F) Non-occupant Loans on < 5 Family Dwellings (A B C & D)
Number
Average Value
Number
Average Value
Number
Average Value
Number
Average Value
Number
Average Value
LOANS ORIGINATED
95
$106,647
255
$113,256
121
$97,578
40
$21,210
20
$76,062
APPLICATIONS APPROVED, NOT ACCEPTED
5
$45,422
29
$79,099
42
$89,198
9
$16,567
1
$46,840
APPLICATIONS DENIED
13
$75,686
84
$69,070
124
$75,703
22
$39,010
4
$25,290
APPLICATIONS WITHDRAWN
9
$119,328
23
$104,154
81
$74,668
6
$17,850
2
$74,915
FILES CLOSED FOR INCOMPLETENESS
0
$0
8
$99,541
16
$88,694
0
$0
0
$0
Aggregated Statistics For Year 1999 (Based on 3 partial tracts)
A) FHA, FSA/RHS & VA Home Purchase Loans
B) Conventional Home Purchase Loans
C) Refinancings
D) Home Improvement Loans
F) Non-occupant Loans on < 5 Family Dwellings (A B C & D)
2002 - 2018 National Fire Incident Reporting System (NFIRS) incidents
According to the data from the years 2002 - 2018 the average number of fire incidents per year is 16. The highest number of reported fire incidents - 28 took place in 2007, and the least - 11 in 2004. The data has a rising trend.
When looking into fire subcategories, the most incidents belonged to: Outside Fires (56.0%), and Structure Fires (18.4%).
Fire incident types reported to NFIRS in Zip Code 37010

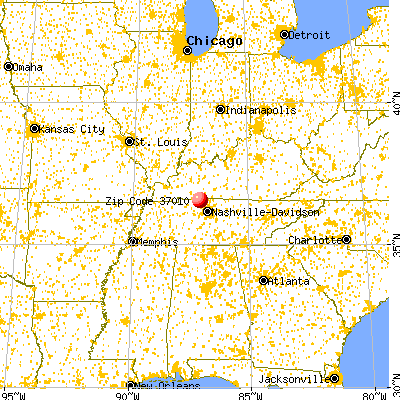


 Nearest zip codes: 37032, 42204, 37043, 42234, 37146, 42265.


 According to the data from the years 2002 - 2018 the average number of fire incidents per year is 16. The highest number of reported fire incidents - 28 took place in 2007, and the least - 11 in 2004. The data has a rising trend.
 When looking into fire subcategories, the most incidents belonged to: Outside Fires (56.0%), and Structure Fires (18.4%).