Estimated zip code population in 2022: 4,947 Zip code population in 2010: 4,202 Zip code population in 2000: 3,416
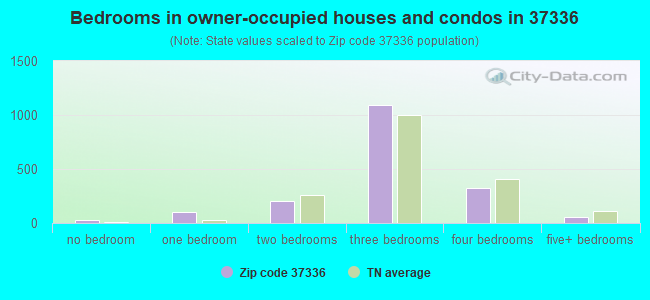
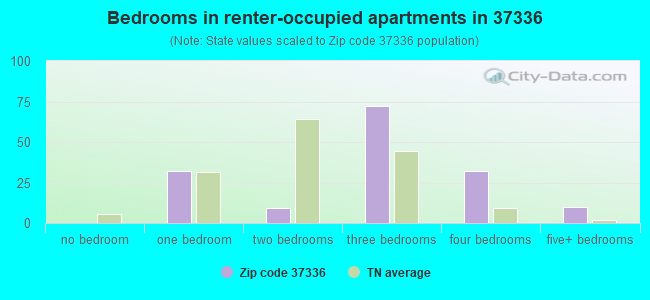
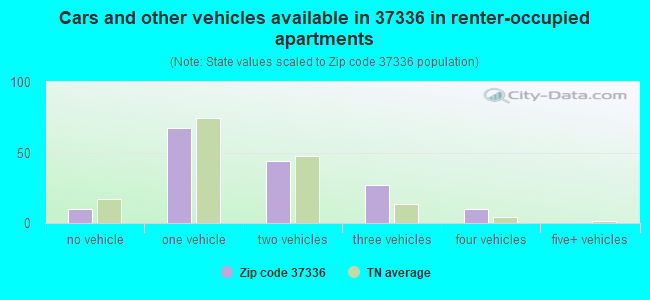
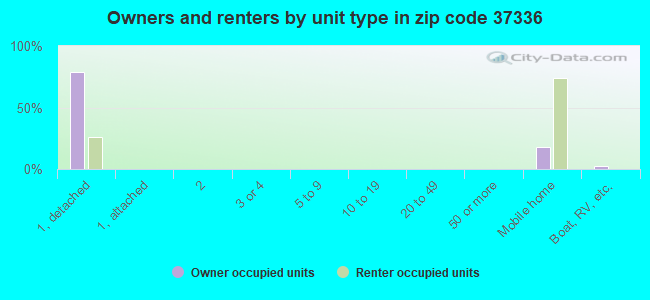
Houses and condos: 2,127 Renter-occupied apartments: 156
% of renters here:
8%
State:
33%
March 2022 cost of living index in zip code 37336: 80.3 (low, U.S. average is 100)
Land area: 43.4 sq. mi. Water area: 2.7 sq. mi.
Population density: 114 people per square mile
(very low).
OSM Map
General Map
Google Map
MSN Map
OSM Map
General Map
Google Map
MSN Map
OSM Map
General Map
Google Map
MSN Map
OSM Map
General Map
Google Map
MSN Map
Please wait while loading the map...
Real estate property taxes paid for housing units in 2022:
This zip code:
0.4% ($932)
Tennessee:
0.5% ($1,376)
Median real estate property taxes paid for housing units with mortgages in 2022: $954 (0.3%) Median real estate property taxes paid for housing units with no mortgage in 2022: $915 (0.6%)
Business Search- 14 Million verified businesses
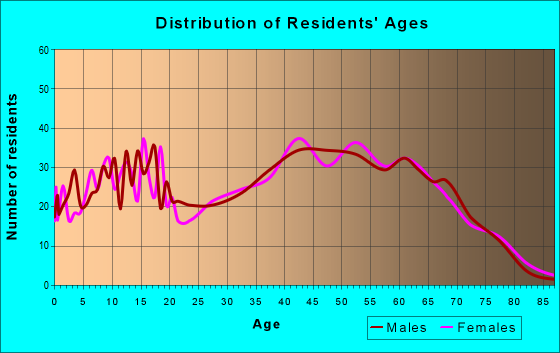
Males: 2,379
(48.1%)
Females: 2,568
(51.9%)
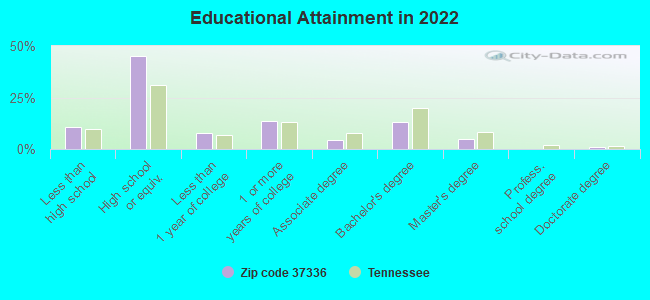
For population 25 years and over in 37336:
High school or higher: 88.3%
Bachelor's degree or higher: 18.4%
Graduate or professional degree: 5.6%
Unemployed: 5.2%
Mean travel time to work (commute): 27.5 minutes
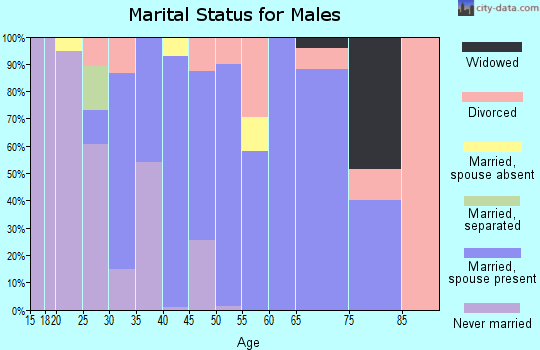
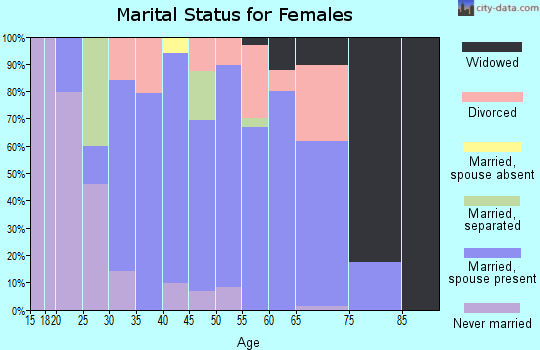
For population 15 years and over in 37336:
Never married: 15.1%
Now married: 67.5%
Separated: 1.1%
Widowed: 6.4%
Divorced: 9.9%
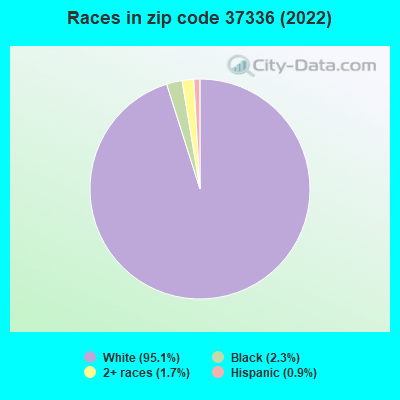
Zip code 37336 compared to state average:
Black race population percentage significantly below state average.
Hispanic race population percentage significantly below state average.
Median age significantly above state average.
Foreign-born population percentage significantly below state average.
Renting percentage significantly below state average.
Length of stay since moving in above state average.
House age below state average.
Percentage of population with a bachelor's degree or higher below state average.
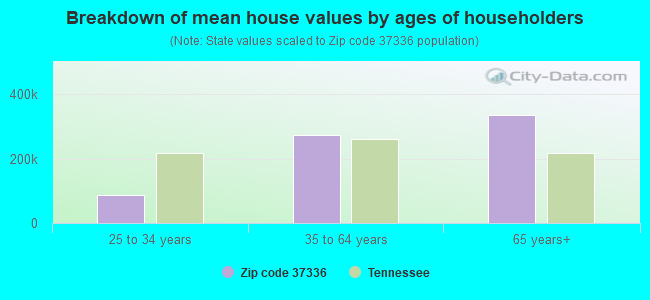
Estimated median house/condo value in 2022: $234,981
37336:
$234,981
Tennessee:
$284,800
According to our research of Tennessee and other state lists, there were 11 registered sex offenders living in 37336 zip code as of April 25, 2024. The ratio of all residents to sex offenders in zip code 37336 is 414 to 1. The ratio of registered sex offenders to all residents in this zip code is near the state average.
Median resident age:
This zip code:
47.5 years
Tennessee median age:
39.2 years
Average household size:
This zip code:
2.5 people
Tennessee:
2.4 people
Averages for the 2020 tax year for zip code 37336, filed in 2021:
Average Adjusted Gross Income (AGI) in 2020: $64,656 (Individual Income Tax Returns)
Here:
$64,656
State:
$69,014
Salary/wage: $55,838 (reported on 79.8% of returns)
Here:
$55,838
State:
$55,872
(% of AGI for various income ranges: 1113.7% for AGIs below $25k, 3465.7% for AGIs $25k-50k, 6044.0% for AGIs $50k-75k, 7672.9% for AGIs $75k-100k, 16436.0% for AGIs $100k-200k)
Taxable interest for individuals: $1,383 (reported on 28.2% of returns)
This zip code:
$1,383
Tennessee:
$1,945
(% of AGI for various income ranges: 11.5% for AGIs below $25k, 13.6% for AGIs $25k-50k, 20.8% for AGIs $50k-75k, 60.0% for AGIs $75k-100k, 87.5% for AGIs $100k-200k)
Ordinary dividends: $3,912 (reported on 11.7% of returns)
Here:
$3,912
State:
$8,105
(% of AGI for various income ranges: 10.4% for AGIs below $25k, 6.4% for AGIs $25k-50k, 17.2% for AGIs $50k-75k, 65.9% for AGIs $75k-100k, 92.0% for AGIs $100k-200k)
Net capital gain/loss in AGI: +$29,977 (reported on 12.2% of returns)
Here:
+$29,977
State:
+$33,664
(% of AGI for various income ranges: 16.3% for AGIs below $25k, 19.8% for AGIs $25k-50k, 52.0% for AGIs $50k-75k, 130.0% for AGIs $75k-100k, 885.5% for AGIs $100k-200k)
Profit/loss from business: +$16,577 (reported on 16.4% of returns)
Here:
+$16,577
State:
+$18,991
(% of AGI for various income ranges: 146.0% for AGIs below $25k, 94.3% for AGIs $25k-50k, 292.8% for AGIs $50k-75k, 430.0% for AGIs $75k-100k, 867.5% for AGIs $100k-200k)
Taxable individual retirement arrangement distribution: $17,873 (reported on 10.3% of returns)
37336:
$17,873
Tennessee:
$20,036
(% of AGI for various income ranges: 58.8% for AGIs below $25k, 147.6% for AGIs $25k-50k, 306.8% for AGIs $50k-75k, 595.3% for AGIs $75k-100k, 613.5% for AGIs $100k-200k)
Total itemized deductions: $32,630 (reported on 4.7% of returns)
Here:
$32,630
State:
$40,136
(% of AGI for various income ranges: 421.6% for AGIs $50k-75k, 673.0% for AGIs $100k-200k)
Charity contributions: $18,586 (reported on 3.3% of returns)
Here:
$18,586
State:
$19,852
(% of AGI for various income ranges: 27.9% for AGIs below $25k, 305.0% for AGIs $100k-200k)
Taxes paid: $4,770 (reported on 4.7% of returns)
37336:
$4,770
State:
$6,038
(% of AGI for various income ranges: 45.6% for AGIs $50k-75k, 100.5% for AGIs $100k-200k)
Earned income credit: $2,161 (reported on 15.5% of returns)
Here:
$2,161
State:
$2,391
(% of AGI for various income ranges: 79.8% for AGIs below $25k, 71.0% for AGIs $25k-50k)
Percentage of individuals using paid preparers for their 2020 taxes: 93.9%
Here:
94%
State:
93%
(% for various income ranges: 94.2% for AGIs below $25k, 94.0% for AGIs $25k-50k, 93.9% for AGIs $50k-75k, 95.5% for AGIs $75k-100k, 93.8% for AGIs $100k-200k, 85.7% for AGIs over 200k)
Averages for the 2012 tax year for zip code 37336, filed in 2013:
Average Adjusted Gross Income (AGI) in 2012: $51,515 (Individual Income Tax Returns)
Here:
$51,515
State:
$53,767
Salary/wage: $44,210 (reported on 85.7% of returns)
Here:
$44,210
State:
$45,421
(% of AGI for various income ranges: 73.4% for AGIs below $25k, 79.6% for AGIs $25k-50k, 81.3% for AGIs $50k-75k, 81.1% for AGIs $75k-100k, 78.6% for AGIs $100k-200k, 44.6% for AGIs over 200k)
Taxable interest for individuals: $1,407 (reported on 23.1% of returns)
This zip code:
$1,407
Tennessee:
$1,732
(% of AGI for various income ranges: 0.7% for AGIs below $25k, 0.7% for AGIs $25k-50k, 0.5% for AGIs $50k-75k, 0.7% for AGIs $75k-100k, 0.4% for AGIs $100k-200k, 1.0% for AGIs over 200k)
Ordinary dividends: $2,338 (reported on 11.5% of returns)
Here:
$2,338
State:
$6,739
(% of AGI for various income ranges: 0.9% for AGIs below $25k, 0.2% for AGIs $25k-50k, 0.1% for AGIs $50k-75k, 0.2% for AGIs $75k-100k, 0.4% for AGIs $100k-200k, 1.7% for AGIs over 200k)
Net capital gain/loss in AGI: +$3,081 (reported on 8.8% of returns)
Here:
+$3,081
State:
+$19,082
(% of AGI for various income ranges: 0.4% for AGIs $25k-50k, 0.4% for AGIs $75k-100k, 1.9% for AGIs $100k-200k)
Profit/loss from business: +$10,223 (reported on 16.5% of returns)
Here:
+$10,223
State:
+$15,240
(% of AGI for various income ranges: 11.4% for AGIs below $25k, 3.1% for AGIs $25k-50k, 3.1% for AGIs $50k-75k, 2.6% for AGIs $75k-100k, 3.2% for AGIs $100k-200k)
Taxable individual retirement arrangement distribution: $15,800 (reported on 8.8% of returns)
37336:
$15,800
Tennessee:
$15,505
(% of AGI for various income ranges: 2.8% for AGIs below $25k, 2.3% for AGIs $25k-50k, 2.7% for AGIs $50k-75k, 2.8% for AGIs $75k-100k, 5.0% for AGIs $100k-200k)
Total itemized deductions: $20,421 (20% of AGI, reported on 23.1% of returns)
Here:
$20,421
State:
$21,976
Here:
19.6% of AGI
State:
17.8% of AGI
(% of AGI for various income ranges: 4.5% for AGIs below $25k, 7.7% for AGIs $25k-50k, 10.2% for AGIs $50k-75k, 9.1% for AGIs $75k-100k, 10.5% for AGIs $100k-200k, 10.4% for AGIs over 200k)
Charity contributions: $6,297 (reported on 17.6% of returns)
Here:
$6,297
State:
$6,709
(% of AGI for various income ranges: 0.4% for AGIs below $25k, 1.3% for AGIs $25k-50k, 1.8% for AGIs $50k-75k, 2.2% for AGIs $75k-100k, 3.1% for AGIs $100k-200k, 3.1% for AGIs over 200k)
Taxes paid: $3,925 (reported on 22.0% of returns)
37336:
$3,925
State:
$4,829
(% of AGI for various income ranges: 0.5% for AGIs below $25k, 1.4% for AGIs $25k-50k, 1.7% for AGIs $50k-75k, 1.7% for AGIs $75k-100k, 2.2% for AGIs $100k-200k, 1.9% for AGIs over 200k)
Earned income credit: $2,266 (reported on 20.9% of returns)
Here:
$2,266
State:
$2,404
(% of AGI for various income ranges: 7.5% for AGIs below $25k, 1.2% for AGIs $25k-50k)
Percentage of individuals using paid preparers for their 2012 taxes: 57.7%
Here:
58%
State:
52%
(% for various income ranges: 55.6% for AGIs below $25k, 55.6% for AGIs $25k-50k, 57.1% for AGIs $50k-75k, 61.1% for AGIs $75k-100k, 62.5% for AGIs $100k-200k, 100.0% for AGIs over 200k)
Averages for the 2004 tax year for zip code 37336, filed in 2005:
Average Adjusted Gross Income (AGI) in 2004: $41,884 (Individual Income Tax Returns)
Here:
$41,884
State:
$44,088
Salary/wage: $36,047 (reported on 86.3% of returns)
Here:
$36,047
State:
$38,825
(% of AGI for various income ranges: 97.0% for AGIs below $10k, 74.1% for AGIs $10k-25k, 83.6% for AGIs $25k-50k, 86.5% for AGIs $50k-75k, 86.8% for AGIs $75k-100k, 45.0% for AGIs over 100k)
Taxable interest for individuals: $1,062 (reported on 35.8% of returns)
This zip code:
$1,062
Tennessee:
$1,802
(% of AGI for various income ranges: 1.4% for AGIs below $10k, 1.5% for AGIs $10k-25k, 0.7% for AGIs $25k-50k, 0.5% for AGIs $50k-75k, 0.5% for AGIs $75k-100k, 1.5% for AGIs over 100k)
Taxable dividends: $929 (reported on 13.1% of returns)
Here:
$929
State:
$3,727
(% of AGI for various income ranges: 1.0% for AGIs below $10k, 0.6% for AGIs $10k-25k, 0.2% for AGIs $25k-50k, 0.3% for AGIs $50k-75k, 0.1% for AGIs $75k-100k, 0.4% for AGIs over 100k)
Net capital gain/loss: +$6,071 (reported on 11.6% of returns)
Here:
+$6,071
State:
+$15,776
(% of AGI for various income ranges: 0.7% for AGIs below $10k, 1.1% for AGIs $10k-25k, 0.6% for AGIs $25k-50k, 0.5% for AGIs $50k-75k, 0.2% for AGIs $75k-100k, 4.9% for AGIs over 100k)
Profit/loss from business: +$9,741 (reported on 20.1% of returns)
Here:
+$9,741
State:
+$12,882
(% of AGI for various income ranges: 25.4% for AGIs below $10k, 9.8% for AGIs $10k-25k, 4.7% for AGIs $25k-50k, 1.4% for AGIs $50k-75k, 2.8% for AGIs $75k-100k, 5.3% for AGIs over 100k)
IRA payment deduction: $3,118 (reported on 3.0% of returns)
37336:
$3,118
Tennessee:
$2,934
(% of AGI for various income ranges: 0.3% for AGIs $10k-25k, 0.4% for AGIs $25k-50k, 0.2% for AGIs $50k-75k, 0.4% for AGIs $75k-100k)
Total itemized deductions: $17,034 (20% of AGI, reported on 22.0% of returns)
Here:
$17,034
State:
$18,035
Here:
20.4% of AGI
State:
19.9% of AGI
(% of AGI for various income ranges: 7.7% for AGIs $10k-25k, 8.4% for AGIs $25k-50k, 8.0% for AGIs $50k-75k, 11.8% for AGIs $75k-100k, 9.8% for AGIs over 100k)
Charity contributions deductions: $5,891 (6% of AGI, reported on 17.7% of returns)
Here:
$5,891
State:
$5,167
Here:
6.5% of AGI
State:
5.3% of AGI
(% of AGI for various income ranges: 0.8% for AGIs $10k-25k, 1.5% for AGIs $25k-50k, 1.4% for AGIs $50k-75k, 3.0% for AGIs $75k-100k, 5.0% for AGIs over 100k)
Total tax: $6,120 (reported on 75.3% of returns)
37336:
$6,120
State:
$7,482
(% of AGI for various income ranges: 4.6% for AGIs below $10k, 4.2% for AGIs $10k-25k, 6.0% for AGIs $25k-50k, 8.4% for AGIs $50k-75k, 10.8% for AGIs $75k-100k, 21.5% for AGIs over 100k)
Earned income credit: $1,755 (reported on 20.5% of returns)
Here:
$1,755
State:
$1,826
Percentage of individuals using paid preparers for their 2004 taxes: 65.5%
Here:
65%
State:
60%
(% for various income ranges: 61.8% for AGIs below $10k, 68.9% for AGIs $10k-25k, 65.4% for AGIs $25k-50k, 64.8% for AGIs $50k-75k, 58.1% for AGIs $75k-100k, 76.6% for AGIs over 100k)
Household received Food Stamps/SNAP in the past 12 months: 262 Household did not receive Food Stamps/SNAP in the past 12 months: 1,702
Women who did not have a birth in the past 12 months: 1,067 (709 now married, 358 unmarried)
Housing units in zip code 37336 with a mortgage: 924 (97 second mortgage, 56 both second mortgage and home equity loan) Median monthly owner costs for units with a mortgage: $1,351 Median monthly owner costs for units without a mortgage: $329
Residents with income below the poverty level in 2022:
This zip code:
9.5%
Whole state:
13.3%
Residents with income below 50% of the poverty level in 2022:
This zip code:
4.9%
Whole state:
7.1%
Median number of rooms in houses and condos:
Here:
6.2
State:
6.5
Median number of rooms in apartments:
Here:
4.2
State:
4.4
Notable locations in this zip code not listed on our city pages
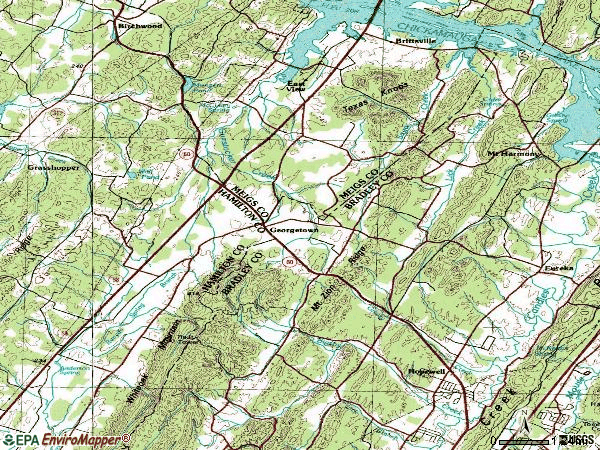
Notable locations in zip code 37336: Green Acres Equestrian Farm (A), Grays Ferry (B), Meigs County Emergency Services Fire Rescue Station 1 (C). Display/hide their locations on the map
Churches in zip code 37336 include: East View Baptist Church (A), Standfield Church (B), Saint Elmo Church (C), Gum Springs Baptist Church (D), New Union Church (E), Georgetown Baptist Church (F), Meadowview Mission (G), Eastview Baptist Church (H), Brittsville Baptist Church (I). Display/hide their locations on the map
Cemeteries: Johnson Cemetery (1), Lewis Cemetery (2), Anderson Cemetery (3), Bettis Cemetery (4), Griffith Cemetery (5), Matthews Cemetery (6), McKinney Cemetery (7). Display/hide their locations on the map
Streams, rivers, and creeks: Lick Creek (A), Lewis Branch (B), Gunstocker Creek (C), Sugar Creek (D), Copper Branch (E), Runyan Spring Branch (F), Bedwell Branch (G), Anderson Spring Branch (H), Allford Branch (I). Display/hide their locations on the map
In group quarters: 22 (-1 institutionalized population)
Size of family households: 690 2-persons, 315 3-persons, 279 4-persons, 105 5-persons, 95 6-persons
Size of nonfamily households: 423 1-person, 49 2-persons
523 married couples with children.
89 single-parent households (75 men, 14 women).
98.4% of residents of 37336 zip code speak English at home.
1.3% of residents speak other Indo-European language at home (100% very well).
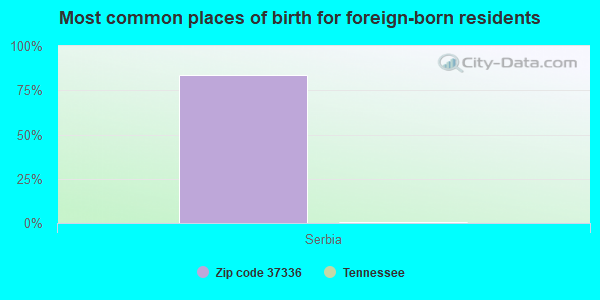
Foreign born population: 113 (2.3%) (66.6% of them are naturalized citizens)
This zip code:
2.3%
Whole state:
5.6%
25%Serbia
13%El Salvador
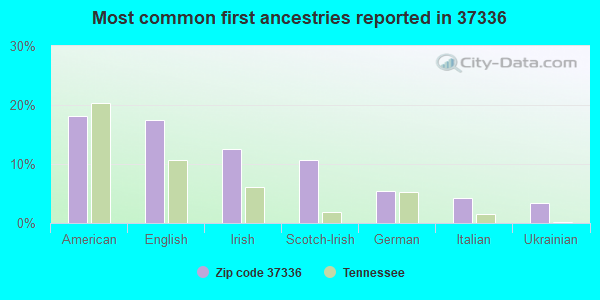
18%American
17%English
12%Irish
11%Scotch-Irish
5%German
4%Italian
3%Ukrainian
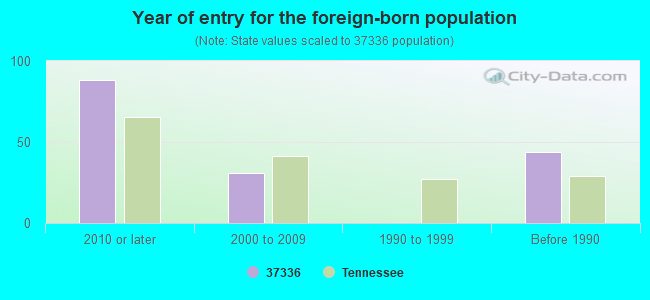
Year of entry for the foreign-born population
882010 or later
312000 to 2009
01990 to 1999
44Before 1990
Facilities with environmental interests located in this zip code:
CALDWELL & CALDWELL PAVING CO. (RT. 1 in GEORGETOWN, TN)
AIR MINOR (AIRS/AFS) Business SIC classification: ASPHALT PAVING MIXTURES AND BLOCKS
Housing units lacking complete plumbing facilities: 3.9% Housing units lacking complete kitchen facilities: 0.3%
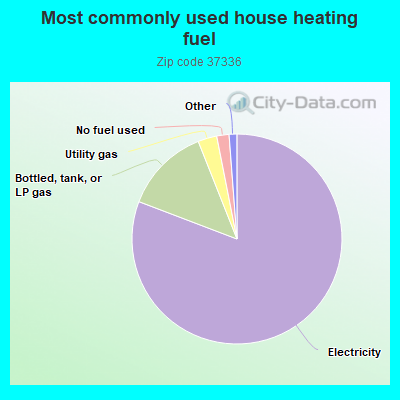
80.8%Electricity
13.2%Bottled, tank, or LP gas
2.9%Utility gas
1.9%No fuel used
0.7%Other fuel
0.5%Wood
Population in 1990: 3,768.
Place of birth for U.S.-born residents:
This state: 3,316
Northeast: 127
Midwest: 334
South: 854
West: 124
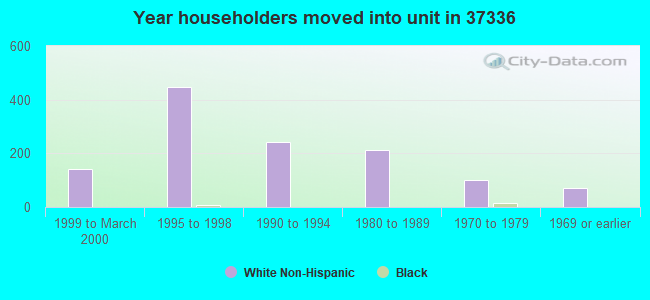
61% of the 37336 zip code residents lived in the same house 5 years ago. Out of people who lived in different houses, 40% lived in this county. Out of people who lived in different counties, 50% lived in Tennessee.
88% of the 37336 zip code residents lived in the same house 1 year ago. Out of people who lived in different houses, 15% moved from this county. Out of people who lived in different houses, 69% moved from different county within same state. Out of people who lived in different houses, 20% moved from different state.
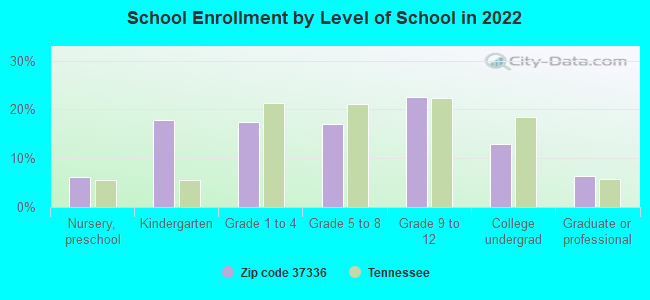
Private vs. public school enrollment:
Students in private schools in grades 1 to 8 (elementary and middle school): 9
Here:
2.8%
Tennessee:
15.0%
Students in private schools in grades 9 to 12 (high school): 5
Here:
2.8%
Tennessee:
16.2%
Students in private undergraduate colleges: 41
Here:
32.8%
Tennessee:
23.5%
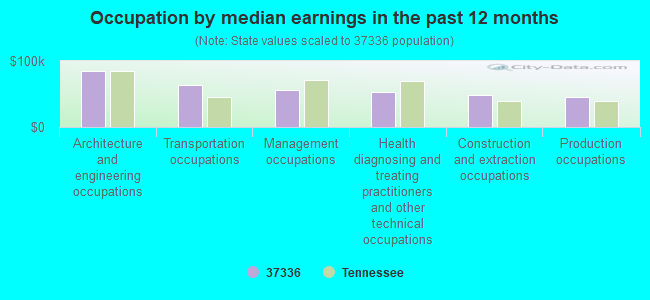
Occupation by median earnings in the past 12 months ($)
85,265Architecture and engineering occupations
63,257Transportation occupations
55,538Management occupations
52,873Health diagnosing and treating practitioners and other technical occupations
48,414Construction and extraction occupations
45,221Production occupations
Top industries in this zip code by the number of employees in 2005:
Health Care and Social Assistance: Homes for the Elderly (5-9: 1)
Other Services (except Public Administration): Commercial and Industrial Machinery and Equipment (except Automotive and Electronic) Repair and Maintenance (5-9: 1)
Construction: Commercial and Institutional Building Construction (5-9: 1)
People in group quarters in 2010:
16 people in group homes intended for adults
Fatal accident statistics in 2014:
Fatal accident count: 2
Vehicles involved in fatal accidents: 4
Fatal accidents caused by drunken drivers: 0
Fatalities: 2
Persons involved in fatal accidents: 7
Pedestrians involved in fatal accidents: 0
Fatal accident statistics in 2012:
Fatal accident count: 2
Vehicles involved in fatal accidents: 3
Fatal accidents caused by drunken drivers: 1
Fatalities: 3
Persons involved in fatal accidents: 8
Pedestrians involved in fatal accidents: 0
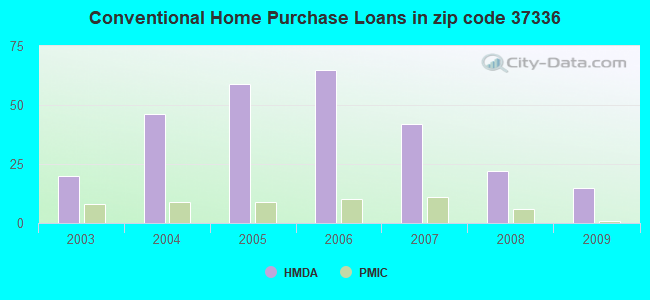
Home Mortgage Disclosure Act Aggregated Statistics For Year 2009 (Based on 4 partial tracts)
A) FHA, FSA/RHS & VA Home Purchase Loans
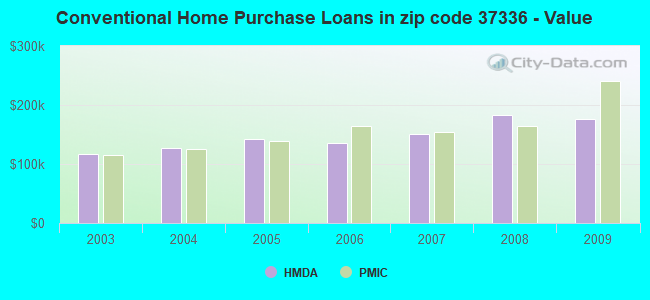
B) Conventional Home Purchase Loans
C) Refinancings
D) Home Improvement Loans
F) Non-occupant Loans on < 5 Family Dwellings (A B C & D)
G) Loans On Manufactured Home Dwelling (A B C & D)
Number
Average Value
Number
Average Value
Number
Average Value
Number
Average Value
Number
Average Value
Number
Average Value
LOANS ORIGINATED
18
$139,061
15
$175,631
93
$163,669
6
$50,247
8
$146,052
5
$71,510
APPLICATIONS APPROVED, NOT ACCEPTED
0
$0
2
$143,890
8
$140,114
2
$65,380
1
$75,530
2
$56,090
APPLICATIONS DENIED
4
$111,960
5
$148,008
31
$153,641
3
$56,047
1
$95,700
4
$79,030
APPLICATIONS WITHDRAWN
3
$140,990
2
$144,220
19
$148,733
0
$0
0
$0
2
$109,935
FILES CLOSED FOR INCOMPLETENESS
2
$123,200
0
$0
6
$171,878
0
$0
0
$0
0
$0
Aggregated Statistics For Year 2008 (Based on 4 partial tracts)
A) FHA, FSA/RHS & VA Home Purchase Loans
B) Conventional Home Purchase Loans
C) Refinancings
D) Home Improvement Loans
F) Non-occupant Loans on < 5 Family Dwellings (A B C & D)
G) Loans On Manufactured Home Dwelling (A B C & D)
Number
Average Value
Number
Average Value
Number
Average Value
Number
Average Value
Number
Average Value
Number
Average Value
LOANS ORIGINATED
13
$128,348
22
$182,874
65
$163,300
8
$39,322
10
$124,352
8
$68,705
APPLICATIONS APPROVED, NOT ACCEPTED
1
$91,870
2
$206,150
7
$124,837
2
$12,910
1
$66,340
1
$25,210
APPLICATIONS DENIED
2
$132,480
4
$188,708
47
$133,053
5
$58,108
2
$64,825
8
$76,519
APPLICATIONS WITHDRAWN
0
$0
2
$104,645
15
$146,977
1
$97,790
1
$94,260
3
$71,473
FILES CLOSED FOR INCOMPLETENESS
0
$0
1
$207,710
6
$154,942
0
$0
0
$0
0
$0
Aggregated Statistics For Year 2007 (Based on 4 partial tracts)
A) FHA, FSA/RHS & VA Home Purchase Loans
B) Conventional Home Purchase Loans
C) Refinancings
D) Home Improvement Loans
F) Non-occupant Loans on < 5 Family Dwellings (A B C & D)
G) Loans On Manufactured Home Dwelling (A B C & D)
Number
Average Value
Number
Average Value
Number
Average Value
Number
Average Value
Number
Average Value
Number
Average Value
LOANS ORIGINATED
9
$120,897
42
$151,240
67
$138,773
13
$72,593
11
$158,112
12
$66,398
APPLICATIONS APPROVED, NOT ACCEPTED
1
$38,690
7
$186,401
8
$128,441
2
$36,285
1
$258,220
2
$75,860
APPLICATIONS DENIED
1
$80,980
10
$127,691
49
$139,061
11
$58,763
5
$113,070
7
$89,289
APPLICATIONS WITHDRAWN
0
$0
4
$140,240
18
$146,364
1
$98,310
2
$62,120
1
$33,780
FILES CLOSED FOR INCOMPLETENESS
0
$0
2
$193,950
8
$149,545
0
$0
0
$0
0
$0
Aggregated Statistics For Year 2006 (Based on 4 partial tracts)
A) FHA, FSA/RHS & VA Home Purchase Loans
B) Conventional Home Purchase Loans
C) Refinancings
D) Home Improvement Loans
F) Non-occupant Loans on < 5 Family Dwellings (A B C & D)
G) Loans On Manufactured Home Dwelling (A B C & D)
Number
Average Value
Number
Average Value
Number
Average Value
Number
Average Value
Number
Average Value
Number
Average Value
LOANS ORIGINATED
6
$132,398
65
$135,387
72
$115,578
5
$43,964
16
$115,714
10
$70,478
APPLICATIONS APPROVED, NOT ACCEPTED
0
$0
10
$109,324
15
$116,420
1
$51,640
3
$62,557
3
$63,830
APPLICATIONS DENIED
1
$43,760
18
$100,573
60
$97,178
13
$48,998
8
$78,232
17
$58,830
APPLICATIONS WITHDRAWN
1
$78,350
6
$107,307
34
$119,284
0
$0
1
$133,190
1
$26,080
FILES CLOSED FOR INCOMPLETENESS
0
$0
2
$103,050
7
$161,489
0
$0
1
$87,310
0
$0
Aggregated Statistics For Year 2005 (Based on 4 partial tracts)
A) FHA, FSA/RHS & VA Home Purchase Loans
B) Conventional Home Purchase Loans
C) Refinancings
D) Home Improvement Loans
F) Non-occupant Loans on < 5 Family Dwellings (A B C & D)
G) Loans On Manufactured Home Dwelling (A B C & D)
Number
Average Value
Number
Average Value
Number
Average Value
Number
Average Value
Number
Average Value
Number
Average Value
LOANS ORIGINATED
6
$120,868
59
$142,295
92
$128,724
11
$50,974
14
$98,082
11
$64,726
APPLICATIONS APPROVED, NOT ACCEPTED
0
$0
12
$103,370
19
$108,116
2
$17,560
1
$113,370
6
$55,625
APPLICATIONS DENIED
2
$115,210
21
$116,596
79
$109,744
11
$35,271
5
$82,856
15
$64,421
APPLICATIONS WITHDRAWN
0
$0
10
$128,191
47
$149,352
3
$120,163
2
$202,180
3
$64,733
FILES CLOSED FOR INCOMPLETENESS
0
$0
1
$107,870
8
$129,775
0
$0
0
$0
1
$59,050
Aggregated Statistics For Year 2004 (Based on 4 partial tracts)
A) FHA, FSA/RHS & VA Home Purchase Loans
B) Conventional Home Purchase Loans
C) Refinancings
D) Home Improvement Loans
E) Loans on Dwellings For 5+ Families
F) Non-occupant Loans on < 5 Family Dwellings (A B C & D)
G) Loans On Manufactured Home Dwelling (A B C & D)
Number
Average Value
Number
Average Value
Number
Average Value
Number
Average Value
Number
Average Value
Number
Average Value
Number
Average Value
LOANS ORIGINATED
8
$101,622
46
$126,387
99
$104,324
11
$28,708
1
$241,830
11
$85,087
14
$49,844
APPLICATIONS APPROVED, NOT ACCEPTED
1
$42,460
9
$94,087
17
$108,469
2
$46,695
0
$0
0
$0
8
$53,170
APPLICATIONS DENIED
1
$75,810
14
$91,504
62
$103,121
8
$64,335
0
$0
2
$50,485
19
$64,473
APPLICATIONS WITHDRAWN
1
$122,300
4
$101,302
42
$114,532
1
$54,580
0
$0
0
$0
4
$77,925
FILES CLOSED FOR INCOMPLETENESS
0
$0
2
$84,125
3
$126,913
0
$0
0
$0
0
$0
1
$77,590
Aggregated Statistics For Year 2003 (Based on 2 partial tracts)
A) FHA, FSA/RHS & VA Home Purchase Loans
B) Conventional Home Purchase Loans
C) Refinancings
D) Home Improvement Loans
F) Non-occupant Loans on < 5 Family Dwellings (A B C & D)
Detailed PMIC statistics for the following Tracts:0101.02
, 0113.00
2002 - 2018 National Fire Incident Reporting System (NFIRS) incidents
Based on the data from the years 2002 - 2018 the average number of fires per year is 15. The highest number of fire incidents - 34 took place in 2006, and the least - 3 in 2012. The data has an increasing trend.
When looking into fire subcategories, the most reports belonged to: Outside Fires (44.5%), and Structure Fires (36.4%).
Fire incident types reported to NFIRS in Zip Code 37336
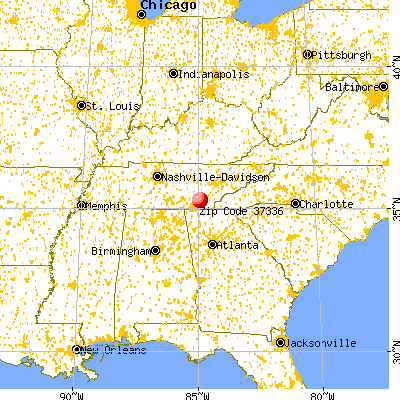


 Nearest zip codes: 37308, 37312, 37341, 37373, 37309, 37311.
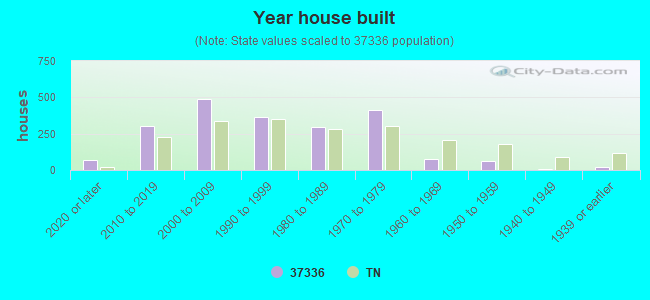


 Based on the data from the years 2002 - 2018 the average number of fires per year is 15. The highest number of fire incidents - 34 took place in 2006, and the least - 3 in 2012. The data has an increasing trend.
 When looking into fire subcategories, the most reports belonged to: Outside Fires (44.5%), and Structure Fires (36.4%).