Estimated zip code population in 2022: 3,558 Zip code population in 2010: 2,851 Zip code population in 2000: 2,719
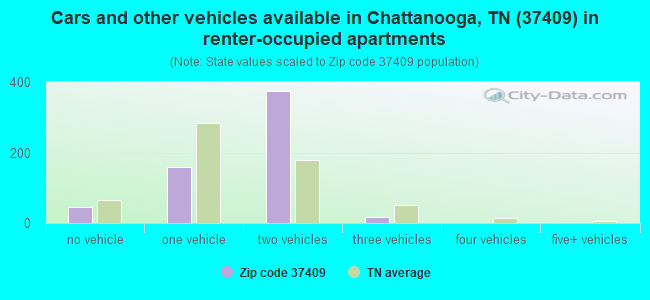
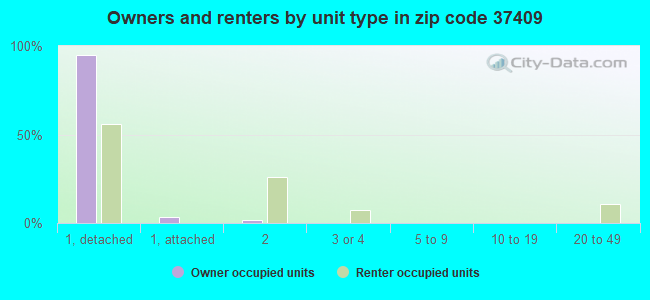
Houses and condos: 1,830 Renter-occupied apartments: 606
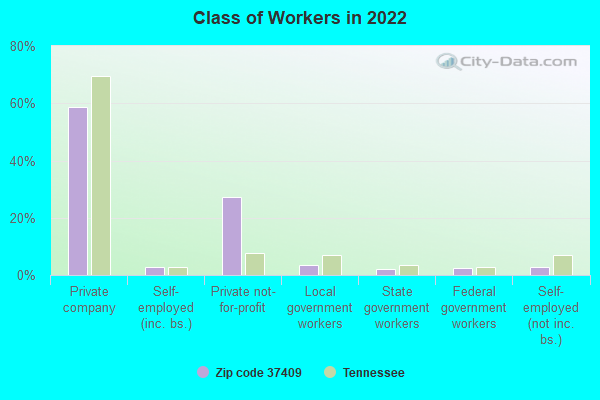
% of renters here:
37%
State:
33%
March 2022 cost of living index in zip code 37409: 89.0 (less than average, U.S. average is 100)
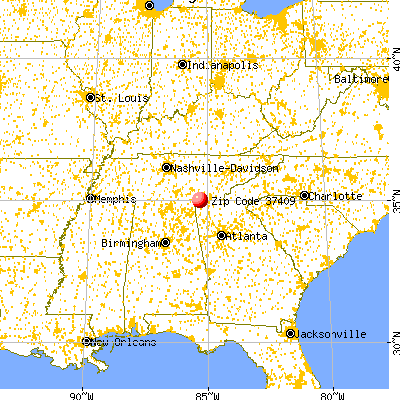
Land area: 4.4 sq. mi. Water area: 0.0 sq. mi.
Population density: 813 people per square mile
(low).
OSM Map
General Map
Google Map
MSN Map
OSM Map
General Map
Google Map
MSN Map
OSM Map
General Map
Google Map
MSN Map
OSM Map
General Map
Google Map
MSN Map
Please wait while loading the map...
Real estate property taxes paid for housing units in 2022:
This zip code:
0.5% ($1,368)
Tennessee:
0.5% ($1,376)
Median real estate property taxes paid for housing units with mortgages in 2022: $1,215 (0.4%) Median real estate property taxes paid for housing units with no mortgage in 2022: $1,871 (0.7%)
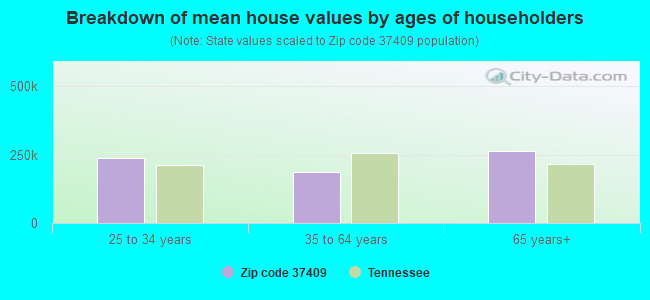
Estimated median house/condo value in 2022: $276,456
37409:
$276,456
Tennessee:
$284,800
According to our research of Tennessee and other state lists, there was 1 registered sex offender living in 37409 zip code as of April 18, 2024. The ratio of all residents to sex offenders in zip code 37409 is 2,768 to 1. The ratio of registered sex offenders to all residents in this zip code is much lower than the state average.
Median resident age:
This zip code:
36.4 years
Tennessee median age:
39.2 years
Average household size:
This zip code:
2.2 people
Tennessee:
2.4 people
Averages for the 2020 tax year for zip code 37409, filed in 2021:
Average Adjusted Gross Income (AGI) in 2020: $65,949 (Individual Income Tax Returns)
Here:
$65,949
State:
$69,014
Salary/wage: $55,992 (reported on 85.9% of returns)
Here:
$55,992
State:
$55,872
(% of AGI for various income ranges: 1297.2% for AGIs below $25k, 4124.8% for AGIs $25k-50k, 7864.0% for AGIs $50k-75k, 9604.5% for AGIs $75k-100k, 17277.9% for AGIs $100k-200k)
Taxable interest for individuals: $610 (reported on 25.6% of returns)
This zip code:
$610
Tennessee:
$1,945
(% of AGI for various income ranges: 4.7% for AGIs below $25k, 12.1% for AGIs $25k-50k, 16.0% for AGIs $50k-75k, 18.2% for AGIs $75k-100k, 23.6% for AGIs $100k-200k)
Ordinary dividends: $3,571 (reported on 17.9% of returns)
Here:
$3,571
State:
$8,105
(% of AGI for various income ranges: 12.8% for AGIs below $25k, 34.5% for AGIs $25k-50k, 60.7% for AGIs $50k-75k, 70.9% for AGIs $75k-100k, 237.1% for AGIs $100k-200k)
Net capital gain/loss in AGI: +$13,473 (reported on 19.2% of returns)
Here:
+$13,473
State:
+$33,664
(% of AGI for various income ranges: 7.8% for AGIs below $25k, 50.7% for AGIs $25k-50k, 98.0% for AGIs $50k-75k, 258.2% for AGIs $75k-100k, 785.0% for AGIs $100k-200k)
Profit/loss from business: +$20,432 (reported on 21.8% of returns)
Here:
+$20,432
State:
+$18,991
(% of AGI for various income ranges: 193.3% for AGIs below $25k, 267.2% for AGIs $25k-50k, 538.0% for AGIs $50k-75k, 592.7% for AGIs $75k-100k, 1249.3% for AGIs $100k-200k)
Taxable individual retirement arrangement distribution: $14,775 (reported on 5.1% of returns)
37409:
$14,775
Tennessee:
$20,036
(% of AGI for various income ranges: 202.4% for AGIs $25k-50k, 425.0% for AGIs $100k-200k)
Total itemized deductions: $31,509 (reported on 7.1% of returns)
Here:
$31,509
State:
$40,136
(% of AGI for various income ranges: 538.7% for AGIs $50k-75k, 915.0% for AGIs $100k-200k)
Charity contributions: $19,912 (reported on 5.1% of returns)
Here:
$19,912
State:
$19,852
(% of AGI for various income ranges: 128.0% for AGIs $50k-75k, 395.7% for AGIs $100k-200k)
Taxes paid: $5,200 (reported on 7.1% of returns)
37409:
$5,200
State:
$6,038
(% of AGI for various income ranges: 95.3% for AGIs $50k-75k, 152.1% for AGIs $100k-200k)
Earned income credit: $1,841 (reported on 14.1% of returns)
Here:
$1,841
State:
$2,391
(% of AGI for various income ranges: 74.2% for AGIs below $25k, 47.6% for AGIs $25k-50k)
Percentage of individuals using paid preparers for their 2020 taxes: 92.3%
Here:
92%
State:
93%
(% for various income ranges: 90.0% for AGIs below $25k, 92.5% for AGIs $25k-50k, 91.3% for AGIs $50k-75k, 93.3% for AGIs $75k-100k, 95.5% for AGIs $100k-200k, 100.0% for AGIs over 200k)
Averages for the 2012 tax year for zip code 37409, filed in 2013:
Average Adjusted Gross Income (AGI) in 2012: $38,254 (Individual Income Tax Returns)
Here:
$38,254
State:
$53,767
Salary/wage: $36,242 (reported on 87.7% of returns)
Here:
$36,242
State:
$45,421
(% of AGI for various income ranges: 85.0% for AGIs below $25k, 88.3% for AGIs $25k-50k, 85.5% for AGIs $50k-75k, 82.1% for AGIs $75k-100k, 74.1% for AGIs $100k-200k)
Taxable interest for individuals: $581 (reported on 18.5% of returns)
This zip code:
$581
Tennessee:
$1,732
(% of AGI for various income ranges: 0.2% for AGIs below $25k, 0.2% for AGIs $50k-75k, 0.2% for AGIs $75k-100k, 0.7% for AGIs $100k-200k)
Ordinary dividends: $3,524 (reported on 11.6% of returns)
Here:
$3,524
State:
$6,739
(% of AGI for various income ranges: 0.7% for AGIs below $25k, 0.5% for AGIs $25k-50k, 1.3% for AGIs $50k-75k, 1.5% for AGIs $75k-100k, 1.6% for AGIs $100k-200k)
Net capital gain/loss in AGI: +$7,025 (reported on 8.2% of returns)
Here:
+$7,025
State:
+$19,082
(% of AGI for various income ranges: 0.4% for AGIs $25k-50k, 0.7% for AGIs $50k-75k, 1.4% for AGIs $75k-100k, 4.9% for AGIs $100k-200k)
Profit/loss from business: +$11,400 (reported on 17.1% of returns)
Here:
+$11,400
State:
+$15,240
(% of AGI for various income ranges: 9.5% for AGIs below $25k, 4.2% for AGIs $25k-50k, 3.2% for AGIs $50k-75k, 12.0% for AGIs $75k-100k)
Taxable individual retirement arrangement distribution: $9,271 (reported on 4.8% of returns)
37409:
$9,271
Tennessee:
$15,505
Total itemized deductions: $17,904 (25% of AGI, reported on 18.5% of returns)
Here:
$17,904
State:
$21,976
Here:
24.8% of AGI
State:
17.8% of AGI
(% of AGI for various income ranges: 6.4% for AGIs below $25k, 7.3% for AGIs $25k-50k, 9.2% for AGIs $50k-75k, 9.7% for AGIs $75k-100k, 10.8% for AGIs $100k-200k)
Charity contributions: $4,877 (reported on 15.1% of returns)
Here:
$4,877
State:
$6,709
(% of AGI for various income ranges: 0.5% for AGIs below $25k, 1.4% for AGIs $25k-50k, 2.3% for AGIs $50k-75k, 2.9% for AGIs $75k-100k, 2.6% for AGIs $100k-200k)
Taxes paid: $3,348 (reported on 18.5% of returns)
37409:
$3,348
State:
$4,829
(% of AGI for various income ranges: 0.7% for AGIs below $25k, 1.4% for AGIs $25k-50k, 2.0% for AGIs $50k-75k, 1.8% for AGIs $75k-100k, 2.1% for AGIs $100k-200k)
Earned income credit: $1,903 (reported on 21.9% of returns)
Here:
$1,903
State:
$2,404
(% of AGI for various income ranges: 5.3% for AGIs below $25k, 0.8% for AGIs $25k-50k)
Percentage of individuals using paid preparers for their 2012 taxes: 40.4%
Here:
40%
State:
52%
(% for various income ranges: 37.7% for AGIs below $25k, 37.2% for AGIs $25k-50k, 50.0% for AGIs $50k-75k, 50.0% for AGIs $75k-100k, 50.0% for AGIs $100k-200k)
Averages for the 2004 tax year for zip code 37409, filed in 2005:
Average Adjusted Gross Income (AGI) in 2004: $28,085 (Individual Income Tax Returns)
Here:
$28,085
State:
$44,088
Salary/wage: $26,957 (reported on 88.8% of returns)
Here:
$26,957
State:
$38,825
(% of AGI for various income ranges: 118.0% for AGIs below $10k, 87.6% for AGIs $10k-25k, 92.9% for AGIs $25k-50k, 85.5% for AGIs $50k-75k, 85.3% for AGIs $75k-100k, 54.7% for AGIs over 100k)
Taxable interest for individuals: $530 (reported on 23.9% of returns)
This zip code:
$530
Tennessee:
$1,802
(% of AGI for various income ranges: 0.9% for AGIs below $10k, 0.4% for AGIs $10k-25k, 0.2% for AGIs $25k-50k, 0.3% for AGIs $50k-75k, 1.0% for AGIs $75k-100k, 0.8% for AGIs over 100k)
Taxable dividends: $2,472 (reported on 11.7% of returns)
Here:
$2,472
State:
$3,727
(% of AGI for various income ranges: 1.3% for AGIs below $10k, 0.4% for AGIs $10k-25k, 0.4% for AGIs $25k-50k, 0.4% for AGIs $50k-75k, 0.4% for AGIs $75k-100k, 4.8% for AGIs over 100k)
Net capital gain/loss: +$8,596 (reported on 9.7% of returns)
Here:
+$8,596
State:
+$15,776
(% of AGI for various income ranges: -0.1% for AGIs below $10k, 0.9% for AGIs $10k-25k, -0.2% for AGIs $25k-50k, 1.1% for AGIs $50k-75k, -0.1% for AGIs $75k-100k, 19.6% for AGIs over 100k)
Profit/loss from business: +$7,647 (reported on 15.4% of returns)
Here:
+$7,647
State:
+$12,882
(% of AGI for various income ranges: 13.1% for AGIs below $10k, 4.8% for AGIs $10k-25k, 2.3% for AGIs $25k-50k, 5.4% for AGIs $50k-75k, 3.6% for AGIs $75k-100k, 4.8% for AGIs over 100k)
IRA payment deduction: $2,462 (reported on 0.9% of returns)
37409:
$2,462
Tennessee:
$2,934
Total itemized deductions: $14,381 (24% of AGI, reported on 15.6% of returns)
Here:
$14,381
State:
$18,035
Here:
23.6% of AGI
State:
19.9% of AGI
(% of AGI for various income ranges: 5.5% for AGIs $10k-25k, 6.5% for AGIs $25k-50k, 10.1% for AGIs $50k-75k, 12.4% for AGIs $75k-100k, 11.0% for AGIs over 100k)
Charity contributions deductions: $4,288 (7% of AGI, reported on 13.7% of returns)
Here:
$4,288
State:
$5,167
Here:
6.6% of AGI
State:
5.3% of AGI
(% of AGI for various income ranges: 0.8% for AGIs $10k-25k, 1.4% for AGIs $25k-50k, 2.9% for AGIs $50k-75k, 4.7% for AGIs $75k-100k, 3.2% for AGIs over 100k)
Total tax: $3,592 (reported on 67.4% of returns)
37409:
$3,592
State:
$7,482
(% of AGI for various income ranges: 4.3% for AGIs below $10k, 3.9% for AGIs $10k-25k, 7.0% for AGIs $25k-50k, 10.1% for AGIs $50k-75k, 10.0% for AGIs $75k-100k, 17.7% for AGIs over 100k)
Earned income credit: $1,739 (reported on 26.5% of returns)
Here:
$1,739
State:
$1,826
Percentage of individuals using paid preparers for their 2004 taxes: 51.5%
Here:
52%
State:
60%
(% for various income ranges: 42.9% for AGIs below $10k, 57.8% for AGIs $10k-25k, 51.2% for AGIs $25k-50k, 55.3% for AGIs $50k-75k, 34.1% for AGIs $75k-100k, 64.5% for AGIs over 100k)
Household received Food Stamps/SNAP in the past 12 months: 60 Household did not receive Food Stamps/SNAP in the past 12 months: 1,566
Women who had a birth in the past 12 months: 13 (7 now married, 6 unmarried) Women who did not have a birth in the past 12 months: 932 (431 now married, 500 unmarried)
Housing units in zip code 37409 with a mortgage: 746 (27 second mortgage, 27 both second mortgage and home equity loan) Median monthly owner costs for units with a mortgage: $1,441 Median monthly owner costs for units without a mortgage: $468
Residents with income below the poverty level in 2022:
This zip code:
14.1%
Whole state:
13.3%
Residents with income below 50% of the poverty level in 2022:
This zip code:
10.2%
Whole state:
7.1%
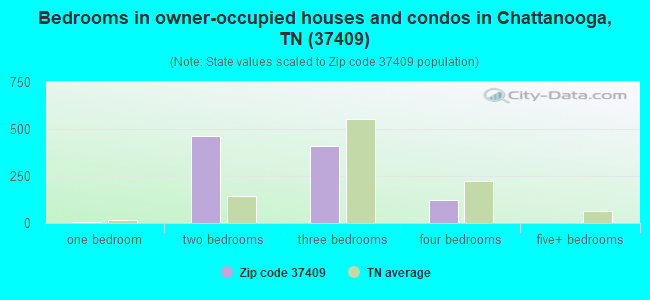
Median number of rooms in houses and condos:
Here:
5.9
State:
6.5
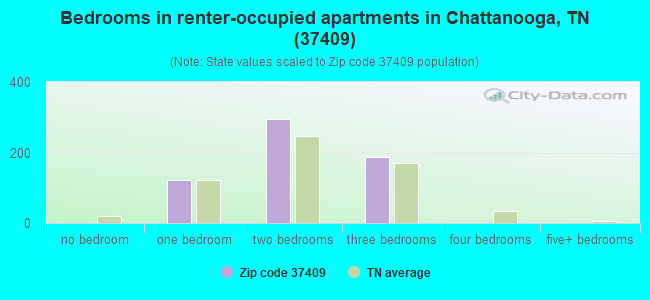
Median number of rooms in apartments:
Here:
4.9
State:
4.4
Notable locations in this zip code not listed on our city pages
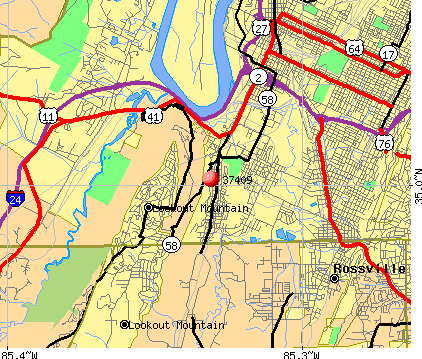
Churches in zip code 37409 include: Saint Elmo Avenue Baptist Church (A), Saint Elmo Church of Christ (B), Saint Elmo Presbyterian Church (C), Saint Elmo United Methodist Church (D). Display/hide their locations on the map
Tourist attractions (not listed on the city page) : Lookout Mountain Incline Railway - Bottom Station (Amusement & Theme Parks; 3917 Saint Elmo Avenue), Ruby Falls (1720 South Scenic Highway).
In group quarters: 25 (-1 institutionalized population)
Size of family households: 332 2-persons, 143 3-persons, 218 4-persons, 41 5-persons, 75 7-or-more-persons
Size of nonfamily households: 499 1-person, 312 2-persons, 9 4-persons
480 married couples with children.
102 single-parent households (16 men, 86 women).
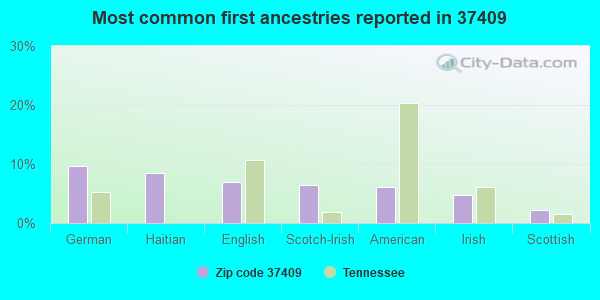
90.8% of residents of 37409 zip code speak English at home.
6.6% of residents speak Spanish at home (24% very well, 5% well, 7% not well, 65% not at all).
2.8% of residents speak other Indo-European language at home (75% very well, 25% well).
0.4% of residents speak Asian or Pacific Island language at home (100% very well).
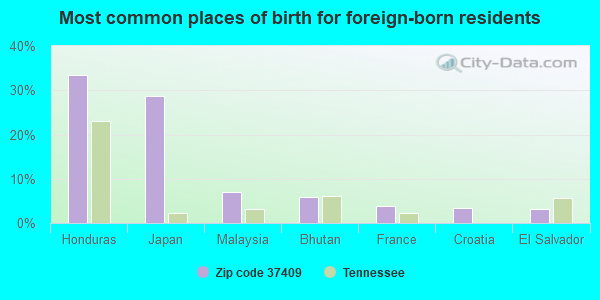
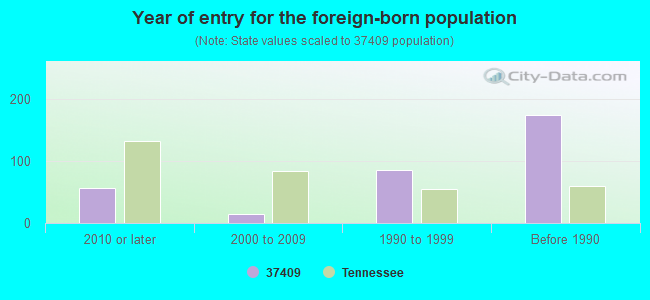
Foreign born population: 355 (10.0%) (51.8% of them are naturalized citizens)
Facilities with environmental interests located in this zip code:
CHATTEM INC (1715 WEST 38TH STREET in CHATTANOOGA, TN)
AIR MINOR (AIRS/AFS) CRITERIA AND HAZARDOUS AIR POLLUTANT INVENTORY (Inventory of air pollution sources) STATE MASTER (New Jersey environmental info) - NJEMS-003752, PESTICIDES - MANUFACTURE National Pollutant Discharge Elimination System NON-MAJOR (Tracking pollutant discharge elimination systems) - permit HAZARDOUS WASTE BIENNIAL REPORTER (Resource Conservation and Recovery Act (tracking hazardous waste)) Large Quantity Generators, more that 1000 kg of hazardous waste/month (Resource Conservation and Recovery Act (tracking hazardous waste)) TRI REPORTER (Tracking of toxic chemicals releasing facilities) Business SIC classification: MEDICINAL CHEMICALS AND BOTANICAL PRODUCTS; PHARMACEUTICAL PREPARATIONS; PERFUMES, COSMETICS, AND OTHER TOILET PREPARATIONS Business NAICS classification: PHARMACEUTICAL PREPARATION MANUFACTURING. Organizations: TECHNOLOGY SCIENCES GROUP INC, DERRILL PITTS (CONTACT/OPERATOR)
, RAY SMITH (CONTACT/OWNER)
, CHATTEM INC. (CONTACT/OWNER)
Alternative names: CHATTEM CHEMICALS, CHATTEM, INC.
BRENNTAG MID-SOUTH INC. (317 WAUHATCHIE PIKE in CHATTANOOGA, TN)
CRITERIA AND HAZARDOUS AIR POLLUTANT INVENTORY (Inventory of air pollution sources) HAZARDOUS WASTE BIENNIAL REPORTER (Resource Conservation and Recovery Act (tracking hazardous waste)) - ICIS-, ENFORCEMENT/COMPLIANCE ACTIVITY Large Quantity Generators, more that 1000 kg of hazardous waste/month (Resource Conservation and Recovery Act (tracking hazardous waste)) - notification - ICIS-, ENFORCEMENT/COMPLIANCE ACTIVITY TRI REPORTER (Tracking of toxic chemicals releasing facilities) Business SIC classification: CHEMICALS AND ALLIED PRODUCTS Business NAICS classification: ALL OTHER BASIC ORGANIC CHEMICAL MANUFACTURING. Organizations: CHARLIE LAMAR (CONTACT/OPERATOR)
Alternative names: BENNTAG MID SOUTH INC., BENNTAG MID SOUTH INC., P. B. & S. CO. INC., P B & S COMPANY INCORPORATED CHATTANOOGA PLANT, PB & S CHEMICAL COMPANY, INC
CHATTEM CHEMICALS INC. (3801 STREET ELMO AVENUE in CHATTANOOGA, TN)
AIR MAJOR (AIRS/AFS) - ICIS-, ENFORCEMENT/COMPLIANCE ACTIVITY CRITERIA AND HAZARDOUS AIR POLLUTANT INVENTORY (Inventory of air pollution sources) HAZARDOUS WASTE BIENNIAL REPORTER (Resource Conservation and Recovery Act (tracking hazardous waste)) Large Quantity Generators, more that 1000 kg of hazardous waste/month (Resource Conservation and Recovery Act (tracking hazardous waste)) - notification TRI REPORTER (Tracking of toxic chemicals releasing facilities) Business SIC classification: INDUSTRIAL INORGANIC CHEMICALS; MEDICINAL CHEMICALS AND BOTANICAL PRODUCTS; PHARMACEUTICAL PREPARATIONS; INDUSTRIAL ORGANIC CHEMICALS; CHEMICALS AND CHEMICAL PREPARATIONS Business NAICS classification: SPICE AND EXTRACT MANUFACTURING.; MEDICINAL AND BOTANICAL MANUFACTURING.; ALL OTHER MISCELLANEOUS CHEMICAL PRODUCT AND PREPARATION MANUFACTURING. Organizations: JAMES H. KEDROWSKI (CONTACT/OPERATOR)
, ELCAT INC. (CONTACT/OWNER)
Alternative names: CHATTEM CHEMICALS INC (CCI), CHATTEM CHEMICALS WAREHOUSE
CHATTEM CHEMICALS WAREHOUSE (3801 ST. ELMO AVE. in CHATTANOOGA, TN)
FORMAL ENFORCEMENT ACTION (Integrated Compliance Information System) - ICIS-04-2005-8008, ENFORCEMENT/COMPLIANCE ACTIVITY National Pollutant Discharge Elimination System NON-MAJOR (Tracking pollutant discharge elimination systems) - permit Business SIC classification: PHARMACEUTICAL PREPARATIONS
A-1 SHIPLEY'S WASTE OIL (2846 OLD HARRISON PIKE in CHATTANOOGA, TN)
(Integrated Compliance Information System) - ICIS-04-2001-9055, FORMAL ENFORCEMENT ACTION
AHLSTROM ENGINE FILTRATION INC (105 WEST 45TH STREET in CHATTANOOGA, TN)
AIR MINOR (AIRS/AFS) CRITERIA AND HAZARDOUS AIR POLLUTANT INVENTORY (Inventory of air pollution sources) TRI REPORTER (Tracking of toxic chemicals releasing facilities) Business SIC classification: PAPER MILLS Alternative names: AHLSTROM ENGINE FILTRATION INC., AHLSTROM ENGINE FILTRATION LLC., AHLSTROM FILTRATION, SOUTHERN CELLULOSE
BROAD STREET MACHINE COMPANY INC. (2614 BROAD STREET in CHATTANOOGA, TN)
CRITERIA AND HAZARDOUS AIR POLLUTANT INVENTORY (Inventory of air pollution sources) (Resource Conservation and Recovery Act (tracking hazardous waste)) Business SIC and NAICS classification: TEXTILE MACHINERY
ACHESON FOUNDRY & MACHINE WORK (511 W 38TH ST in CHATTANOOGA, TN)
AIR SYNTHETIC MINOR (AIRS/AFS) CRITERIA AND HAZARDOUS AIR POLLUTANT INVENTORY (Inventory of air pollution sources) Business SIC classification: GRAY AND DUCTILE IRON FOUNDRIES Business NAICS classification: IRON FOUNDRIES.
ART PRINTING CO INC (PO BOX 2001 in CHATTANOOGA, TN)
(Resource Conservation and Recovery Act (tracking hazardous waste)) Business NAICS classification: COMMERCIAL LITHOGRAPHIC PRINTING.
B & P STEEL DRUM INC (3425 ALTON PARK BLVD in CHATTANOOGA, TN)
(Resource Conservation and Recovery Act (tracking hazardous waste))
CHATTANOOGA HSY FINISHERS INC (PO BOX 1149 in CHATTANOOGA, TN)
(Resource Conservation and Recovery Act (tracking hazardous waste)) Business NAICS classification: SHEER HOSIERY MILLS.
CHATTEM DRUG & CHEMICAL CO. ( in CHATTANOOGA, TN)
(Resource Conservation and Recovery Act (tracking hazardous waste)) Business NAICS classification: MEDICINAL AND BOTANICAL MANUFACTURING.; PHARMACEUTICAL PREPARATION MANUFACTURING.
CHATTANOOGA CITY SCHOOL DISTRICT (1161 WEST 40TH STREET in CHATTANOOGA, TN)
COMPLIANCE ACTIVITY (Tracking inspections of insecticide, fungicide, and rodenticide, and toxic substances)
Housing units lacking complete plumbing facilities: 2.8% Housing units lacking complete kitchen facilities: 2.7%
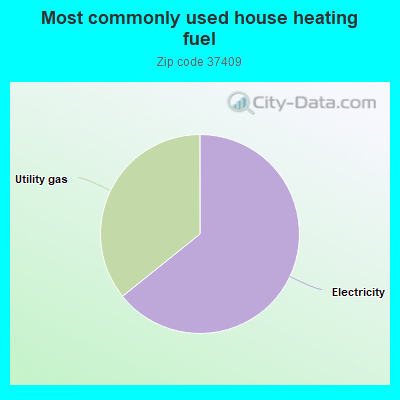
64.3%Electricity
35.8%Utility gas
Population in 1990: 2,848.
Place of birth for U.S.-born residents:
This state: 1,587
Northeast: 105
Midwest: 377
South: 1,012
West: 128
63% of the 37409 zip code residents lived in the same house 5 years ago. Out of people who lived in different houses, 74% lived in this county. Out of people who lived in different counties, 50% lived in Tennessee.
86% of the 37409 zip code residents lived in the same house 1 year ago. Out of people who lived in different houses, 62% moved from this county. Out of people who lived in different houses, 17% moved from different county within same state. Out of people who lived in different houses, 16% moved from different state.
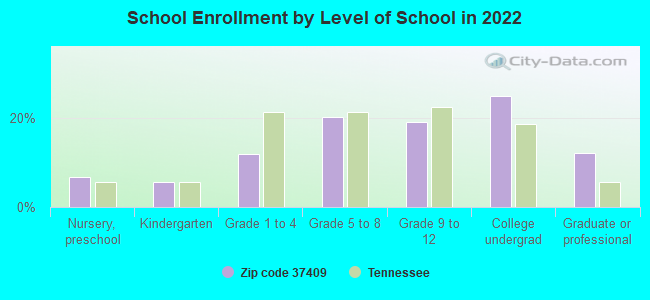
Private vs. public school enrollment:
Students in private schools in grades 1 to 8 (elementary and middle school): 113
Here:
41.3%
Tennessee:
15.0%
Students in private schools in grades 9 to 12 (high school): 92
Here:
56.5%
Tennessee:
16.2%
Students in private undergraduate colleges: 72
Here:
33.9%
Tennessee:
23.5%
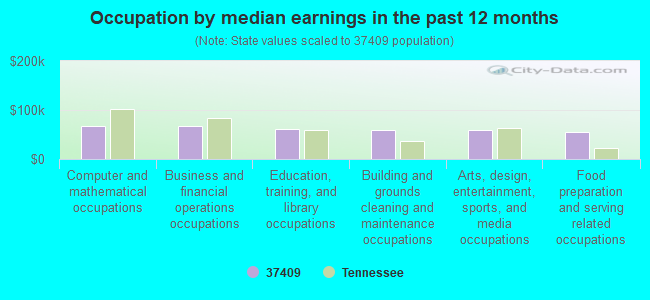
Occupation by median earnings in the past 12 months ($)
68,345Computer and mathematical occupations
66,527Business and financial operations occupations
60,916Education, training, and library occupations
58,883Building and grounds cleaning and maintenance occupations
58,772Arts, design, entertainment, sports, and media occupations
54,650Food preparation and serving related occupations
Companies with federal contracts located in this zip code:
VEGA CORPORATION OF TENNESSEE (3614 CHARGER DRIVE in CHATTANOOGA, TN; small business) : $632,715 in 6 contractsfrom 2000 to 2004
Contracts for Construction of Structures and Facilities -- Other Non-Building Facilities, Maintenance, Repair or Alteration of Real Property -- Other Administrative Facilities and Service Buildings by Air Force, Tennessee Valley Authority Signed by year:2000: $53,000; 2001: $0; 2002: $0; 2003: $575,000; 2004: $4,715; 2005: $0; 2006: $0.
Biggest contracts:
$575,000 with Air Force for Construction of Structures and Facilities -- Other Non-Building Facilities. Signed on 2003-09-26. Completion date: 2004-01-30.
$50,000 with Tennessee Valley Authority for Maintenance, Repair or Alteration of Real Property -- Other Administrative Facilities and Service Buildings. Signed on 2000-03-15. Completion date: 2000-03-15.
$33,000, same as above.Signed on 2000-06-15. Completion date: 2000-06-15.
$4,715 with Air Force for Construction of Structures and Facilities -- Other Non-Building Facilities. Signed on 2004-09-15. Completion date: 2004-01-30.
CHATTEM CHEMICALS, INC (3708 ST ELMO AVENUE in CHATTANOOGA, TN; small business) : $37,250 in 2 contractsfrom 2000 to 2005
$32,000 with Financial Crimes Enforcement Network for Surgical Dressing Materials. Signed on 2000-05-15. Completion date: 2000-06-15.
$5,250 with Navy for Chemicals. Taking place in MD. Signed on 2005-01-11. Completion date: 2005-02-15.
Top industries in this zip code by the number of employees in 2005:
Arts, Entertainment, and Recreation: Nature Parks and Other Similar Institutions (100-249 employees: 1 establishment)
Educational Services: Elementary and Secondary Schools (100-249: 1)
Wholesale Trade: Other Chemical and Allied Products Merchant Wholesalers (50-99: 2)
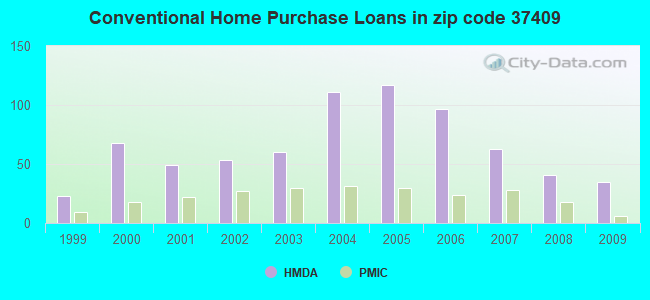
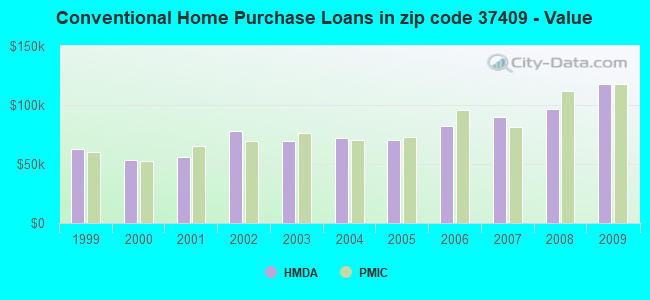
Detailed PMIC statistics for the following Tracts:0018.00
2002 - 2018 National Fire Incident Reporting System (NFIRS) incidents
Based on the data from the years 2002 - 2018 the average number of fire incidents per year is 13. The highest number of reported fire incidents - 23 took place in 2007, and the least - 2 in 2002. The data has a growing trend.
When looking into fire subcategories, the most incidents belonged to: Outside Fires (46.8%), and Structure Fires (33.0%).
Fire incident types reported to NFIRS in Zip Code 37409


 Nearest zip codes: 37410, 37350, 37408, 37402, 37407, 37403.


 Based on the data from the years 2002 - 2018 the average number of fire incidents per year is 13. The highest number of reported fire incidents - 23 took place in 2007, and the least - 2 in 2002. The data has a growing trend.
 When looking into fire subcategories, the most incidents belonged to: Outside Fires (46.8%), and Structure Fires (33.0%).