Estimated zip code population in 2022: 27,725 Zip code population in 2010: 24,682 Zip code population in 2000: 21,966
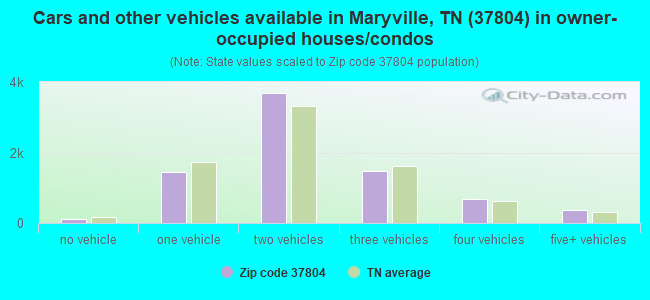
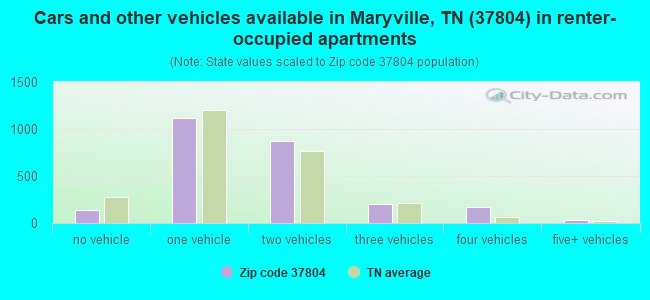
Houses and condos: 10,765 Renter-occupied apartments: 2,508
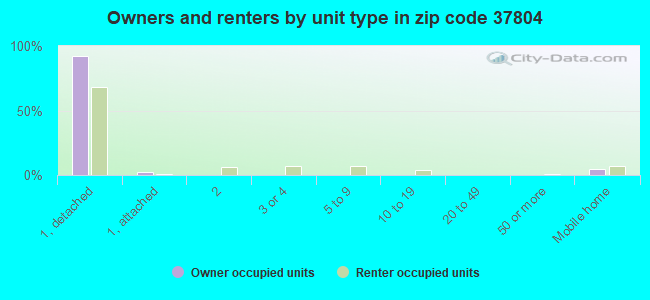
% of renters here:
24%
State:
33%
March 2022 cost of living index in zip code 37804: 85.8 (less than average, U.S. average is 100)
Land area: 34.8 sq. mi. Water area: 0.0 sq. mi.
Population density: 797 people per square mile
(low).
OSM Map
General Map
Google Map
MSN Map
OSM Map
General Map
Google Map
MSN Map
OSM Map
General Map
Google Map
MSN Map
OSM Map
General Map
Google Map
MSN Map
Please wait while loading the map...
Real estate property taxes paid for housing units in 2022:
This zip code:
0.5% ($1,252)
Tennessee:
0.5% ($1,376)
Median real estate property taxes paid for housing units with mortgages in 2022: $1,304 (0.5%) Median real estate property taxes paid for housing units with no mortgage in 2022: $1,165 (0.5%)
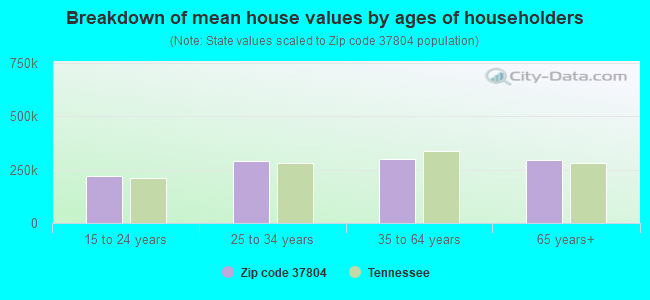
Estimated median house/condo value in 2022: $250,933
37804:
$250,933
Tennessee:
$284,800
According to our research of Tennessee and other state lists, there were 34 registered sex offenders living in 37804 zip code as of April 18, 2024. The ratio of all residents to sex offenders in zip code 37804 is 764 to 1. The ratio of registered sex offenders to all residents in this zip code is lower than the state average.
Median resident age:
This zip code:
39.8 years
Tennessee median age:
39.2 years
Average household size:
This zip code:
2.6 people
Tennessee:
2.4 people
Averages for the 2020 tax year for zip code 37804, filed in 2021:
Average Adjusted Gross Income (AGI) in 2020: $56,455 (Individual Income Tax Returns)
Here:
$56,455
State:
$69,014
Salary/wage: $49,609 (reported on 80.8% of returns)
Here:
$49,609
State:
$55,872
(% of AGI for various income ranges: 1147.4% for AGIs below $25k, 3376.6% for AGIs $25k-50k, 6035.4% for AGIs $50k-75k, 8919.2% for AGIs $75k-100k, 15257.6% for AGIs $100k-200k, 52962.2% for AGIs over 200k)
Taxable interest for individuals: $1,273 (reported on 26.6% of returns)
This zip code:
$1,273
Tennessee:
$1,945
(% of AGI for various income ranges: 15.2% for AGIs below $25k, 21.2% for AGIs $25k-50k, 37.6% for AGIs $50k-75k, 58.4% for AGIs $75k-100k, 130.5% for AGIs $100k-200k, 850.0% for AGIs over 200k)
Ordinary dividends: $4,419 (reported on 14.1% of returns)
Here:
$4,419
State:
$8,105
(% of AGI for various income ranges: 17.6% for AGIs below $25k, 24.7% for AGIs $25k-50k, 67.4% for AGIs $50k-75k, 81.0% for AGIs $75k-100k, 161.2% for AGIs $100k-200k, 3497.8% for AGIs over 200k)
Net capital gain/loss in AGI: +$9,137 (reported on 12.6% of returns)
Here:
+$9,137
State:
+$33,664
(% of AGI for various income ranges: 3.1% for AGIs below $25k, 27.0% for AGIs $25k-50k, 54.9% for AGIs $50k-75k, 123.8% for AGIs $75k-100k, 363.0% for AGIs $100k-200k, 8571.1% for AGIs over 200k)
Profit/loss from business: +$14,340 (reported on 15.1% of returns)
Here:
+$14,340
State:
+$18,991
(% of AGI for various income ranges: 120.4% for AGIs below $25k, 126.4% for AGIs $25k-50k, 207.7% for AGIs $50k-75k, 308.0% for AGIs $75k-100k, 758.3% for AGIs $100k-200k, 6925.6% for AGIs over 200k)
Taxable individual retirement arrangement distribution: $16,802 (reported on 9.8% of returns)
37804:
$16,802
Tennessee:
$20,036
(% of AGI for various income ranges: 62.2% for AGIs below $25k, 102.7% for AGIs $25k-50k, 206.1% for AGIs $50k-75k, 238.2% for AGIs $75k-100k, 688.4% for AGIs $100k-200k, 3974.4% for AGIs over 200k)
Self-employed (Keogh) retirement plans: $15,967 (reported on 0.2% of returns)
37804:
$15,967
Tennessee:
$28,955
(% of AGI for various income ranges: 48.9% for AGIs $100k-200k)
Total itemized deductions: $36,148 (reported on 4.1% of returns)
Here:
$36,148
State:
$40,136
(% of AGI for various income ranges: 26.3% for AGIs below $25k, 70.2% for AGIs $25k-50k, 202.0% for AGIs $50k-75k, 267.9% for AGIs $75k-100k, 500.2% for AGIs $100k-200k, 5818.9% for AGIs over 200k)
Charity contributions: $15,565 (reported on 3.5% of returns)
Here:
$15,565
State:
$19,852
(% of AGI for various income ranges: 13.6% for AGIs $25k-50k, 42.8% for AGIs $50k-75k, 55.5% for AGIs $75k-100k, 188.6% for AGIs $100k-200k, 3754.4% for AGIs over 200k)
Taxes paid: $4,925 (reported on 3.9% of returns)
37804:
$4,925
State:
$6,038
(% of AGI for various income ranges: 2.9% for AGIs below $25k, 5.9% for AGIs $25k-50k, 24.9% for AGIs $50k-75k, 34.3% for AGIs $75k-100k, 83.2% for AGIs $100k-200k, 714.4% for AGIs over 200k)
Earned income credit: $2,191 (reported on 15.8% of returns)
Here:
$2,191
State:
$2,391
(% of AGI for various income ranges: 81.9% for AGIs below $25k, 64.4% for AGIs $25k-50k, 1.1% for AGIs $50k-75k)
Percentage of individuals using paid preparers for their 2020 taxes: 94.1%
Here:
94%
State:
93%
(% for various income ranges: 92.9% for AGIs below $25k, 95.1% for AGIs $25k-50k, 94.1% for AGIs $50k-75k, 95.2% for AGIs $75k-100k, 94.3% for AGIs $100k-200k, 92.6% for AGIs over 200k)
Averages for the 2012 tax year for zip code 37804, filed in 2013:
Average Adjusted Gross Income (AGI) in 2012: $44,913 (Individual Income Tax Returns)
Here:
$44,913
State:
$53,767
Salary/wage: $40,214 (reported on 83.8% of returns)
Here:
$40,214
State:
$45,421
(% of AGI for various income ranges: 75.9% for AGIs below $25k, 78.4% for AGIs $25k-50k, 76.9% for AGIs $50k-75k, 77.3% for AGIs $75k-100k, 75.3% for AGIs $100k-200k, 57.1% for AGIs over 200k)
Taxable interest for individuals: $1,272 (reported on 28.5% of returns)
This zip code:
$1,272
Tennessee:
$1,732
(% of AGI for various income ranges: 1.4% for AGIs below $25k, 0.8% for AGIs $25k-50k, 0.6% for AGIs $50k-75k, 0.8% for AGIs $75k-100k, 0.5% for AGIs $100k-200k, 1.1% for AGIs over 200k)
Ordinary dividends: $3,034 (reported on 13.6% of returns)
Here:
$3,034
State:
$6,739
(% of AGI for various income ranges: 1.4% for AGIs below $25k, 0.7% for AGIs $25k-50k, 0.7% for AGIs $50k-75k, 0.6% for AGIs $75k-100k, 1.0% for AGIs $100k-200k, 1.7% for AGIs over 200k)
Net capital gain/loss in AGI: +$5,397 (reported on 10.1% of returns)
Here:
+$5,397
State:
+$19,082
(% of AGI for various income ranges: 0.1% for AGIs $25k-50k, 0.2% for AGIs $50k-75k, 0.6% for AGIs $75k-100k, 1.1% for AGIs $100k-200k, 9.0% for AGIs over 200k)
Profit/loss from business: +$12,012 (reported on 13.9% of returns)
Here:
+$12,012
State:
+$15,240
(% of AGI for various income ranges: 6.9% for AGIs below $25k, 2.6% for AGIs $25k-50k, 3.0% for AGIs $50k-75k, 2.6% for AGIs $75k-100k, 2.9% for AGIs $100k-200k, 7.8% for AGIs over 200k)
Taxable individual retirement arrangement distribution: $12,942 (reported on 9.6% of returns)
37804:
$12,942
Tennessee:
$15,505
(% of AGI for various income ranges: 2.9% for AGIs below $25k, 2.2% for AGIs $25k-50k, 2.5% for AGIs $50k-75k, 2.8% for AGIs $75k-100k, 3.2% for AGIs $100k-200k, 3.3% for AGIs over 200k)
Self-employment retirement plans: $13,933 (reported on 0.3% of returns)
37804:
$13,933
Tennessee:
$22,567
Total itemized deductions: $18,814 (22% of AGI, reported on 22.2% of returns)
Here:
$18,814
State:
$21,976
Here:
22.4% of AGI
State:
17.8% of AGI
(% of AGI for various income ranges: 6.5% for AGIs below $25k, 9.3% for AGIs $25k-50k, 8.8% for AGIs $50k-75k, 9.5% for AGIs $75k-100k, 11.3% for AGIs $100k-200k, 9.3% for AGIs over 200k)
Charity contributions: $5,537 (reported on 17.3% of returns)
Here:
$5,537
State:
$6,709
(% of AGI for various income ranges: 0.7% for AGIs below $25k, 1.2% for AGIs $25k-50k, 1.7% for AGIs $50k-75k, 2.2% for AGIs $75k-100k, 3.1% for AGIs $100k-200k, 5.0% for AGIs over 200k)
Taxes paid: $3,612 (reported on 21.9% of returns)
37804:
$3,612
State:
$4,829
(% of AGI for various income ranges: 0.8% for AGIs below $25k, 1.5% for AGIs $25k-50k, 1.7% for AGIs $50k-75k, 1.9% for AGIs $75k-100k, 2.4% for AGIs $100k-200k, 2.1% for AGIs over 200k)
Earned income credit: $2,188 (reported on 19.6% of returns)
Here:
$2,188
State:
$2,404
(% of AGI for various income ranges: 6.1% for AGIs below $25k, 1.1% for AGIs $25k-50k)
Percentage of individuals using paid preparers for their 2012 taxes: 49.1%
Here:
49%
State:
52%
(% for various income ranges: 46.2% for AGIs below $25k, 50.0% for AGIs $25k-50k, 51.9% for AGIs $50k-75k, 51.0% for AGIs $75k-100k, 51.9% for AGIs $100k-200k, 72.7% for AGIs over 200k)
Averages for the 2004 tax year for zip code 37804, filed in 2005:
Average Adjusted Gross Income (AGI) in 2004: $38,323 (Individual Income Tax Returns)
Here:
$38,323
State:
$44,088
Salary/wage: $35,389 (reported on 84.2% of returns)
Here:
$35,389
State:
$38,825
(% of AGI for various income ranges: 116.7% for AGIs below $10k, 72.6% for AGIs $10k-25k, 80.4% for AGIs $25k-50k, 82.5% for AGIs $50k-75k, 84.4% for AGIs $75k-100k, 63.1% for AGIs over 100k)
Taxable interest for individuals: $1,486 (reported on 38.2% of returns)
This zip code:
$1,486
Tennessee:
$1,802
(% of AGI for various income ranges: 4.8% for AGIs below $10k, 2.9% for AGIs $10k-25k, 1.3% for AGIs $25k-50k, 1.2% for AGIs $50k-75k, 0.8% for AGIs $75k-100k, 1.4% for AGIs over 100k)
Taxable dividends: $1,871 (reported on 17.1% of returns)
Here:
$1,871
State:
$3,727
(% of AGI for various income ranges: 1.5% for AGIs below $10k, 0.9% for AGIs $10k-25k, 0.6% for AGIs $25k-50k, 0.5% for AGIs $50k-75k, 0.5% for AGIs $75k-100k, 1.6% for AGIs over 100k)
Net capital gain/loss: +$6,173 (reported on 12.9% of returns)
Here:
+$6,173
State:
+$15,776
(% of AGI for various income ranges: -0.8% for AGIs below $10k, -0.0% for AGIs $10k-25k, 0.5% for AGIs $25k-50k, 0.6% for AGIs $50k-75k, 1.2% for AGIs $75k-100k, 8.0% for AGIs over 100k)
Profit/loss from business: +$9,790 (reported on 15.0% of returns)
Here:
+$9,790
State:
+$12,882
(% of AGI for various income ranges: 3.9% for AGIs below $10k, 6.3% for AGIs $10k-25k, 2.7% for AGIs $25k-50k, 2.4% for AGIs $50k-75k, 2.2% for AGIs $75k-100k, 6.7% for AGIs over 100k)
IRA payment deduction: $2,471 (reported on 2.1% of returns)
37804:
$2,471
Tennessee:
$2,934
(% of AGI for various income ranges: 0.1% for AGIs $10k-25k, 0.2% for AGIs $25k-50k, 0.1% for AGIs $50k-75k, 0.1% for AGIs $75k-100k, 0.1% for AGIs over 100k)
Self-employed pension: $11,600 (reported on 0.3% of returns)
Here:
$11,600
Tennessee:
$16,857
Total itemized deductions: $15,537 (23% of AGI, reported on 24.8% of returns)
Here:
$15,537
State:
$18,035
Here:
22.9% of AGI
State:
19.9% of AGI
(% of AGI for various income ranges: 11.9% for AGIs below $10k, 8.6% for AGIs $10k-25k, 9.4% for AGIs $25k-50k, 10.1% for AGIs $50k-75k, 11.6% for AGIs $75k-100k, 10.3% for AGIs over 100k)
Charity contributions deductions: $4,068 (6% of AGI, reported on 21.1% of returns)
Here:
$4,068
State:
$5,167
Here:
5.7% of AGI
State:
5.3% of AGI
(% of AGI for various income ranges: 0.7% for AGIs below $10k, 1.1% for AGIs $10k-25k, 1.6% for AGIs $25k-50k, 1.9% for AGIs $50k-75k, 2.7% for AGIs $75k-100k, 3.9% for AGIs over 100k)
Total tax: $4,921 (reported on 74.8% of returns)
37804:
$4,921
State:
$7,482
(% of AGI for various income ranges: 4.0% for AGIs below $10k, 4.2% for AGIs $10k-25k, 6.4% for AGIs $25k-50k, 8.4% for AGIs $50k-75k, 10.6% for AGIs $75k-100k, 18.1% for AGIs over 100k)
Earned income credit: $1,660 (reported on 17.1% of returns)
Here:
$1,660
State:
$1,826
Percentage of individuals using paid preparers for their 2004 taxes: 55.8%
Here:
56%
State:
60%
(% for various income ranges: 49.8% for AGIs below $10k, 59.3% for AGIs $10k-25k, 57.3% for AGIs $25k-50k, 55.3% for AGIs $50k-75k, 51.5% for AGIs $75k-100k, 59.4% for AGIs over 100k)
Likely homosexual households (counted as self-reported same-sex unmarried-partner households)
Lesbian couples: 0.6% of all households
Gay men: 0.5% of all households
Household received Food Stamps/SNAP in the past 12 months: 612 Household did not receive Food Stamps/SNAP in the past 12 months: 9,681
Women who had a birth in the past 12 months: 277 (212 now married, 66 unmarried) Women who did not have a birth in the past 12 months: 6,076 (3,011 now married, 3,065 unmarried)
Housing units in zip code 37804 with a mortgage: 4,744 (441 second mortgage, 110 home equity loan, 264 both second mortgage and home equity loan) Houses without a mortgage: 67
Median monthly owner costs for units with a mortgage: $1,332 Median monthly owner costs for units without a mortgage: $406
Residents with income below the poverty level in 2022:
This zip code:
8.4%
Whole state:
13.3%
Residents with income below 50% of the poverty level in 2022:
This zip code:
5.7%
Whole state:
7.1%
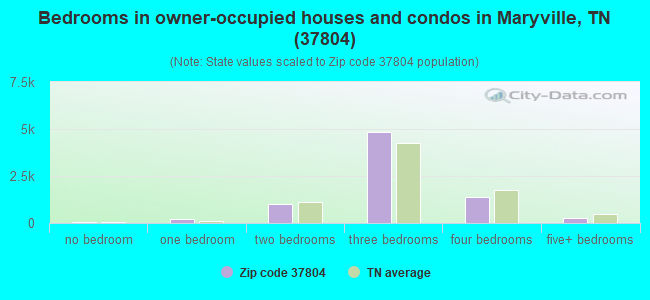
Median number of rooms in houses and condos:
Here:
6.3
State:
6.5
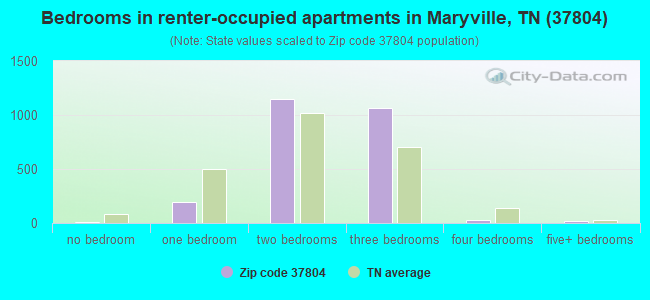
Median number of rooms in apartments:
Here:
4.6
State:
4.4
Notable locations in this zip code not listed on our city pages
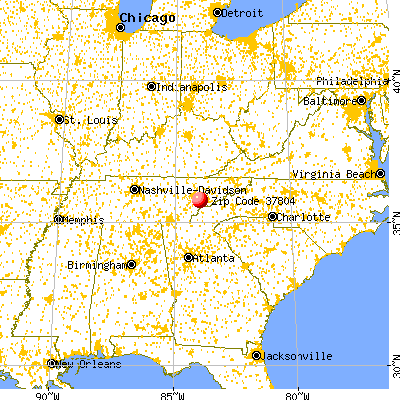
Notable locations in zip code 37804: Blount County Fire Protection District Station 2 (A), Asbury Acres (B), Blount County Fire Protection District Station 7 (C), City of Maryville Fire Department Station 2 (D), Blount County Courthouse (E), Union Planters Building (F). Display/hide their locations on the map
Churches in zip code 37804 include: Logans Chapel Methodist Church (A), Union Temple (B), Trinity Church (C), Pleasant Grove Baptist Church (D), Pilgrim Church (E), Clarks Grove Cumberland Presbyterian Church (F), Centennial Presbyterian Church (G), Cedar Grove Baptist Church (H), Brantleys Chapel (I). Display/hide their locations on the map
Cemeteries: Union Temple Cemetery (1), Nails Creek Cemetery (2), Mount Lebanon Cemetery (3), Logans Chapel Cemetery (4), East Maryville Cemetery (5), Clarks Grove Cemetery (6), Centennial Cemetery (7). Display/hide their locations on the map
Streams, rivers, and creeks: Flag Branch (A), Ellejoy Creek (B), Gravelly Creek (C), Brown Creek (D), Duncan Creek (E), Pistol Creek (F), Peppermint Branch (G), Crooked Creek (H), Rocky Branch (I). Display/hide their locations on the map
Parks in zip code 37804 include: Amerine Park (1), Bicentennial Park (2), Everett Football Field (3), John Sevier Park (4), Hunt Field (5), Everett Park (6). Display/hide their locations on the map
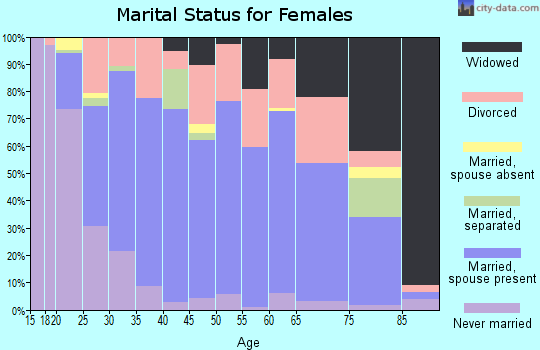
4,279 married couples with children.
886 single-parent households (311 men, 575 women).
94.7% of residents of 37804 zip code speak English at home.
3.0% of residents speak Spanish at home (63% very well, 24% well, 11% not well, 2% not at all).
0.7% of residents speak other Indo-European language at home (70% very well, 30% well).
1.4% of residents speak Asian or Pacific Island language at home (50% very well, 50% well).
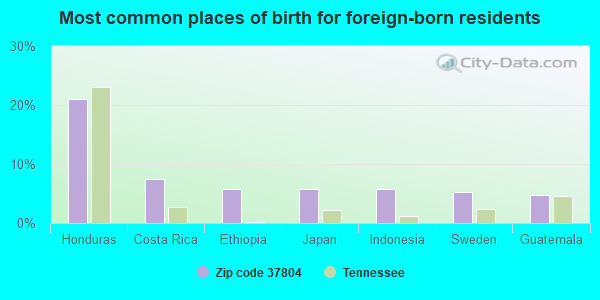
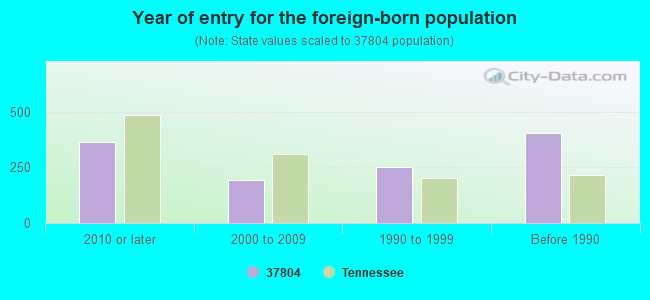
Foreign born population: 1,001 (3.6%) (36.2% of them are naturalized citizens)
Facilities with environmental interests located in this zip code:
CONTRACTOR'S MACHINERY, INC. (3007 OLD KNOXVILLE HIGHWAY in MARYVILLE, TN)
Large Quantity Generators, more that 1000 kg of hazardous waste/month (Resource Conservation and Recovery Act (tracking hazardous waste)) Organizations: CHRIS WIELAND (CONTACT/OPERATOR)
, VIRGINIA G. & WILLIAM C. NASH T. TRUST (CONTACT/OWNER)
Housing units lacking complete plumbing facilities: 1.3% Housing units lacking complete kitchen facilities: 1.6%
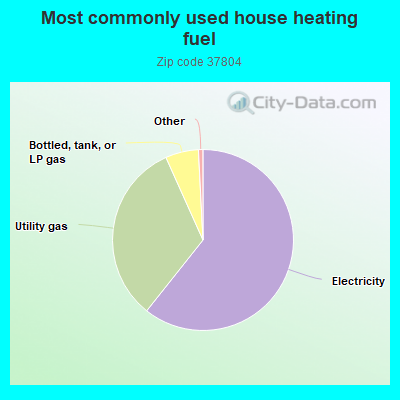
60.7%Electricity
32.6%Utility gas
5.9%Bottled, tank, or LP gas
Population in 1990: 31,758.
Place of birth for U.S.-born residents:
This state: 17,042
Northeast: 1,157
Midwest: 2,764
South: 4,535
West: 885
53% of the 37804 zip code residents lived in the same house 5 years ago. Out of people who lived in different houses, 53% lived in this county. Out of people who lived in different counties, 50% lived in Tennessee.
93% of the 37804 zip code residents lived in the same house 1 year ago. Out of people who lived in different houses, 56% moved from this county. Out of people who lived in different houses, 25% moved from different county within same state. Out of people who lived in different houses, 20% moved from different state. Out of people who lived in different houses, 0% moved from abroad.
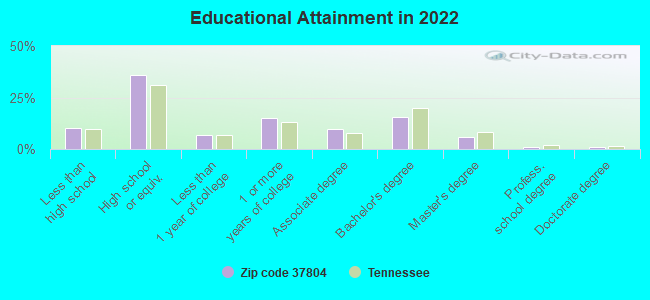
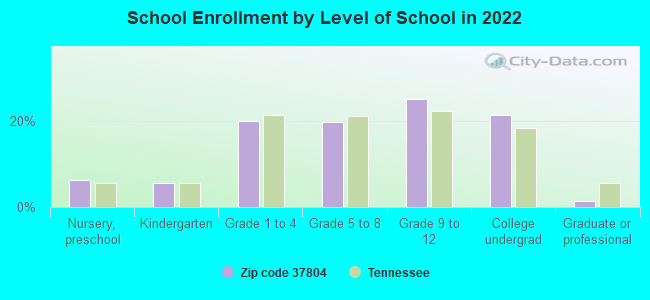
Private vs. public school enrollment:
Students in private schools in grades 1 to 8 (elementary and middle school): 249
Here:
10.9%
Tennessee:
15.0%
Students in private schools in grades 9 to 12 (high school): 183
Here:
12.8%
Tennessee:
16.2%
Students in private undergraduate colleges: 632
Here:
51.8%
Tennessee:
23.5%
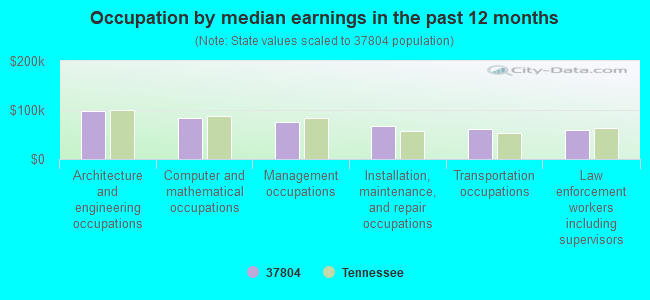
Occupation by median earnings in the past 12 months ($)
97,290Architecture and engineering occupations
82,940Computer and mathematical occupations
76,362Management occupations
66,429Installation, maintenance, and repair occupations
60,823Transportation occupations
59,327Law enforcement workers including supervisors
Companies with federal contracts located in this zip code (MARYVILLE, TN):
ECHOTA TECHNOLOGIES CORPORATIO (S WASH ST STE 372; small business) 25 employees, $1532065 revenue. : $7,189,711 in 39 contractsfrom 2001 to 2006
Contracts for Other Administrative Support Services, Training/Curriculum Development, Education Services, Other Education and Training Services, and moreby U.S. Special Operations Command, Department of Defense, Navy, Federal Technology Service, and others Signed by year:2000: $0; 2001: $46,785; 2002: $108,600; 2003: $340,120; 2004: $1,068,519; 2005: $4,225,288; 2006: $1,400,399.
Biggest contracts:
$1,464,785 with U.S. Special Operations Command for Other Administrative Support Services. Taking place in NC. Signed on 2005-11-01. Completion date: 2006-11-14.
$996,790 with U.S. Special Operations Command for Training/Curriculum Development. Taking place in NC. Signed on 2005-12-29. Completion date: 2006-12-31.
$886,800 with Department of Defense for Education Services. Taking place in NC. Signed on 2004-12-28. Completion date: 2005-12-31.
$869,889 with U.S. Special Operations Command for Other Education and Training Services. Taking place in NC. Signed on 2006-03-10. Completion date: 2006-04-13.
SIMULATION DYNAMICS, INC (416 HIGH ST; small business) : $349,950 in 5 contractsfrom 1999 to 2004
Contracts for Other ADP and Telecommunications Services (includes data storage on tapes, compact disks, etc.), Other Professional Services, Other Research and Development -- Basic Research (R&D) by Federal Technology Service, Navy Signed by year:2000: $179,000; 2001: $0; 2002: $0; 2003: $0; 2004: -$9,050; 2005: $0; 2006: $0.
Biggest contracts:
$180,000 with Federal Technology Service for Other ADP and Telecommunications Services (includes data storage on tapes, compact disks, etc.). Signed on 1999-11-15. Completion date: 2000-12-15.
$94,000 with Navy for Other Professional Services. Taking place in CA. Signed on 2000-12-19. Completion date: 2001-12-31.
$55,000, same as above.Signed on 2000-12-19. Completion date: 2001-12-31.
$30,000 with Navy for Other Research and Development -- Basic Research (R&D). Taking place in CA. Signed on 2000-05-31. Completion date: 2000-09-29.
CALLOWAY OIL COMPANY (2128 E BROADWAY) : $66,500 in 10 contractsin 2005
Contracts for Fuel Oils by Army, U.S. Army Corps of Engineers - civil program financing only Signed by year:2000: $0; 2001: $0; 2002: $0; 2003: $0; 2004: $0; 2005: $66,500; 2006: $0.
Biggest contracts:
$24,705 with Army for Fuel Oils. Signed on 2005-08-29. Completion date: 2005-08-30.
$24,705 with U.S. Army Corps of Engineers - civil program financing only for Fuel Oils. Signed on 2005-08-29. Completion date: 2005-08-30.
$6,927 with Army for Fuel Oils. Signed on 2005-08-03. Completion date: 2005-06-30.
$6,927 with U.S. Army Corps of Engineers - civil program financing only for Fuel Oils. Signed on 2005-08-03. Completion date: 2005-06-30.
MTC ASSOCIATES LLC (3247 E LAMAR ALEXANDER PK; small business) : $57,395 in 6 contractsfrom 2002 to 2006
Contracts for Athletic and Sporting Equipment, Miscellaneous Items, Training Aids by Army, Air Force Signed by year:2000: $0; 2001: $0; 2002: $8,000; 2003: $0; 2004: $4,720; 2005: $25,800; 2006: $18,875.
Biggest contracts:
$14,500 with Army for Athletic and Sporting Equipment. Taking place in NY. Signed on 2005-08-16. Completion date: 2005-08-25.
$13,940 with Army for Athletic and Sporting Equipment. Signed on 2006-06-26. Completion date: 2006-07-31.
$11,300 with Air Force for Miscellaneous Items. Signed on 2005-09-07. Completion date: 2005-10-31.
$8,000 with Army for Training Aids. Signed on 2002-05-10. Completion date: 2002-05-24.
COMPLETE KITCHEN AND BATH (1535 BROADWAY; small business)
$16,500 with Army for Cabinets, Lockers, Bins, and Shelving. Signed on 2005-09-09. Completion date: 2005-11-08.
Top industries in this zip code by the number of employees in 2005:
Health Care and Social Assistance: General Medical and Surgical Hospitals (over 1000 employees: 1 establishment)
Educational Services: Colleges, Universities, and Professional Schools (500-999: 1)
Finance and Insurance: Sales Financing (500-999: 1)
Management of Companies and Enterprises: Corporate, Subsidiary, and Regional Managing Offices (100-249: 1, 20-49: 1, 5-9: 2, 1-4: 12)
Health Care and Social Assistance: Offices of Physicians (except Mental Health Specialists) (20-49: 1, 10-19: 7, 5-9: 11, 1-4: 6)
2002 - 2018 National Fire Incident Reporting System (NFIRS) incidents
Based on the data from the years 2002 - 2018 the average number of fire incidents per year is 61. The highest number of fires - 92 took place in 2005, and the least - 38 in 2013. The data has a dropping trend.
When looking into fire subcategories, the most incidents belonged to: Outside Fires (41.1%), and Structure Fires (33.5%).
Fire incident types reported to NFIRS in Zip Code 37804


 Nearest zip codes: 37853, 37701, 37886, 37920, 37803, 37919.


 Based on the data from the years 2002 - 2018 the average number of fire incidents per year is 61. The highest number of fires - 92 took place in 2005, and the least - 38 in 2013. The data has a dropping trend.
 When looking into fire subcategories, the most incidents belonged to: Outside Fires (41.1%), and Structure Fires (33.5%).