Estimated zip code population in 2022: 735 Zip code population in 2010: 514 Zip code population in 2000: 529
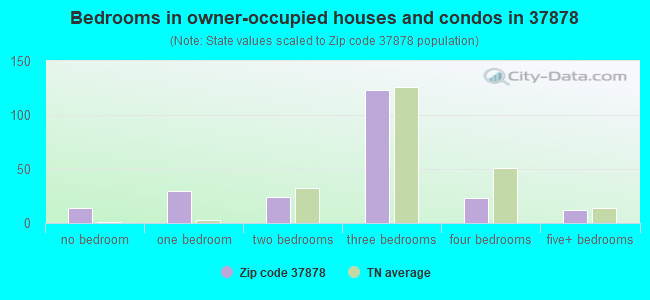
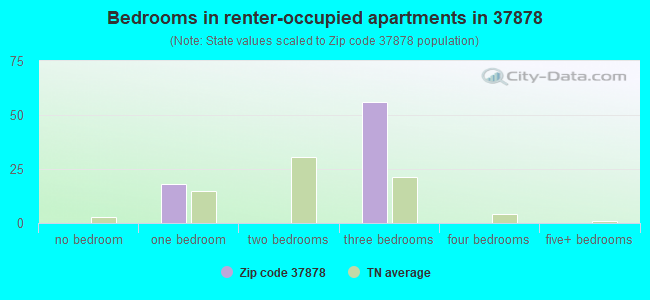
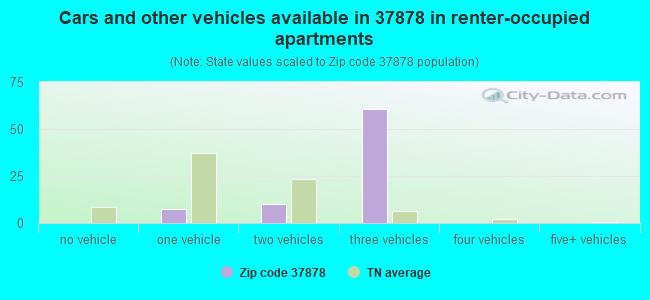
Houses and condos: 501 Renter-occupied apartments: 76
% of renters here:
25%
State:
33%
March 2022 cost of living index in zip code 37878: 79.9 (low, U.S. average is 100)
Land area: 37.8 sq. mi. Water area: 1.2 sq. mi.
Population density: 19 people per square mile
(very low).
OSM Map
General Map
Google Map
MSN Map
OSM Map
General Map
Google Map
MSN Map
OSM Map
General Map
Google Map
MSN Map
OSM Map
General Map
Google Map
MSN Map
Please wait while loading the map...
Real estate property taxes paid for housing units in 2022:
This zip code:
0.2% ($608)
Tennessee:
0.5% ($1,376)
Median real estate property taxes paid for housing units with mortgages in 2022: $202 (0.1%) Median real estate property taxes paid for housing units with no mortgage in 2022: $708 (0.3%)
Business Search- 14 Million verified businesses
Males: 364
(49.6%)
Females: 370
(50.4%)
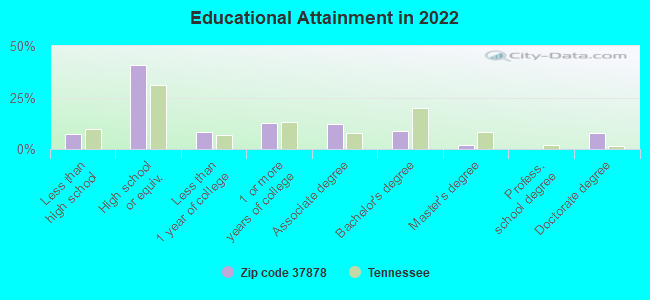
For population 25 years and over in 37878:
High school or higher: 92.5%
Bachelor's degree or higher: 18.8%
Graduate or professional degree: 9.9%
Mean travel time to work (commute): 36.5 minutes
For population 15 years and over in 37878:
Never married: 29.5%
Now married: 45.9%
Separated: 0.5%
Widowed: 2.6%
Divorced: 21.4%
Zip code 37878 compared to state average:
Unemployed percentage significantly below state average.
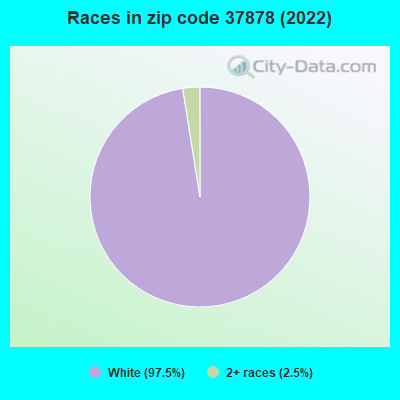
Black race population percentage significantly below state average.
Hispanic race population percentage significantly below state average.
Median age above state average.
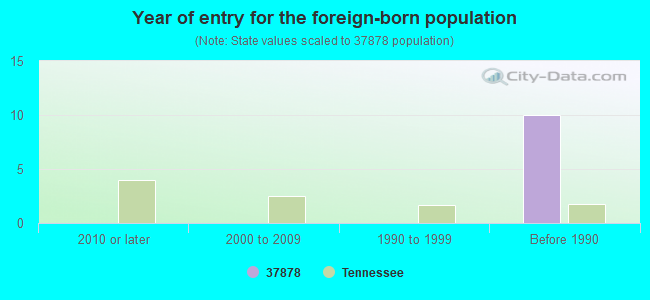
Foreign-born population percentage significantly below state average.
Length of stay since moving in below state average.
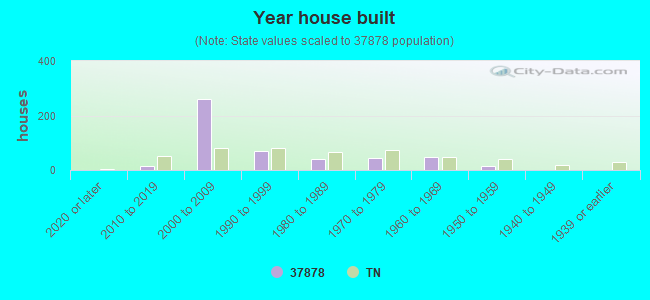
House age below state average.
Number of college students significantly below state average.
Percentage of population with a bachelor's degree or higher below state average.
Averages for the 2020 tax year for zip code 37878, filed in 2021:
Average Adjusted Gross Income (AGI) in 2020: $58,245 (Individual Income Tax Returns)
Here:
$58,245
State:
$69,014
Salary/wage: $44,300 (reported on 80.0% of returns)
Here:
$44,300
State:
$55,872
(% of AGI for various income ranges: 878.3% for AGIs below $25k, 2406.7% for AGIs $25k-50k, 4214.0% for AGIs $50k-75k)
Taxable interest for individuals: $400 (reported on 35.0% of returns)
This zip code:
$400
Tennessee:
$1,945
(% of AGI for various income ranges: 5.0% for AGIs below $25k, 50.0% for AGIs $50k-75k)
Ordinary dividends: $750 (reported on 10.0% of returns)
Here:
$750
State:
$8,105
(% of AGI for various income ranges: 25.0% for AGIs below $25k)
Profit/loss from business: +$4,133 (reported on 15.0% of returns)
Here:
+$4,133
State:
+$18,991
(% of AGI for various income ranges: 206.7% for AGIs below $25k)
Taxable individual retirement arrangement distribution: $28,600 (reported on 10.0% of returns)
37878:
$28,600
Tennessee:
$20,036
(% of AGI for various income ranges: 953.3% for AGIs below $25k)
Earned income credit: $2,125 (reported on 20.0% of returns)
Here:
$2,125
State:
$2,391
(% of AGI for various income ranges: 141.7% for AGIs below $25k)
Percentage of individuals using paid preparers for their 2020 taxes: 100.0%
Here:
100%
State:
93%
(% for various income ranges: 100.0% for AGIs below $25k, 100.0% for AGIs $25k-50k, 100.0% for AGIs $50k-75k, 100.0% for AGIs $100k-200k)
Averages for the 2012 tax year for zip code 37878, filed in 2013:
Average Adjusted Gross Income (AGI) in 2012: $37,058 (Individual Income Tax Returns)
Here:
$37,058
State:
$53,767
Salary/wage: $31,880 (reported on 78.9% of returns)
Here:
$31,880
State:
$45,421
(% of AGI for various income ranges: 67.7% for AGIs below $25k, 71.0% for AGIs $25k-50k, 147.5% for AGIs $50k-75k)
Taxable interest for individuals: $525 (reported on 21.1% of returns)
This zip code:
$525
Tennessee:
$1,732
Ordinary dividends: $550 (reported on 10.5% of returns)
Here:
$550
State:
$6,739
Profit/loss from business: +$4,300 (reported on 15.8% of returns)
Here:
+$4,300
State:
+$15,240
Taxable individual retirement arrangement distribution: $9,300 (reported on 10.5% of returns)
37878:
$9,300
Tennessee:
$15,505
Total itemized deductions: $20,967 (37% of AGI, reported on 15.8% of returns)
Here:
$20,967
State:
$21,976
Here:
37.1% of AGI
State:
17.8% of AGI
Charity contributions: $2,850 (reported on 10.5% of returns)
Here:
$2,850
State:
$6,709
Taxes paid: $2,467 (reported on 15.8% of returns)
37878:
$2,467
State:
$4,829
Earned income credit: $2,360 (reported on 26.3% of returns)
Here:
$2,360
State:
$2,404
(% of AGI for various income ranges: 9.7% for AGIs below $25k)
Percentage of individuals using paid preparers for their 2012 taxes: 52.6%
Here:
53%
State:
52%
(% for various income ranges: 44.4% for AGIs below $25k, 60.0% for AGIs $25k-50k, 100.0% for AGIs $50k-75k)
Averages for the 2004 tax year for zip code 37878, filed in 2005:
Average Adjusted Gross Income (AGI) in 2004: $26,445 (Individual Income Tax Returns)
Here:
$26,445
State:
$44,088
Salary/wage: $23,808 (reported on 78.9% of returns)
Here:
$23,808
State:
$38,825
(% of AGI for various income ranges: 58.8% for AGIs below $10k, 74.6% for AGIs $10k-25k, 81.8% for AGIs $25k-50k, 63.6% for AGIs $50k-75k, 58.0% for AGIs $75k-100k)
Taxable interest for individuals: $946 (reported on 25.7% of returns)
This zip code:
$946
Tennessee:
$1,802
(% of AGI for various income ranges: 7.1% for AGIs below $10k, 0.6% for AGIs $10k-25k, 0.2% for AGIs $25k-50k, 2.1% for AGIs $50k-75k)
Taxable dividends: $1,143 (reported on 9.6% of returns)
Here:
$1,143
State:
$3,727
Profit/loss from business: +$4,759 (reported on 13.3% of returns)
Here:
+$4,759
State:
+$12,882
Total itemized deductions: $13,071 (20% of AGI, reported on 6.4% of returns)
Here:
$13,071
State:
$18,035
Here:
20.1% of AGI
State:
19.9% of AGI
Total tax: $3,062 (reported on 67.0% of returns)
37878:
$3,062
State:
$7,482
(% of AGI for various income ranges: 2.0% for AGIs below $10k, 4.3% for AGIs $10k-25k, 6.3% for AGIs $25k-50k, 9.6% for AGIs $50k-75k, 13.3% for AGIs $75k-100k)
Earned income credit: $1,735 (reported on 22.5% of returns)
Here:
$1,735
State:
$1,826
Percentage of individuals using paid preparers for their 2004 taxes: 60.6%
Here:
61%
State:
60%
(% for various income ranges: 59.4% for AGIs below $10k, 60.6% for AGIs $10k-25k, 66.7% for AGIs $25k-50k, 87.5% for AGIs $50k-75k)
Household received Food Stamps/SNAP in the past 12 months: 87 Household did not receive Food Stamps/SNAP in the past 12 months: 212
Women who did not have a birth in the past 12 months: 236 (76 now married, 160 unmarried)
Housing units in zip code 37878 with a mortgage: 102 Median monthly owner costs for units with a mortgage: $1,279 Median monthly owner costs for units without a mortgage: $365
Residents with income below the poverty level in 2022:
This zip code:
9.4%
Whole state:
13.3%
Residents with income below 50% of the poverty level in 2022:
This zip code:
8.1%
Whole state:
7.1%
Median number of rooms in houses and condos:
Here:
5.2
State:
6.5
Median number of rooms in apartments:
Here:
4.7
State:
4.4
Notable locations in this zip code not listed on our city pages
Notable locations in zip code 37878: Top of the World Estates (A), Little Bottom Campsite (B), Cooper Road Campsite (C), Look Rock Camp and Trailer Park (D), Ace Gap Campsite (E), Beard Cane Campsite (F), Cane creek Campsite (G), Hesse Creek Campsite (H), Kelly Gap Campsite (I), Abrams Creek Campground (J), Scona Lodge Ferry (K). Display/hide their locations on the map
Churches in zip code 37878 include: Happy Valley Missionary Baptist Church (A), Chilhowee Primitive Baptist Church (B). Display/hide their locations on the map
Streams, rivers, and creeks: Law Branch (A), Kingfisher Creek (B), Abrams Creek (C), Johns Branch (D), Chilogatee Branch (E), Tabcat Creek (F), Cockspur Branch (G), Cane Creek (H), Buckshank Branch (I). Display/hide their locations on the map
Size of family households: 99 2-persons, 22 3-persons, 63 4-persons, 8 5-persons
Size of nonfamily households: 106 1-person
15 married couples with children.
57 single-parent households (57 women).
99.7% of residents of 37878 zip code speak English at home.
Foreign born population: 0 (0.0%)
:
0.0%
Whole state:
5.6%
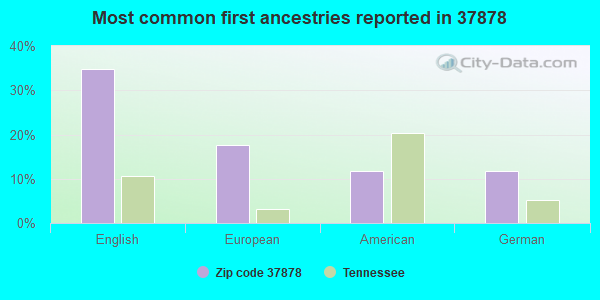
35%English
18%European
12%American
12%German
Year of entry for the foreign-born population
02010 or later
02000 to 2009
01990 to 1999
10Before 1990
Housing units lacking complete plumbing facilities: 4.7% Housing units lacking complete kitchen facilities: 4.7%
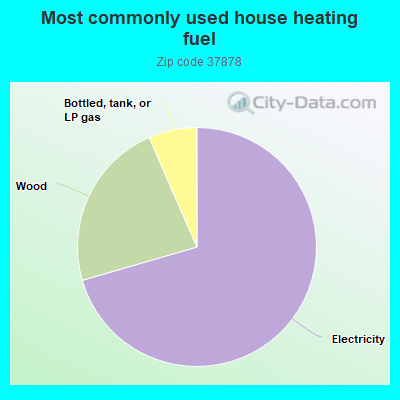
71.0%Electricity
23.1%Wood
6.6%Bottled, tank, or LP gas
Population in 1990: 376. Population change in the 1990s: +153 (+40.7%).
Place of birth for U.S.-born residents:
This state: 488
Northeast: 24
Midwest: 48
South: 154
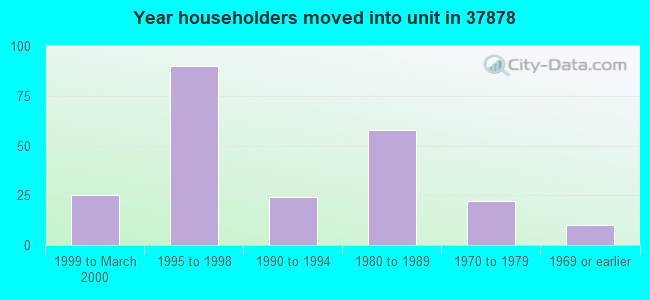
59% of the 37878 zip code residents lived in the same house 5 years ago. Out of people who lived in different houses, 41% lived in this county. Out of people who lived in different counties, 50% lived in Tennessee.
95% of the 37878 zip code residents lived in the same house 1 year ago. Out of people who lived in different houses, 19% moved from different county within same state. Out of people who lived in different houses, 96% moved from different state.
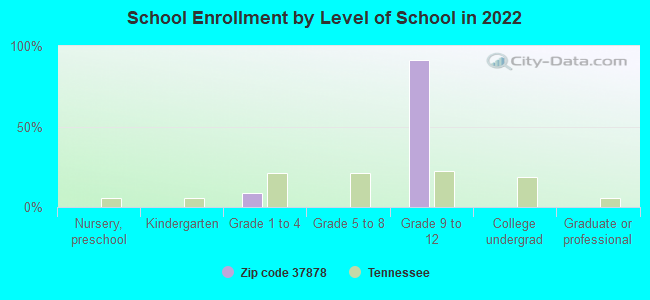
Private vs. public school enrollment:
Students in private schools in grades 1 to 8 (elementary and middle school): 9
Here:
100.0%
Tennessee:
15.0%
Students in private schools in grades 9 to 12 (high school):
Here:
0.0%
Tennessee:
16.2%
Top industries in this zip code by the number of employees in 2005:
Administrative and Support and Waste Management and Remediation Services: Landscaping Services (1-4 employees: 1 establishment)
Other Services (except Public Administration): Environment, Conservation and Wildlife Organizations (1-4: 1)
Other Services (except Public Administration): Religious Organizations (1-4: 1)
Fatal accident statistics in 2014:
Fatal accident count: 1
Vehicles involved in fatal accidents: 2
Fatal accidents caused by drunken drivers: 0
Fatalities: 1
Persons involved in fatal accidents: 2
Pedestrians involved in fatal accidents: 0
Fatal accident statistics in 2013:
Fatal accident count: 1
Vehicles involved in fatal accidents: 1
Fatal accidents caused by drunken drivers: 0
Fatalities: 1
Persons involved in fatal accidents: 2
Pedestrians involved in fatal accidents: 0
Home Mortgage Disclosure Act Aggregated Statistics For Year 2009 (Based on 2 partial tracts)
A) FHA, FSA/RHS & VA Home Purchase Loans
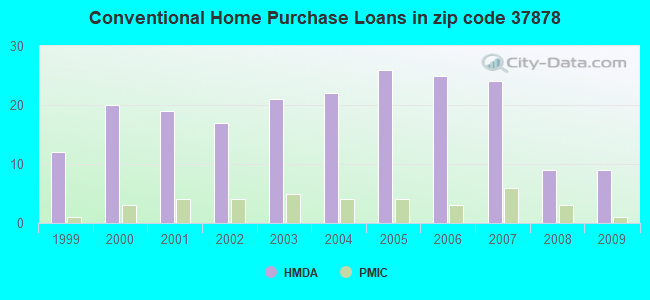
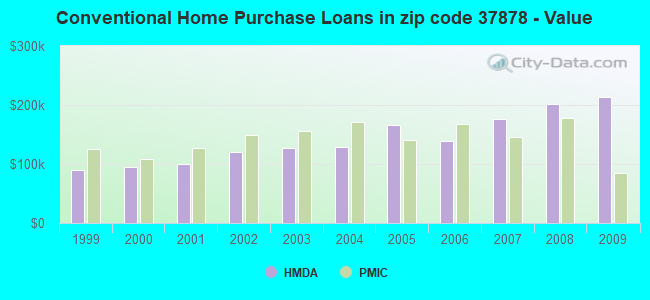
B) Conventional Home Purchase Loans
C) Refinancings
D) Home Improvement Loans
F) Non-occupant Loans on < 5 Family Dwellings (A B C & D)
G) Loans On Manufactured Home Dwelling (A B C & D)
Number
Average Value
Number
Average Value
Number
Average Value
Number
Average Value
Number
Average Value
Number
Average Value
LOANS ORIGINATED
2
$138,545
9
$212,824
40
$197,523
2
$131,490
12
$219,502
1
$102,370
APPLICATIONS APPROVED, NOT ACCEPTED
0
$0
0
$0
2
$246,065
0
$0
0
$0
0
$0
APPLICATIONS DENIED
2
$112,450
2
$281,680
10
$145,533
2
$67,200
2
$360,305
2
$54,655
APPLICATIONS WITHDRAWN
0
$0
1
$70,560
6
$164,155
0
$0
0
$0
0
$0
FILES CLOSED FOR INCOMPLETENESS
0
$0
0
$0
2
$135,520
0
$0
0
$0
0
$0
Aggregated Statistics For Year 2008 (Based on 2 partial tracts)
A) FHA, FSA/RHS & VA Home Purchase Loans
B) Conventional Home Purchase Loans
C) Refinancings
D) Home Improvement Loans
F) Non-occupant Loans on < 5 Family Dwellings (A B C & D)
G) Loans On Manufactured Home Dwelling (A B C & D)
Number
Average Value
Number
Average Value
Number
Average Value
Number
Average Value
Number
Average Value
Number
Average Value
LOANS ORIGINATED
1
$122,080
9
$201,949
27
$185,605
4
$82,208
11
$244,628
3
$73,173
APPLICATIONS APPROVED, NOT ACCEPTED
0
$0
1
$277,310
3
$200,553
0
$0
1
$295,230
0
$0
APPLICATIONS DENIED
0
$0
2
$149,630
8
$155,792
2
$61,600
2
$253,455
1
$70,560
APPLICATIONS WITHDRAWN
0
$0
1
$288,290
6
$153,925
0
$0
1
$312,930
0
$0
FILES CLOSED FOR INCOMPLETENESS
0
$0
0
$0
1
$203,390
0
$0
0
$0
0
$0
Aggregated Statistics For Year 2007 (Based on 2 partial tracts)
B) Conventional Home Purchase Loans
C) Refinancings
D) Home Improvement Loans
F) Non-occupant Loans on < 5 Family Dwellings (A B C & D)
G) Loans On Manufactured Home Dwelling (A B C & D)
Number
Average Value
Number
Average Value
Number
Average Value
Number
Average Value
Number
Average Value
LOANS ORIGINATED
24
$176,820
28
$158,968
4
$81,255
17
$206,344
4
$77,335
APPLICATIONS APPROVED, NOT ACCEPTED
3
$102,967
4
$135,912
0
$0
2
$160,495
2
$58,800
APPLICATIONS DENIED
6
$139,738
15
$166,133
3
$168,523
4
$150,920
2
$150,080
APPLICATIONS WITHDRAWN
1
$170,240
6
$192,043
1
$141,120
1
$178,530
1
$59,140
FILES CLOSED FOR INCOMPLETENESS
2
$77,170
3
$155,903
0
$0
1
$120,510
0
$0
Aggregated Statistics For Year 2006 (Based on 2 partial tracts)
B) Conventional Home Purchase Loans
C) Refinancings
D) Home Improvement Loans
F) Non-occupant Loans on < 5 Family Dwellings (A B C & D)
G) Loans On Manufactured Home Dwelling (A B C & D)
Number
Average Value
Number
Average Value
Number
Average Value
Number
Average Value
Number
Average Value
LOANS ORIGINATED
25
$138,629
29
$139,969
3
$61,377
22
$159,559
5
$62,182
APPLICATIONS APPROVED, NOT ACCEPTED
6
$93,743
6
$183,717
0
$0
5
$162,310
3
$58,763
APPLICATIONS DENIED
11
$97,277
15
$113,433
2
$87,250
5
$100,890
6
$49,990
APPLICATIONS WITHDRAWN
2
$198,130
8
$144,368
1
$155,010
2
$121,185
0
$0
FILES CLOSED FOR INCOMPLETENESS
1
$64,740
2
$70,225
0
$0
0
$0
0
$0
Aggregated Statistics For Year 2005 (Based on 2 partial tracts)
A) FHA, FSA/RHS & VA Home Purchase Loans
B) Conventional Home Purchase Loans
C) Refinancings
D) Home Improvement Loans
F) Non-occupant Loans on < 5 Family Dwellings (A B C & D)
G) Loans On Manufactured Home Dwelling (A B C & D)
Number
Average Value
Number
Average Value
Number
Average Value
Number
Average Value
Number
Average Value
Number
Average Value
LOANS ORIGINATED
0
$0
26
$166,398
28
$132,192
4
$94,025
16
$172,158
4
$41,215
APPLICATIONS APPROVED, NOT ACCEPTED
1
$49,950
5
$122,976
4
$110,265
0
$0
2
$135,630
3
$52,790
APPLICATIONS DENIED
0
$0
11
$108,111
22
$104,832
3
$35,540
5
$164,820
8
$54,124
APPLICATIONS WITHDRAWN
0
$0
4
$109,200
13
$129,162
1
$20,830
1
$167,100
2
$55,105
FILES CLOSED FOR INCOMPLETENESS
0
$0
0
$0
3
$141,343
0
$0
0
$0
0
$0
Aggregated Statistics For Year 2004 (Based on 2 partial tracts)
B) Conventional Home Purchase Loans
C) Refinancings
D) Home Improvement Loans
F) Non-occupant Loans on < 5 Family Dwellings (A B C & D)
G) Loans On Manufactured Home Dwelling (A B C & D)
Number
Average Value
Number
Average Value
Number
Average Value
Number
Average Value
Number
Average Value
LOANS ORIGINATED
22
$128,515
32
$134,477
6
$34,645
16
$125,412
5
$52,148
APPLICATIONS APPROVED, NOT ACCEPTED
6
$78,737
7
$109,409
0
$0
2
$97,215
4
$51,912
APPLICATIONS DENIED
9
$69,913
18
$117,114
2
$63,730
2
$111,215
8
$51,520
APPLICATIONS WITHDRAWN
2
$262,640
15
$104,324
1
$68,540
1
$161,730
2
$51,630
FILES CLOSED FOR INCOMPLETENESS
0
$0
2
$217,615
0
$0
1
$161,730
0
$0
Aggregated Statistics For Year 2003 (Based on 2 partial tracts)
B) Conventional Home Purchase Loans
C) Refinancings
D) Home Improvement Loans
F) Non-occupant Loans on < 5 Family Dwellings (A B C & D)
Number
Average Value
Number
Average Value
Number
Average Value
Number
Average Value
LOANS ORIGINATED
21
$126,400
58
$121,821
3
$41,590
24
$130,769
APPLICATIONS APPROVED, NOT ACCEPTED
3
$115,957
8
$103,880
0
$0
2
$132,830
APPLICATIONS DENIED
7
$104,064
21
$108,459
1
$49,280
3
$119,840
APPLICATIONS WITHDRAWN
2
$102,590
8
$110,740
0
$0
2
$77,170
FILES CLOSED FOR INCOMPLETENESS
0
$0
1
$121,180
0
$0
0
$0
Aggregated Statistics For Year 2002 (Based on 2 partial tracts)
A) FHA, FSA/RHS & VA Home Purchase Loans
B) Conventional Home Purchase Loans
C) Refinancings
D) Home Improvement Loans
F) Non-occupant Loans on < 5 Family Dwellings (A B C & D)
Number
Average Value
Number
Average Value
Number
Average Value
Number
Average Value
Number
Average Value
LOANS ORIGINATED
1
$80,420
17
$120,116
38
$126,012
4
$25,312
14
$138,704
APPLICATIONS APPROVED, NOT ACCEPTED
0
$0
3
$78,027
6
$145,450
0
$0
1
$414,620
APPLICATIONS DENIED
1
$39,870
7
$88,000
17
$80,574
2
$8,850
3
$80,490
APPLICATIONS WITHDRAWN
0
$0
2
$234,865
4
$97,888
0
$0
1
$166,210
FILES CLOSED FOR INCOMPLETENESS
0
$0
0
$0
1
$141,120
0
$0
0
$0
Aggregated Statistics For Year 2001 (Based on 2 partial tracts)
A) FHA, FSA/RHS & VA Home Purchase Loans
B) Conventional Home Purchase Loans
C) Refinancings
D) Home Improvement Loans
F) Non-occupant Loans on < 5 Family Dwellings (A B C & D)
Number
Average Value
Number
Average Value
Number
Average Value
Number
Average Value
Number
Average Value
LOANS ORIGINATED
2
$64,960
19
$100,187
38
$109,866
3
$23,147
11
$139,328
APPLICATIONS APPROVED, NOT ACCEPTED
0
$0
5
$38,976
7
$120,224
1
$13,220
2
$70,335
APPLICATIONS DENIED
1
$107,970
13
$49,280
19
$78,094
3
$20,607
0
$0
APPLICATIONS WITHDRAWN
0
$0
2
$86,350
6
$97,590
0
$0
0
$0
FILES CLOSED FOR INCOMPLETENESS
0
$0
1
$87,580
1
$74,370
0
$0
1
$81,980
Aggregated Statistics For Year 2000 (Based on 2 partial tracts)
A) FHA, FSA/RHS & VA Home Purchase Loans
B) Conventional Home Purchase Loans
C) Refinancings
D) Home Improvement Loans
F) Non-occupant Loans on < 5 Family Dwellings (A B C & D)
Number
Average Value
Number
Average Value
Number
Average Value
Number
Average Value
Number
Average Value
LOANS ORIGINATED
2
$62,610
20
$95,480
18
$86,887
3
$13,887
6
$134,810
APPLICATIONS APPROVED, NOT ACCEPTED
1
$13,440
6
$62,720
4
$63,448
1
$8,290
1
$117,600
APPLICATIONS DENIED
2
$39,870
22
$49,575
9
$64,711
3
$24,940
2
$59,470
APPLICATIONS WITHDRAWN
0
$0
2
$67,090
8
$66,864
1
$36,960
0
$0
FILES CLOSED FOR INCOMPLETENESS
0
$0
1
$137,540
1
$54,210
0
$0
0
$0
Aggregated Statistics For Year 1999 (Based on 1 partial tract)
B) Conventional Home Purchase Loans
C) Refinancings
D) Home Improvement Loans
F) Non-occupant Loans on < 5 Family Dwellings (A B C & D)

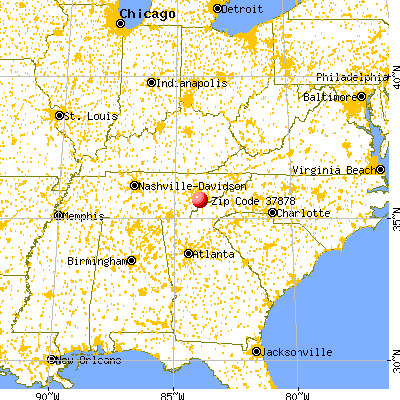


 Nearest zip codes: 37882, 37803, 37886, 37804, 37701, 37801.