Estimated zip code population in 2022: 11,000 Zip code population in 2010: 10,941 Zip code population in 2000: 9,895
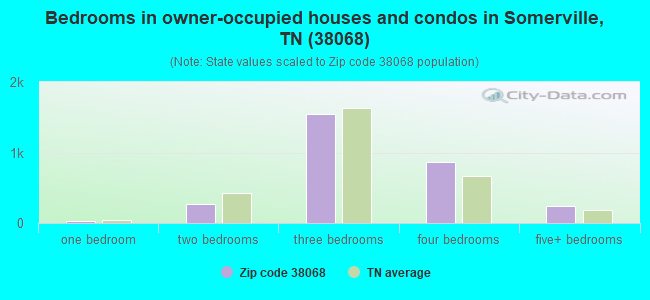
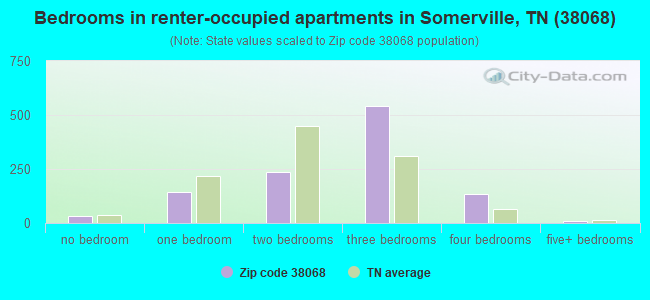
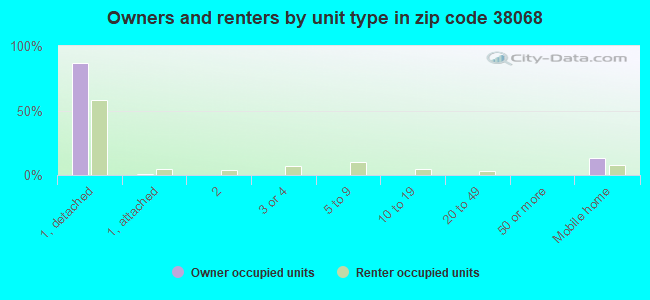
Houses and condos: 4,465 Renter-occupied apartments: 1,100
% of renters here:
27%
State:
33%
March 2022 cost of living index in zip code 38068: 80.1 (low, U.S. average is 100)
Land area: 270.4 sq. mi. Water area: 0.4 sq. mi.
Population density: 41 people per square mile
(very low).
OSM Map
General Map
Google Map
MSN Map
OSM Map
General Map
Google Map
MSN Map
OSM Map
General Map
Google Map
MSN Map
OSM Map
General Map
Google Map
MSN Map
Please wait while loading the map...
Real estate property taxes paid for housing units in 2022:
This zip code:
0.3% ($805)
Tennessee:
0.5% ($1,376)
Median real estate property taxes paid for housing units with mortgages in 2022: $1,057 (0.3%) Median real estate property taxes paid for housing units with no mortgage in 2022: $433 (0.2%)
Estimated median house/condo value in 2022: $281,978
38068:
$281,978
Tennessee:
$284,800
According to our research of Tennessee and other state lists, there were 28 registered sex offenders living in 38068 zip code as of April 24, 2024. The ratio of all residents to sex offenders in zip code 38068 is 353 to 1. The ratio of registered sex offenders to all residents in this zip code is near the state average.
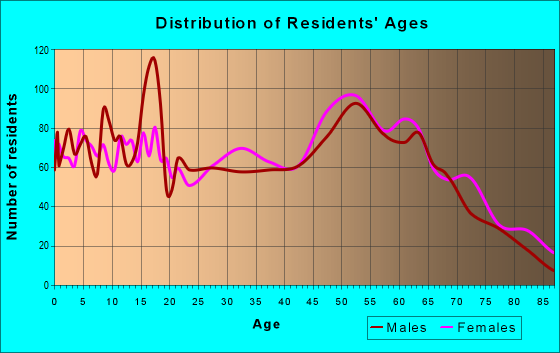
Median resident age:
This zip code:
42.0 years
Tennessee median age:
39.2 years
Average household size:
This zip code:
2.6 people
Tennessee:
2.4 people
Averages for the 2020 tax year for zip code 38068, filed in 2021:
Average Adjusted Gross Income (AGI) in 2020: $59,861 (Individual Income Tax Returns)
Here:
$59,861
State:
$69,014
Salary/wage: $51,677 (reported on 81.6% of returns)
Here:
$51,677
State:
$55,872
(% of AGI for various income ranges: 1298.0% for AGIs below $25k, 3627.9% for AGIs $25k-50k, 6273.4% for AGIs $50k-75k, 9638.9% for AGIs $75k-100k, 18125.0% for AGIs $100k-200k, 96900.0% for AGIs over 200k)
Taxable interest for individuals: $1,366 (reported on 23.8% of returns)
This zip code:
$1,366
Tennessee:
$1,945
(% of AGI for various income ranges: 10.1% for AGIs below $25k, 16.2% for AGIs $25k-50k, 44.0% for AGIs $50k-75k, 72.6% for AGIs $75k-100k, 124.1% for AGIs $100k-200k, 1252.5% for AGIs over 200k)
Ordinary dividends: $4,733 (reported on 11.0% of returns)
Here:
$4,733
State:
$8,105
(% of AGI for various income ranges: 8.4% for AGIs below $25k, 19.3% for AGIs $25k-50k, 36.0% for AGIs $50k-75k, 91.5% for AGIs $75k-100k, 228.4% for AGIs $100k-200k, 2810.0% for AGIs over 200k)
Net capital gain/loss in AGI: +$25,106 (reported on 10.4% of returns)
Here:
+$25,106
State:
+$33,664
(% of AGI for various income ranges: 8.9% for AGIs below $25k, 9.7% for AGIs $25k-50k, 108.7% for AGIs $50k-75k, 228.1% for AGIs $75k-100k, 519.4% for AGIs $100k-200k, 25072.5% for AGIs over 200k)
Profit/loss from business: +$9,631 (reported on 21.0% of returns)
Here:
+$9,631
State:
+$18,991
(% of AGI for various income ranges: 64.8% for AGIs below $25k, 63.5% for AGIs $25k-50k, 140.0% for AGIs $50k-75k, 388.5% for AGIs $75k-100k, 1007.8% for AGIs $100k-200k, 8822.5% for AGIs over 200k)
Taxable individual retirement arrangement distribution: $16,026 (reported on 7.0% of returns)
38068:
$16,026
Tennessee:
$20,036
(% of AGI for various income ranges: 31.3% for AGIs below $25k, 61.3% for AGIs $25k-50k, 180.0% for AGIs $50k-75k, 274.4% for AGIs $75k-100k, 533.4% for AGIs $100k-200k, 2982.5% for AGIs over 200k)
Total itemized deductions: $37,324 (reported on 5.8% of returns)
Here:
$37,324
State:
$40,136
(% of AGI for various income ranges: 158.6% for AGIs $25k-50k, 306.0% for AGIs $50k-75k, 395.2% for AGIs $75k-100k, 780.0% for AGIs $100k-200k, 10355.0% for AGIs over 200k)
Charity contributions: $20,867 (reported on 4.8% of returns)
Here:
$20,867
State:
$19,852
(% of AGI for various income ranges: 39.1% for AGIs $25k-50k, 81.7% for AGIs $50k-75k, 160.7% for AGIs $75k-100k, 352.2% for AGIs $100k-200k, 6622.5% for AGIs over 200k)
Taxes paid: $4,392 (reported on 5.2% of returns)
38068:
$4,392
State:
$6,038
(% of AGI for various income ranges: 10.8% for AGIs $25k-50k, 34.7% for AGIs $50k-75k, 59.6% for AGIs $75k-100k, 104.7% for AGIs $100k-200k, 920.0% for AGIs over 200k)
Earned income credit: $2,493 (reported on 23.4% of returns)
Here:
$2,493
State:
$2,391
(% of AGI for various income ranges: 138.3% for AGIs below $25k, 78.2% for AGIs $25k-50k)
Percentage of individuals using paid preparers for their 2020 taxes: 92.0%
Here:
92%
State:
93%
(% for various income ranges: 91.5% for AGIs below $25k, 93.1% for AGIs $25k-50k, 92.3% for AGIs $50k-75k, 90.2% for AGIs $75k-100k, 93.1% for AGIs $100k-200k, 86.7% for AGIs over 200k)
Averages for the 2012 tax year for zip code 38068, filed in 2013:
Average Adjusted Gross Income (AGI) in 2012: $46,076 (Individual Income Tax Returns)
Here:
$46,076
State:
$53,767
Salary/wage: $39,495 (reported on 82.8% of returns)
Here:
$39,495
State:
$45,421
(% of AGI for various income ranges: 75.9% for AGIs below $25k, 80.1% for AGIs $25k-50k, 77.8% for AGIs $50k-75k, 72.4% for AGIs $75k-100k, 67.2% for AGIs $100k-200k, 52.4% for AGIs over 200k)
Taxable interest for individuals: $1,464 (reported on 25.4% of returns)
This zip code:
$1,464
Tennessee:
$1,732
(% of AGI for various income ranges: 0.8% for AGIs below $25k, 0.7% for AGIs $25k-50k, 0.5% for AGIs $50k-75k, 1.1% for AGIs $75k-100k, 0.7% for AGIs $100k-200k, 1.1% for AGIs over 200k)
Ordinary dividends: $2,884 (reported on 11.0% of returns)
Here:
$2,884
State:
$6,739
(% of AGI for various income ranges: 0.7% for AGIs below $25k, 0.4% for AGIs $25k-50k, 0.3% for AGIs $50k-75k, 0.7% for AGIs $75k-100k, 0.8% for AGIs $100k-200k, 1.3% for AGIs over 200k)
Net capital gain/loss in AGI: +$6,622 (reported on 8.6% of returns)
Here:
+$6,622
State:
+$19,082
(% of AGI for various income ranges: 0.6% for AGIs $25k-50k, 0.3% for AGIs $50k-75k, 1.0% for AGIs $75k-100k, 1.8% for AGIs $100k-200k, 3.5% for AGIs over 200k)
Profit/loss from business: +$12,839 (reported on 19.4% of returns)
Here:
+$12,839
State:
+$15,240
(% of AGI for various income ranges: 10.7% for AGIs below $25k, 2.3% for AGIs $25k-50k, 2.7% for AGIs $50k-75k, 4.3% for AGIs $75k-100k, 6.2% for AGIs $100k-200k, 7.3% for AGIs over 200k)
Taxable individual retirement arrangement distribution: $13,147 (reported on 7.7% of returns)
38068:
$13,147
Tennessee:
$15,505
(% of AGI for various income ranges: 1.8% for AGIs below $25k, 1.6% for AGIs $25k-50k, 2.7% for AGIs $50k-75k, 2.5% for AGIs $75k-100k, 4.0% for AGIs $100k-200k)
Total itemized deductions: $19,429 (21% of AGI, reported on 22.6% of returns)
Here:
$19,429
State:
$21,976
Here:
20.8% of AGI
State:
17.8% of AGI
(% of AGI for various income ranges: 7.1% for AGIs below $25k, 8.8% for AGIs $25k-50k, 10.9% for AGIs $50k-75k, 11.7% for AGIs $75k-100k, 11.3% for AGIs $100k-200k, 6.5% for AGIs over 200k)
Charity contributions: $5,844 (reported on 18.9% of returns)
Here:
$5,844
State:
$6,709
(% of AGI for various income ranges: 0.9% for AGIs below $25k, 1.9% for AGIs $25k-50k, 2.2% for AGIs $50k-75k, 3.1% for AGIs $75k-100k, 3.2% for AGIs $100k-200k, 2.7% for AGIs over 200k)
Taxes paid: $3,156 (reported on 22.2% of returns)
38068:
$3,156
State:
$4,829
(% of AGI for various income ranges: 0.7% for AGIs below $25k, 1.1% for AGIs $25k-50k, 1.6% for AGIs $50k-75k, 1.9% for AGIs $75k-100k, 2.0% for AGIs $100k-200k, 1.6% for AGIs over 200k)
Earned income credit: $2,687 (reported on 30.3% of returns)
Here:
$2,687
State:
$2,404
(% of AGI for various income ranges: 11.4% for AGIs below $25k, 1.4% for AGIs $25k-50k)
Percentage of individuals using paid preparers for their 2012 taxes: 56.3%
Here:
56%
State:
52%
(% for various income ranges: 54.4% for AGIs below $25k, 55.3% for AGIs $25k-50k, 54.4% for AGIs $50k-75k, 60.0% for AGIs $75k-100k, 63.9% for AGIs $100k-200k, 87.5% for AGIs over 200k)
Averages for the 2004 tax year for zip code 38068, filed in 2005:
Average Adjusted Gross Income (AGI) in 2004: $37,319 (Individual Income Tax Returns)
Here:
$37,319
State:
$44,088
Salary/wage: $33,593 (reported on 85.8% of returns)
Here:
$33,593
State:
$38,825
(% of AGI for various income ranges: 122.8% for AGIs below $10k, 83.1% for AGIs $10k-25k, 86.9% for AGIs $25k-50k, 80.4% for AGIs $50k-75k, 72.5% for AGIs $75k-100k, 61.9% for AGIs over 100k)
Taxable interest for individuals: $1,930 (reported on 29.3% of returns)
This zip code:
$1,930
Tennessee:
$1,802
(% of AGI for various income ranges: 4.8% for AGIs below $10k, 1.7% for AGIs $10k-25k, 1.1% for AGIs $25k-50k, 0.9% for AGIs $50k-75k, 1.6% for AGIs $75k-100k, 2.0% for AGIs over 100k)
Taxable dividends: $2,362 (reported on 10.0% of returns)
Here:
$2,362
State:
$3,727
(% of AGI for various income ranges: 1.5% for AGIs below $10k, 0.3% for AGIs $10k-25k, 0.1% for AGIs $25k-50k, 0.2% for AGIs $50k-75k, 1.3% for AGIs $75k-100k, 1.2% for AGIs over 100k)
Net capital gain/loss: +$15,164 (reported on 10.2% of returns)
Here:
+$15,164
State:
+$15,776
(% of AGI for various income ranges: 0.5% for AGIs below $10k, 0.5% for AGIs $10k-25k, 0.8% for AGIs $25k-50k, 0.9% for AGIs $50k-75k, 3.5% for AGIs $75k-100k, 12.2% for AGIs over 100k)
Profit/loss from business: +$13,345 (reported on 15.3% of returns)
Here:
+$13,345
State:
+$12,882
(% of AGI for various income ranges: -9.1% for AGIs below $10k, 5.5% for AGIs $10k-25k, 3.6% for AGIs $25k-50k, 5.2% for AGIs $50k-75k, 6.3% for AGIs $75k-100k, 8.0% for AGIs over 100k)
IRA payment deduction: $3,506 (reported on 2.0% of returns)
38068:
$3,506
Tennessee:
$2,934
(% of AGI for various income ranges: 0.1% for AGIs $10k-25k, 0.2% for AGIs $25k-50k, 0.3% for AGIs $50k-75k, 0.3% for AGIs $75k-100k, 0.1% for AGIs over 100k)
Self-employed pension: $21,278 (reported on 0.4% of returns)
Here:
$21,278
Tennessee:
$16,857
Total itemized deductions: $16,524 (22% of AGI, reported on 22.5% of returns)
Here:
$16,524
State:
$18,035
Here:
22.2% of AGI
State:
19.9% of AGI
(% of AGI for various income ranges: 11.6% for AGIs below $10k, 5.9% for AGIs $10k-25k, 10.2% for AGIs $25k-50k, 11.7% for AGIs $50k-75k, 12.4% for AGIs $75k-100k, 9.5% for AGIs over 100k)
Charity contributions deductions: $4,694 (6% of AGI, reported on 19.3% of returns)
Here:
$4,694
State:
$5,167
Here:
6.0% of AGI
State:
5.3% of AGI
(% of AGI for various income ranges: 0.3% for AGIs below $10k, 1.0% for AGIs $10k-25k, 2.3% for AGIs $25k-50k, 2.6% for AGIs $50k-75k, 2.9% for AGIs $75k-100k, 3.1% for AGIs over 100k)
Total tax: $5,818 (reported on 68.2% of returns)
38068:
$5,818
State:
$7,482
(% of AGI for various income ranges: 4.0% for AGIs below $10k, 3.3% for AGIs $10k-25k, 6.2% for AGIs $25k-50k, 9.5% for AGIs $50k-75k, 11.8% for AGIs $75k-100k, 19.5% for AGIs over 100k)
Earned income credit: $1,905 (reported on 29.1% of returns)
Here:
$1,905
State:
$1,826
Percentage of individuals using paid preparers for their 2004 taxes: 64.6%
Here:
65%
State:
60%
(% for various income ranges: 61.3% for AGIs below $10k, 69.0% for AGIs $10k-25k, 59.2% for AGIs $25k-50k, 65.4% for AGIs $50k-75k, 69.0% for AGIs $75k-100k, 71.5% for AGIs over 100k)
Likely homosexual households (counted as self-reported same-sex unmarried-partner households)
Lesbian couples: 0.0% of all households
Gay men: 0.0% of all households
Household received Food Stamps/SNAP in the past 12 months: 677 Household did not receive Food Stamps/SNAP in the past 12 months: 3,358
Women who had a birth in the past 12 months: 158 (67 now married, 88 unmarried) Women who did not have a birth in the past 12 months: 1,989 (975 now married, 1,014 unmarried)
Housing units in zip code 38068 with a mortgage: 1,762 (141 second mortgage, 4 home equity loan, 74 both second mortgage and home equity loan) Houses without a mortgage: 71
Median monthly owner costs for units with a mortgage: $1,307 Median monthly owner costs for units without a mortgage: $442
Residents with income below the poverty level in 2022:
This zip code:
14.8%
Whole state:
13.3%
Residents with income below 50% of the poverty level in 2022:
This zip code:
9.8%
Whole state:
7.1%
Median number of rooms in houses and condos:
Here:
7.1
State:
6.5
Median number of rooms in apartments:
Here:
5.1
State:
4.4
Notable locations in this zip code not listed on our city pages
Notable locations in zip code 38068: Joyners Campground (A), Taylor Chapel (B), Fayette County Landfill (C), Somerville Fire Department (D), Fayette County Fire Department District 15 Station 2 (E), Northeast Fayette County Fire (F), Fayette County Courthouse (G), Williston City Hall (H), North Fayette County Volunteer Fire Department (I), Williston Volunteer Fire Department (J), Fayette County Ambulance Service (K). Display/hide their locations on the map
Churches in zip code 38068 include: Feathers Chapel (A), Smith Chapel (B), Smyrna Church (C), Spring Hill Church (D), Rehobeth Church (E), Rhea Chapel (F), Carter Chapel (G), Clover Garden Church (H), Stuart Chapel (I). Display/hide their locations on the map
Cemeteries: Taylor Cemetery (1), Hutchins Cemetery (2), Trainer Cemetery (3), Jones Cemetery (4), Watkins Cemetery (5), Whitetaker Cemetery (6), Williamson Cemetery (7). Display/hide their locations on the map
Reservoirs and swamps: Lake Rooney (A), Glengary Lake (B), Bear Creek Watershed Lake Number One (C), Wells Land Company Lake (D), Winfrey Lake (E), Duncan Lake (F), Marsh Lake (G), Terra Alta Lake (H). Display/hide their locations on the map
Streams, rivers, and creeks: Howell Creek (A), Jones Creek (B), Lipsky Creek (C), Catron Creek (D), Kings Creek (E), Town Branch (F), Town Creek (G), Bluff Creek (H), Black Creek (I). Display/hide their locations on the map
In group quarters: 397 (-1 institutionalized population)
Size of family households: 1,550 2-persons, 606 3-persons, 495 4-persons, 300 5-persons, 62 6-persons, 53 7-or-more-persons
Size of nonfamily households: 822 1-person, 138 2-persons, 16 3-persons
1,154 married couples with children.
961 single-parent households (351 men, 610 women).
99.2% of residents of 38068 zip code speak English at home.
0.4% of residents speak Spanish at home (80% very well, 20% well).
0.2% of residents speak other Indo-European language at home (100% very well).
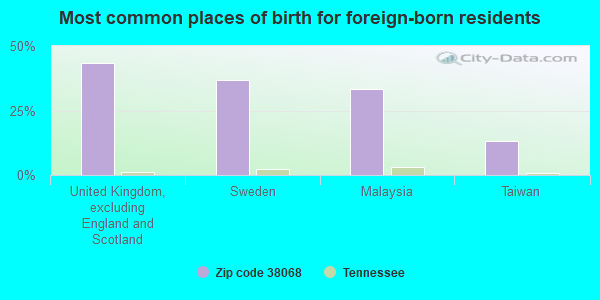
Foreign born population: 30 (0.3%) (61.7% of them are naturalized citizens)
This zip code:
0.3%
Whole state:
5.6%
43%United Kingdom, excluding England and Scotland
37%Sweden
33%Malaysia
13%Taiwan
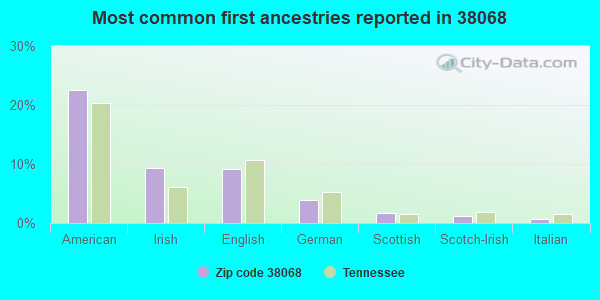
23%American
9%Irish
9%English
4%German
2%Scottish
1%Scotch-Irish
1%Italian
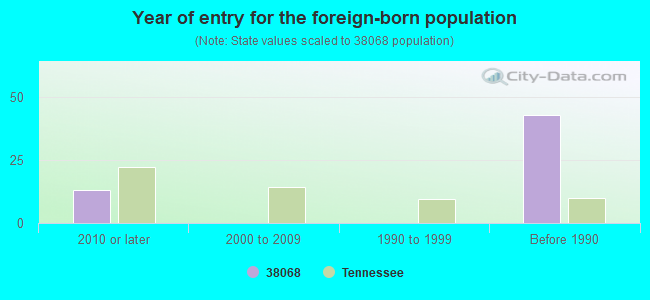
Year of entry for the foreign-born population
132010 or later
02000 to 2009
01990 to 1999
43Before 1990
Facilities with environmental interests located in this zip code:
CENTRAL ELEMENTARY SCHOOL (10425 HWY 76 in SOMERVILLE, TN)
(National Center for Education Statistics) - STATE ID-0015 Organizations: FAYETTE COUNTY SCHOOL DISTRICT (SCHOOL DISTRICT)
DOWDY PARKS LLC (UNKNOWN in SOMERVILLE, TN)
ENFORCEMENT/COMPLIANCE ACTIVITY (Integrated Compliance Information System)
Housing units lacking complete plumbing facilities: 0.5% Housing units lacking complete kitchen facilities: 0.5%
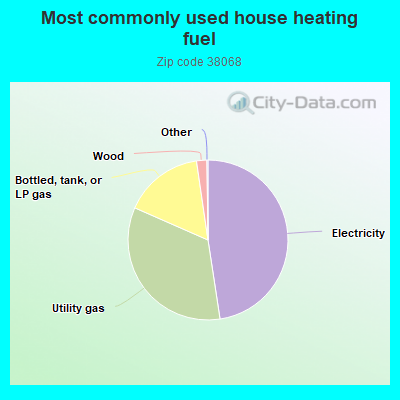
47.6%Electricity
34.0%Utility gas
16.1%Bottled, tank, or LP gas
2.1%Wood
Population in 1990: 11,757.
Place of birth for U.S.-born residents:
This state: 8,404
Northeast: 237
Midwest: 453
South: 1,617
West: 111
64% of the 38068 zip code residents lived in the same house 5 years ago. Out of people who lived in different houses, 47% lived in this county. Out of people who lived in different counties, 50% lived in Tennessee.
91% of the 38068 zip code residents lived in the same house 1 year ago. Out of people who lived in different houses, 38% moved from this county. Out of people who lived in different houses, 47% moved from different county within same state. Out of people who lived in different houses, 17% moved from different state.
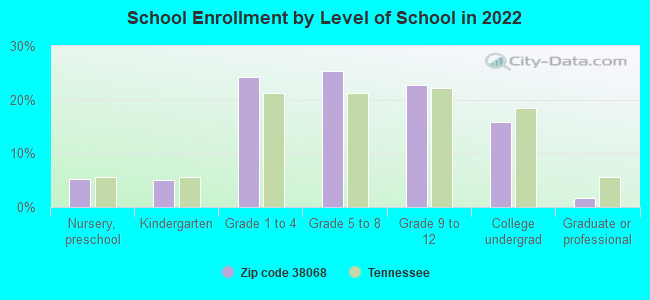
Private vs. public school enrollment:
Students in private schools in grades 1 to 8 (elementary and middle school): 408
Here:
33.3%
Tennessee:
15.0%
Students in private schools in grades 9 to 12 (high school): 219
Here:
39.3%
Tennessee:
16.2%
Students in private undergraduate colleges: 111
Here:
29.4%
Tennessee:
23.5%
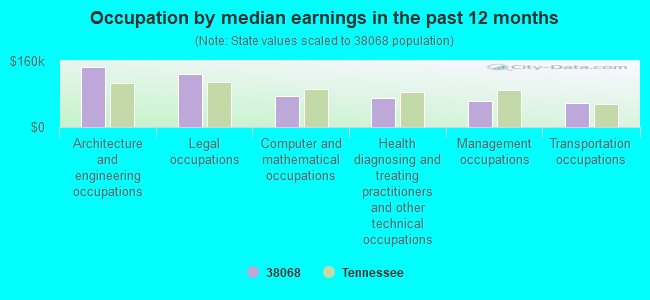
Occupation by median earnings in the past 12 months ($)
144,353Architecture and engineering occupations
128,299Legal occupations
74,581Computer and mathematical occupations
69,542Health diagnosing and treating practitioners and other technical occupations
63,736Management occupations
58,407Transportation occupations
Companies with federal contracts located in this zip code:
DOWDY DOZER & ROCK PRODUCTS (2427 LACONIA RD in SOMERVILLE, TN; small business)
$8,500 with U.S. Army Corps of Engineers - civil program financing only for Other Natural Resources and Conservation Services. Signed on 2002-10-30. Completion date: 2002-11-01.
Top industries in this zip code by the number of employees in 2005:
Administrative and Support and Waste Management and Remediation Services: Packaging and Labeling Services (100-249 employees: 1 establishment)
Educational Services: Elementary and Secondary Schools (50-99: 1)
Health Care and Social Assistance: Nursing Care Facilities (50-99: 1)
Health Care and Social Assistance: General Medical and Surgical Hospitals (50-99: 1)
Other Services (except Public Administration): Religious Organizations (10-19: 2, 5-9: 4, 1-4: 6)
Wholesale Trade: Farm and Garden Machinery and Equipment Merchant Wholesalers (20-49: 2)
Administrative and Support and Waste Management and Remediation Services: Landscaping Services (20-49: 1, 10-19: 1, 5-9: 1, 1-4: 1)
People in group quarters in 2010:
103 people in local jails and other municipal confinement facilities
93 people in correctional facilities intended for juveniles
71 people in nursing facilities/skilled-nursing facilities
20 people in residential treatment centers for juveniles (non-correctional)
17 people in emergency and transitional shelters (with sleeping facilities) for people experiencing homelessness
6 people in group homes intended for adults
3 people in other noninstitutional facilities
People in group quarters in 2000:
136 people in residential treatment centers for emotionally disturbed children
94 people in local jails and other confinement facilities (including police lockups)
75 people in nursing homes
7 people in homes for the mentally ill
Fatal accident statistics in 2014:
Fatal accident count: 1
Vehicles involved in fatal accidents: 1
Fatal accidents caused by drunken drivers: 1
Fatalities: 1
Persons involved in fatal accidents: 1
Pedestrians involved in fatal accidents: 0
Fatal accident statistics in 2013:
Fatal accident count: 1
Vehicles involved in fatal accidents: 1
Fatal accidents caused by drunken drivers: 1
Fatalities: 1
Persons involved in fatal accidents: 1
Pedestrians involved in fatal accidents: 0
2002 - 2018 National Fire Incident Reporting System (NFIRS) incidents
Based on the data from the years 2002 - 2018 the average number of fires per year is 99. The highest number of fire incidents - 197 took place in 2007, and the least - 33 in 2003. The data has a rising trend.
When looking into fire subcategories, the most incidents belonged to: Structure Fires (43.5%), and Outside Fires (39.3%).
Fire incident types reported to NFIRS in Zip Code 38068
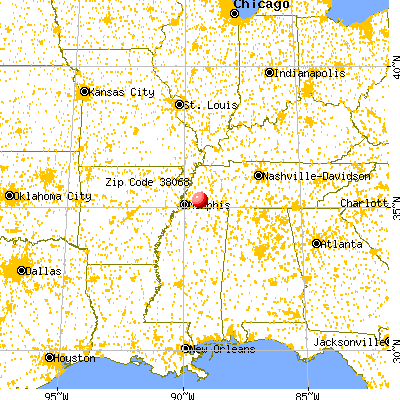


 Nearest zip codes: 38076, 38060, 38069, 38057, 38046, 38049.
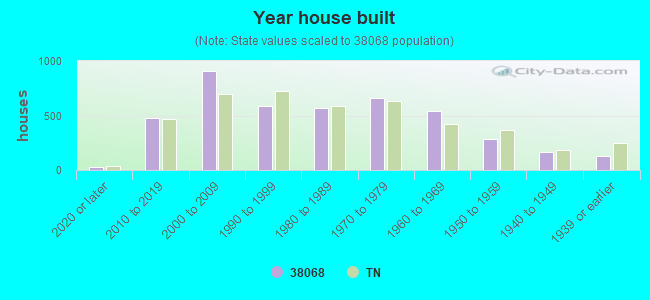


 Based on the data from the years 2002 - 2018 the average number of fires per year is 99. The highest number of fire incidents - 197 took place in 2007, and the least - 33 in 2003. The data has a rising trend.
 When looking into fire subcategories, the most incidents belonged to: Structure Fires (43.5%), and Outside Fires (39.3%).