Estimated zip code population in 2022: 6,145
Zip code population in 2010: 7,334
Zip code population in 2000: 8,104
Houses and condos: 3,176
Renter-occupied apartments: 2,356
% of renters here:
88%State:
33%
March 2022 cost of living index in zip code 38126: 84.9
(less than average, U.S. average is 100)
Land area: 1.8
sq. mi.
Water area: 0.0
sq. mi.
Population density: 3,382 people per square mile (average).
OSM Map
General Map
Google Map
MSN Map
OSM Map
General Map
Google Map
MSN Map
OSM Map
General Map
Google Map
MSN Map
OSM Map
General Map
Google Map
MSN Map
Please wait while loading the map...
Real estate property taxes paid for housing units in 2022:
This zip code:
1.0% ($806)Tennessee:
0.5% ($1,376)
Median real estate property taxes paid for housing units with mortgages in 2022: $792 (0.5%)
Median real estate property taxes paid for housing units with no mortgage in 2022: $810 (1.4%)
Business Search - 14 Million verified businesses
Males: 2,256 Females: 3,889
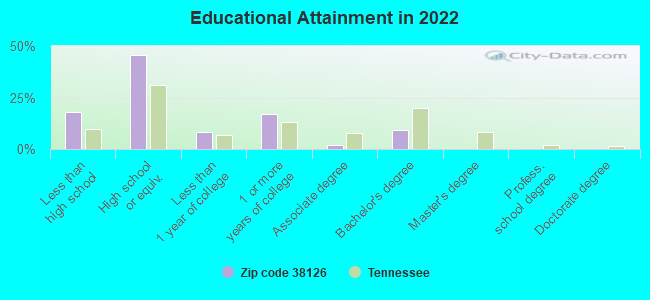
For population 25 years and over in 38126:
High school or higher: 80.7%Bachelor's degree or higher: 9.2%Graduate or professional degree: 0.3%Unemployed: 7.6%Mean travel time to work (commute): 18.1 minutes
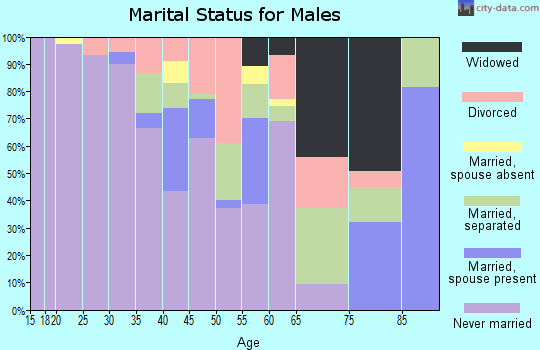
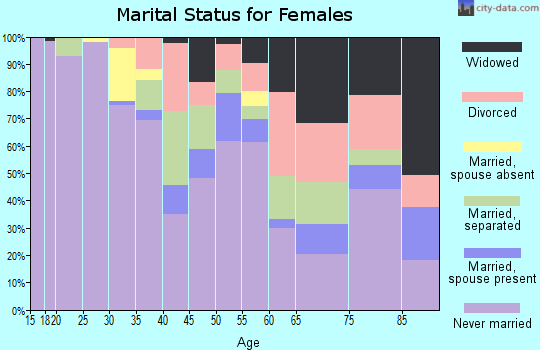
For population 15 years and over in 38126:
Never married: 65.6%Now married: 11.3%Separated: 3.0%Widowed: 6.1%Divorced: 14.0%
Zip code 38126 compared to state average:
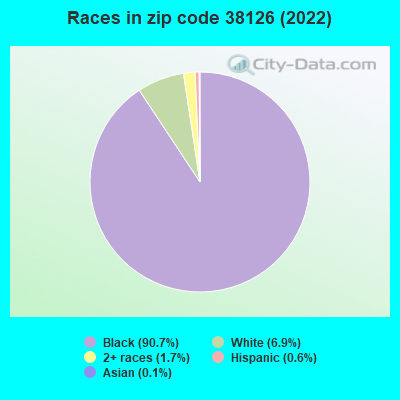
Median household income significantly below state average. Median house value significantly below state average. Unemployed percentage above state average. Black race population percentage significantly above state average. Hispanic race population percentage significantly below state average. Median age significantly below state average. Foreign-born population percentage significantly below state average. Renting percentage significantly above state average. Length of stay since moving in significantly above state average. Percentage of population with a bachelor's degree or higher significantly below state average. 5,571 90.7% Black 423 6.9% White 102 1.7% Two or more races 38 0.6% Hispanic or Latino 8 0.1% Asian
Data:
Median household income ($)
Median household income (% change since 2000)
Household income diversity
Ratio of average income to average house value (%)
Ratio of average income to average rent
Median household income ($) - White
Median household income ($) - Black or African American
Median household income ($) - Asian
Median household income ($) - Hispanic or Latino
Median household income ($) - American Indian and Alaska Native
Median household income ($) - Multirace
Median household income ($) - Other Race
Median household income for houses/condos with a mortgage ($)
Median household income for apartments without a mortgage ($)
Races - White alone (%)
Races - White alone (% change since 2000)
Races - Black alone (%)
Races - Black alone (% change since 2000)
Races - American Indian alone (%)
Races - American Indian alone (% change since 2000)
Races - Asian alone (%)
Races - Asian alone (% change since 2000)
Races - Hispanic (%)
Races - Hispanic (% change since 2000)
Races - Native Hawaiian and Other Pacific Islander alone (%)
Races - Native Hawaiian and Other Pacific Islander alone (% change since 2000)
Races - Two or more races (%)
Races - Two or more races (% change since 2000)
Races - Other race alone (%)
Races - Other race alone (% change since 2000)
Racial diversity
Unemployment (%)
Unemployment (% change since 2000)
Unemployment (%) - White
Unemployment (%) - Black or African American
Unemployment (%) - Asian
Unemployment (%) - Hispanic or Latino
Unemployment (%) - American Indian and Alaska Native
Unemployment (%) - Multirace
Unemployment (%) - Other Race
Population density (people per square mile)
Population - Males (%)
Population - Females (%)
Population - Males (%) - White
Population - Males (%) - Black or African American
Population - Males (%) - Asian
Population - Males (%) - Hispanic or Latino
Population - Males (%) - American Indian and Alaska Native
Population - Males (%) - Multirace
Population - Males (%) - Other Race
Population - Females (%) - White
Population - Females (%) - Black or African American
Population - Females (%) - Asian
Population - Females (%) - Hispanic or Latino
Population - Females (%) - American Indian and Alaska Native
Population - Females (%) - Multirace
Population - Females (%) - Other Race
Coronavirus confirmed cases (Apr 24, 2024)
Deaths caused by coronavirus (Apr 24, 2024)
Coronavirus confirmed cases (per 100k population) (Apr 24, 2024)
Deaths caused by coronavirus (per 100k population) (Apr 24, 2024)
Daily increase in number of cases (Apr 24, 2024)
Weekly increase in number of cases (Apr 24, 2024)
Cases doubled (in days) (Apr 24, 2024)
Hospitalized patients (Apr 18, 2022)
Negative test results (Apr 18, 2022)
Total test results (Apr 18, 2022)
COVID Vaccine doses distributed (per 100k population) (Sep 19, 2023)
COVID Vaccine doses administered (per 100k population) (Sep 19, 2023)
COVID Vaccine doses distributed (Sep 19, 2023)
COVID Vaccine doses administered (Sep 19, 2023)
Likely homosexual households (%)
Likely homosexual households (% change since 2000)
Likely homosexual households - Lesbian couples (%)
Likely homosexual households - Lesbian couples (% change since 2000)
Likely homosexual households - Gay men (%)
Likely homosexual households - Gay men (% change since 2000)
Cost of living index
Median gross rent ($)
Median contract rent ($)
Median monthly housing costs ($)
Median house or condo value ($)
Median house or condo value ($ change since 2000)
Mean house or condo value by units in structure - 1, detached ($)
Mean house or condo value by units in structure - 1, attached ($)
Mean house or condo value by units in structure - 2 ($)
Mean house or condo value by units in structure by units in structure - 3 or 4 ($)
Mean house or condo value by units in structure - 5 or more ($)
Mean house or condo value by units in structure - Boat, RV, van, etc. ($)
Mean house or condo value by units in structure - Mobile home ($)
Median house or condo value ($) - White
Median house or condo value ($) - Black or African American
Median house or condo value ($) - Asian
Median house or condo value ($) - Hispanic or Latino
Median house or condo value ($) - American Indian and Alaska Native
Median house or condo value ($) - Multirace
Median house or condo value ($) - Other Race
Median resident age
Resident age diversity
Median resident age - Males
Median resident age - Females
Median resident age - White
Median resident age - Black or African American
Median resident age - Asian
Median resident age - Hispanic or Latino
Median resident age - American Indian and Alaska Native
Median resident age - Multirace
Median resident age - Other Race
Median resident age - Males - White
Median resident age - Males - Black or African American
Median resident age - Males - Asian
Median resident age - Males - Hispanic or Latino
Median resident age - Males - American Indian and Alaska Native
Median resident age - Males - Multirace
Median resident age - Males - Other Race
Median resident age - Females - White
Median resident age - Females - Black or African American
Median resident age - Females - Asian
Median resident age - Females - Hispanic or Latino
Median resident age - Females - American Indian and Alaska Native
Median resident age - Females - Multirace
Median resident age - Females - Other Race
Commute - mean travel time to work (minutes)
Travel time to work - Less than 5 minutes (%)
Travel time to work - Less than 5 minutes (% change since 2000)
Travel time to work - 5 to 9 minutes (%)
Travel time to work - 5 to 9 minutes (% change since 2000)
Travel time to work - 10 to 19 minutes (%)
Travel time to work - 10 to 19 minutes (% change since 2000)
Travel time to work - 20 to 29 minutes (%)
Travel time to work - 20 to 29 minutes (% change since 2000)
Travel time to work - 30 to 39 minutes (%)
Travel time to work - 30 to 39 minutes (% change since 2000)
Travel time to work - 40 to 59 minutes (%)
Travel time to work - 40 to 59 minutes (% change since 2000)
Travel time to work - 60 to 89 minutes (%)
Travel time to work - 60 to 89 minutes (% change since 2000)
Travel time to work - 90 or more minutes (%)
Travel time to work - 90 or more minutes (% change since 2000)
Marital status - Never married (%)
Marital status - Now married (%)
Marital status - Separated (%)
Marital status - Widowed (%)
Marital status - Divorced (%)
Median family income ($)
Median family income (% change since 2000)
Median non-family income ($)
Median non-family income (% change since 2000)
Median per capita income ($)
Median per capita income (% change since 2000)
Median family income ($) - White
Median family income ($) - Black or African American
Median family income ($) - Asian
Median family income ($) - Hispanic or Latino
Median family income ($) - American Indian and Alaska Native
Median family income ($) - Multirace
Median family income ($) - Other Race
Median year house/condo built
Median year apartment built
Year house built - Built 2005 or later (%)
Year house built - Built 2000 to 2004 (%)
Year house built - Built 1990 to 1999 (%)
Year house built - Built 1980 to 1989 (%)
Year house built - Built 1970 to 1979 (%)
Year house built - Built 1960 to 1969 (%)
Year house built - Built 1950 to 1959 (%)
Year house built - Built 1940 to 1949 (%)
Year house built - Built 1939 or earlier (%)
Average household size
Household density (households per square mile)
Average household size - White
Average household size - Black or African American
Average household size - Asian
Average household size - Hispanic or Latino
Average household size - American Indian and Alaska Native
Average household size - Multirace
Average household size - Other Race
Occupied housing units (%)
Vacant housing units (%)
Owner occupied housing units (%)
Renter occupied housing units (%)
Vacancy status - For rent (%)
Vacancy status - For sale only (%)
Vacancy status - Rented or sold, not occupied (%)
Vacancy status - For seasonal, recreational, or occasional use (%)
Vacancy status - For migrant workers (%)
Vacancy status - Other vacant (%)
Residents with income below the poverty level (%)
Residents with income below 50% of the poverty level (%)
Children below poverty level (%)
Poor families by family type - Married-couple family (%)
Poor families by family type - Male, no wife present (%)
Poor families by family type - Female, no husband present (%)
Poverty status for native-born residents (%)
Poverty status for foreign-born residents (%)
Poverty among high school graduates not in families (%)
Poverty among people who did not graduate high school not in families (%)
Residents with income below the poverty level (%) - White
Residents with income below the poverty level (%) - Black or African American
Residents with income below the poverty level (%) - Asian
Residents with income below the poverty level (%) - Hispanic or Latino
Residents with income below the poverty level (%) - American Indian and Alaska Native
Residents with income below the poverty level (%) - Multirace
Residents with income below the poverty level (%) - Other Race
Air pollution - Air Quality Index (AQI)
Air pollution - CO
Air pollution - NO2
Air pollution - SO2
Air pollution - Ozone
Air pollution - PM10
Air pollution - PM25
Air pollution - Pb
Crime - Murders per 100,000 population
Crime - Rapes per 100,000 population
Crime - Robberies per 100,000 population
Crime - Assaults per 100,000 population
Crime - Burglaries per 100,000 population
Crime - Thefts per 100,000 population
Crime - Auto thefts per 100,000 population
Crime - Arson per 100,000 population
Crime - City-data.com crime index
Crime - Violent crime index
Crime - Property crime index
Crime - Murders per 100,000 population (5 year average)
Crime - Rapes per 100,000 population (5 year average)
Crime - Robberies per 100,000 population (5 year average)
Crime - Assaults per 100,000 population (5 year average)
Crime - Burglaries per 100,000 population (5 year average)
Crime - Thefts per 100,000 population (5 year average)
Crime - Auto thefts per 100,000 population (5 year average)
Crime - Arson per 100,000 population (5 year average)
Crime - City-data.com crime index (5 year average)
Crime - Violent crime index (5 year average)
Crime - Property crime index (5 year average)
1996 Presidential Elections Results (%) - Democratic Party (Clinton)
1996 Presidential Elections Results (%) - Republican Party (Dole)
1996 Presidential Elections Results (%) - Other
2000 Presidential Elections Results (%) - Democratic Party (Gore)
2000 Presidential Elections Results (%) - Republican Party (Bush)
2000 Presidential Elections Results (%) - Other
2004 Presidential Elections Results (%) - Democratic Party (Kerry)
2004 Presidential Elections Results (%) - Republican Party (Bush)
2004 Presidential Elections Results (%) - Other
2008 Presidential Elections Results (%) - Democratic Party (Obama)
2008 Presidential Elections Results (%) - Republican Party (McCain)
2008 Presidential Elections Results (%) - Other
2012 Presidential Elections Results (%) - Democratic Party (Obama)
2012 Presidential Elections Results (%) - Republican Party (Romney)
2012 Presidential Elections Results (%) - Other
2016 Presidential Elections Results (%) - Democratic Party (Clinton)
2016 Presidential Elections Results (%) - Republican Party (Trump)
2016 Presidential Elections Results (%) - Other
2020 Presidential Elections Results (%) - Democratic Party (Biden)
2020 Presidential Elections Results (%) - Republican Party (Trump)
2020 Presidential Elections Results (%) - Other
Ancestries Reported - Arab (%)
Ancestries Reported - Czech (%)
Ancestries Reported - Danish (%)
Ancestries Reported - Dutch (%)
Ancestries Reported - English (%)
Ancestries Reported - French (%)
Ancestries Reported - French Canadian (%)
Ancestries Reported - German (%)
Ancestries Reported - Greek (%)
Ancestries Reported - Hungarian (%)
Ancestries Reported - Irish (%)
Ancestries Reported - Italian (%)
Ancestries Reported - Lithuanian (%)
Ancestries Reported - Norwegian (%)
Ancestries Reported - Polish (%)
Ancestries Reported - Portuguese (%)
Ancestries Reported - Russian (%)
Ancestries Reported - Scotch-Irish (%)
Ancestries Reported - Scottish (%)
Ancestries Reported - Slovak (%)
Ancestries Reported - Subsaharan African (%)
Ancestries Reported - Swedish (%)
Ancestries Reported - Swiss (%)
Ancestries Reported - Ukrainian (%)
Ancestries Reported - United States (%)
Ancestries Reported - Welsh (%)
Ancestries Reported - West Indian (%)
Ancestries Reported - Other (%)
Educational Attainment - No schooling completed (%)
Educational Attainment - Less than high school (%)
Educational Attainment - High school or equivalent (%)
Educational Attainment - Less than 1 year of college (%)
Educational Attainment - 1 or more years of college (%)
Educational Attainment - Associate degree (%)
Educational Attainment - Bachelor's degree (%)
Educational Attainment - Master's degree (%)
Educational Attainment - Professional school degree (%)
Educational Attainment - Doctorate degree (%)
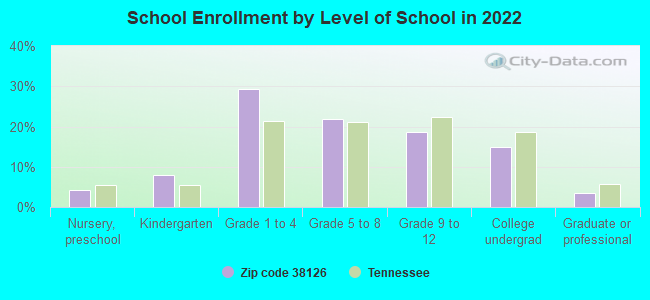
School Enrollment - Nursery, preschool (%)
School Enrollment - Kindergarten (%)
School Enrollment - Grade 1 to 4 (%)
School Enrollment - Grade 5 to 8 (%)
School Enrollment - Grade 9 to 12 (%)
School Enrollment - College undergrad (%)
School Enrollment - Graduate or professional (%)
School Enrollment - Not enrolled in school (%)
School enrollment - Public schools (%)
School enrollment - Private schools (%)
School enrollment - Not enrolled (%)
Median number of rooms in houses and condos
Median number of rooms in apartments
Housing units lacking complete plumbing facilities (%)
Housing units lacking complete kitchen facilities (%)
Density of houses
Urban houses (%)
Rural houses (%)
Households with people 60 years and over (%)
Households with people 65 years and over (%)
Households with people 75 years and over (%)
Households with one or more nonrelatives (%)
Households with no nonrelatives (%)
Population in households (%)
Family households (%)
Nonfamily households (%)
Population in families (%)
Family households with own children (%)
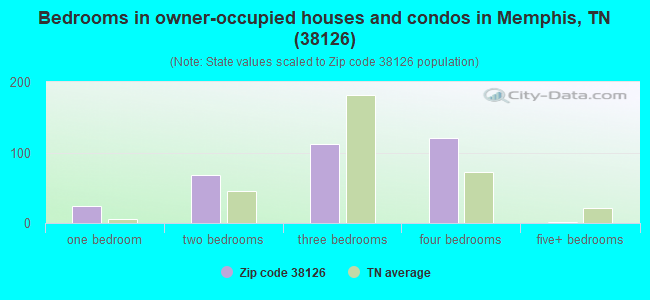
Median number of bedrooms in owner occupied houses
Mean number of bedrooms in owner occupied houses
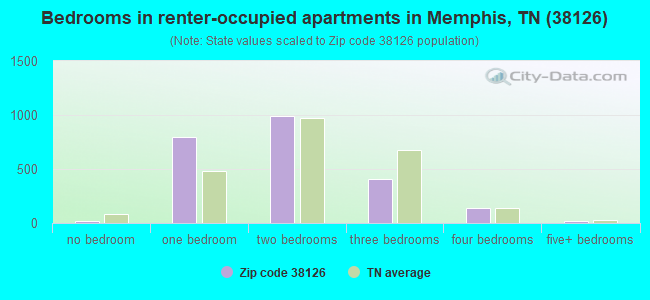
Median number of bedrooms in renter occupied houses
Mean number of bedrooms in renter occupied houses
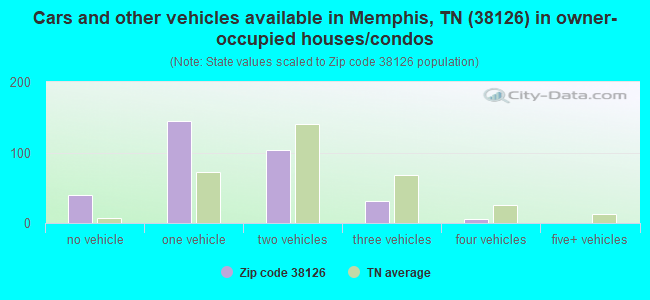
Median number of vehichles in owner occupied houses
Mean number of vehichles in owner occupied houses
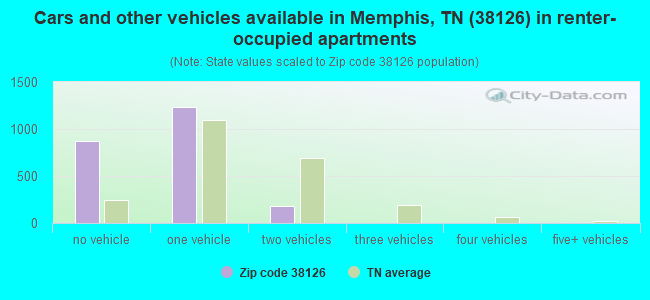
Median number of vehichles in renter occupied houses
Mean number of vehichles in renter occupied houses
Mortgage status - with mortgage (%)
Mortgage status - with second mortgage (%)
Mortgage status - with home equity loan (%)
Mortgage status - with both second mortgage and home equity loan (%)
Mortgage status - without a mortgage (%)
Average family size
Average family size - White
Average family size - Black or African American
Average family size - Asian
Average family size - Hispanic or Latino
Average family size - American Indian and Alaska Native
Average family size - Multirace
Average family size - Other Race
Geographical mobility - Same house 1 year ago (%)
Geographical mobility - Moved within same county (%)
Geographical mobility - Moved from different county within same state (%)
Geographical mobility - Moved from different state (%)
Geographical mobility - Moved from abroad (%)
Place of birth - Born in state of residence (%)
Place of birth - Born in other state (%)
Place of birth - Native, outside of US (%)
Place of birth - Foreign born (%)
Housing units in structures - 1, detached (%)
Housing units in structures - 1, attached (%)
Housing units in structures - 2 (%)
Housing units in structures - 3 or 4 (%)
Housing units in structures - 5 to 9 (%)
Housing units in structures - 10 to 19 (%)
Housing units in structures - 20 to 49 (%)
Housing units in structures - 50 or more (%)
Housing units in structures - Mobile home (%)
Housing units in structures - Boat, RV, van, etc. (%)
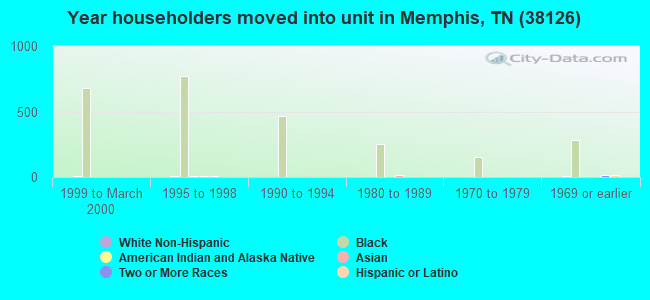
House/condo owner moved in on average (years ago)
Renter moved in on average (years ago)
Year householder moved into unit - Moved in 1999 to March 2000 (%)
Year householder moved into unit - Moved in 1995 to 1998 (%)
Year householder moved into unit - Moved in 1990 to 1994 (%)
Year householder moved into unit - Moved in 1980 to 1989 (%)
Year householder moved into unit - Moved in 1970 to 1979 (%)
Year householder moved into unit - Moved in 1969 or earlier (%)
Means of transportation to work - Drove car alone (%)
Means of transportation to work - Carpooled (%)
Means of transportation to work - Public transportation (%)
Means of transportation to work - Bus or trolley bus (%)
Means of transportation to work - Streetcar or trolley car (%)
Means of transportation to work - Subway or elevated (%)
Means of transportation to work - Railroad (%)
Means of transportation to work - Ferryboat (%)
Means of transportation to work - Taxicab (%)
Means of transportation to work - Motorcycle (%)
Means of transportation to work - Bicycle (%)
Means of transportation to work - Walked (%)
Means of transportation to work - Other means (%)
Working at home (%)
Industry diversity
Most Common Industries - Agriculture, forestry, fishing and hunting, and mining (%)
Most Common Industries - Agriculture, forestry, fishing and hunting (%)
Most Common Industries - Mining, quarrying, and oil and gas extraction (%)
Most Common Industries - Construction (%)
Most Common Industries - Manufacturing (%)
Most Common Industries - Wholesale trade (%)
Most Common Industries - Retail trade (%)
Most Common Industries - Transportation and warehousing, and utilities (%)
Most Common Industries - Transportation and warehousing (%)
Most Common Industries - Utilities (%)
Most Common Industries - Information (%)
Most Common Industries - Finance and insurance, and real estate and rental and leasing (%)
Most Common Industries - Finance and insurance (%)
Most Common Industries - Real estate and rental and leasing (%)
Most Common Industries - Professional, scientific, and management, and administrative and waste management services (%)
Most Common Industries - Professional, scientific, and technical services (%)
Most Common Industries - Management of companies and enterprises (%)
Most Common Industries - Administrative and support and waste management services (%)
Most Common Industries - Educational services, and health care and social assistance (%)
Most Common Industries - Educational services (%)
Most Common Industries - Health care and social assistance (%)
Most Common Industries - Arts, entertainment, and recreation, and accommodation and food services (%)
Most Common Industries - Arts, entertainment, and recreation (%)
Most Common Industries - Accommodation and food services (%)
Most Common Industries - Other services, except public administration (%)
Most Common Industries - Public administration (%)
Occupation diversity
Most Common Occupations - Management, business, science, and arts occupations (%)
Most Common Occupations - Management, business, and financial occupations (%)
Most Common Occupations - Management occupations (%)
Most Common Occupations - Business and financial operations occupations (%)
Most Common Occupations - Computer, engineering, and science occupations (%)
Most Common Occupations - Computer and mathematical occupations (%)
Most Common Occupations - Architecture and engineering occupations (%)
Most Common Occupations - Life, physical, and social science occupations (%)
Most Common Occupations - Education, legal, community service, arts, and media occupations (%)
Most Common Occupations - Community and social service occupations (%)
Most Common Occupations - Legal occupations (%)
Most Common Occupations - Education, training, and library occupations (%)
Most Common Occupations - Arts, design, entertainment, sports, and media occupations (%)
Most Common Occupations - Healthcare practitioners and technical occupations (%)
Most Common Occupations - Health diagnosing and treating practitioners and other technical occupations (%)
Most Common Occupations - Health technologists and technicians (%)
Most Common Occupations - Service occupations (%)
Most Common Occupations - Healthcare support occupations (%)
Most Common Occupations - Protective service occupations (%)
Most Common Occupations - Fire fighting and prevention, and other protective service workers including supervisors (%)
Most Common Occupations - Law enforcement workers including supervisors (%)
Most Common Occupations - Food preparation and serving related occupations (%)
Most Common Occupations - Building and grounds cleaning and maintenance occupations (%)
Most Common Occupations - Personal care and service occupations (%)
Most Common Occupations - Sales and office occupations (%)
Most Common Occupations - Sales and related occupations (%)
Most Common Occupations - Office and administrative support occupations (%)
Most Common Occupations - Natural resources, construction, and maintenance occupations (%)
Most Common Occupations - Farming, fishing, and forestry occupations (%)
Most Common Occupations - Construction and extraction occupations (%)
Most Common Occupations - Installation, maintenance, and repair occupations (%)
Most Common Occupations - Production, transportation, and material moving occupations (%)
Most Common Occupations - Production occupations (%)
Most Common Occupations - Transportation occupations (%)
Most Common Occupations - Material moving occupations (%)
People in Group quarters - Institutionalized population (%)
People in Group quarters - Correctional institutions (%)
People in Group quarters - Federal prisons and detention centers (%)
People in Group quarters - Halfway houses (%)
People in Group quarters - Local jails and other confinement facilities (including police lockups) (%)
People in Group quarters - Military disciplinary barracks (%)
People in Group quarters - State prisons (%)
People in Group quarters - Other types of correctional institutions (%)
People in Group quarters - Nursing homes (%)
People in Group quarters - Hospitals/wards, hospices, and schools for the handicapped (%)
People in Group quarters - Hospitals/wards and hospices for chronically ill (%)
People in Group quarters - Hospices or homes for chronically ill (%)
People in Group quarters - Military hospitals or wards for chronically ill (%)
People in Group quarters - Other hospitals or wards for chronically ill (%)
People in Group quarters - Hospitals or wards for drug/alcohol abuse (%)
People in Group quarters - Mental (Psychiatric) hospitals or wards (%)
People in Group quarters - Schools, hospitals, or wards for the mentally retarded (%)
People in Group quarters - Schools, hospitals, or wards for the physically handicapped (%)
People in Group quarters - Institutions for the deaf (%)
People in Group quarters - Institutions for the blind (%)
People in Group quarters - Orthopedic wards and institutions for the physically handicapped (%)
People in Group quarters - Wards in general hospitals for patients who have no usual home elsewhere (%)
People in Group quarters - Wards in military hospitals for patients who have no usual home elsewhere (%)
People in Group quarters - Juvenile institutions (%)
People in Group quarters - Long-term care (%)
People in Group quarters - Homes for abused, dependent, and neglected children (%)
People in Group quarters - Residential treatment centers for emotionally disturbed children (%)
People in Group quarters - Training schools for juvenile delinquents (%)
People in Group quarters - Short-term care, detention or diagnostic centers for delinquent children (%)
People in Group quarters - Type of juvenile institution unknown (%)
People in Group quarters - Noninstitutionalized population (%)
People in Group quarters - College dormitories (includes college quarters off campus) (%)
People in Group quarters - Military quarters (%)
People in Group quarters - On base (%)
People in Group quarters - Barracks, unaccompanied personnel housing (UPH), (Enlisted/Officer), ;and similar group living quarters for military personnel (%)
People in Group quarters - Transient quarters for temporary residents (%)
People in Group quarters - Military ships (%)
People in Group quarters - Group homes (%)
People in Group quarters - Homes or halfway houses for drug/alcohol abuse (%)
People in Group quarters - Homes for the mentally ill (%)
People in Group quarters - Homes for the mentally retarded (%)
People in Group quarters - Homes for the physically handicapped (%)
People in Group quarters - Other group homes (%)
People in Group quarters - Religious group quarters (%)
People in Group quarters - Dormitories (%)
People in Group quarters - Agriculture workers' dormitories on farms (%)
People in Group quarters - Job Corps and vocational training facilities (%)
People in Group quarters - Other workers' dormitories (%)
People in Group quarters - Crews of maritime vessels (%)
People in Group quarters - Other nonhousehold living situations (%)
People in Group quarters - Other noninstitutional group quarters (%)
Residents speaking English at home (%)
Residents speaking English at home - Born in the United States (%)
Residents speaking English at home - Native, born elsewhere (%)
Residents speaking English at home - Foreign born (%)
Residents speaking Spanish at home (%)
Residents speaking Spanish at home - Born in the United States (%)
Residents speaking Spanish at home - Native, born elsewhere (%)
Residents speaking Spanish at home - Foreign born (%)
Residents speaking other language at home (%)
Residents speaking other language at home - Born in the United States (%)
Residents speaking other language at home - Native, born elsewhere (%)
Residents speaking other language at home - Foreign born (%)
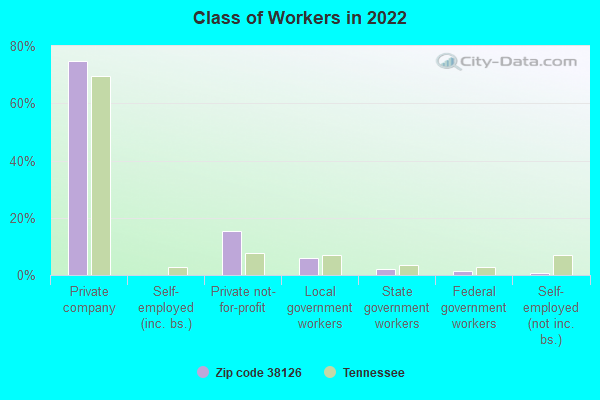
Class of Workers - Employee of private company (%)
Class of Workers - Self-employed in own incorporated business (%)
Class of Workers - Private not-for-profit wage and salary workers (%)
Class of Workers - Local government workers (%)
Class of Workers - State government workers (%)
Class of Workers - Federal government workers (%)
Class of Workers - Self-employed workers in own not incorporated business and Unpaid family workers (%)
House heating fuel used in houses and condos - Utility gas (%)
House heating fuel used in houses and condos - Bottled, tank, or LP gas (%)
House heating fuel used in houses and condos - Electricity (%)
House heating fuel used in houses and condos - Fuel oil, kerosene, etc. (%)
House heating fuel used in houses and condos - Coal or coke (%)
House heating fuel used in houses and condos - Wood (%)
House heating fuel used in houses and condos - Solar energy (%)
House heating fuel used in houses and condos - Other fuel (%)
House heating fuel used in houses and condos - No fuel used (%)
House heating fuel used in apartments - Utility gas (%)
House heating fuel used in apartments - Bottled, tank, or LP gas (%)
House heating fuel used in apartments - Electricity (%)
House heating fuel used in apartments - Fuel oil, kerosene, etc. (%)
House heating fuel used in apartments - Coal or coke (%)
House heating fuel used in apartments - Wood (%)
House heating fuel used in apartments - Solar energy (%)
House heating fuel used in apartments - Other fuel (%)
House heating fuel used in apartments - No fuel used (%)
Armed forces status - In Armed Forces (%)
Armed forces status - Civilian (%)
Armed forces status - Civilian - Veteran (%)
Armed forces status - Civilian - Nonveteran (%)
Fatal accidents locations in years 2005-2021
Fatal accidents locations in 2005
Fatal accidents locations in 2006
Fatal accidents locations in 2007
Fatal accidents locations in 2008
Fatal accidents locations in 2009
Fatal accidents locations in 2010
Fatal accidents locations in 2011
Fatal accidents locations in 2012
Fatal accidents locations in 2013
Fatal accidents locations in 2014
Fatal accidents locations in 2015
Fatal accidents locations in 2016
Fatal accidents locations in 2017
Fatal accidents locations in 2018
Fatal accidents locations in 2019
Fatal accidents locations in 2020
Fatal accidents locations in 2021
Alcohol use - People drinking some alcohol every month (%)
Alcohol use - People not drinking at all (%)
Alcohol use - Average days/month drinking alcohol
Alcohol use - Average drinks/week
Alcohol use - Average days/year people drink much
Audiometry - Average condition of hearing (%)
Audiometry - People that can hear a whisper from across a quiet room (%)
Audiometry - People that can hear normal voice from across a quiet room (%)
Audiometry - Ears ringing, roaring, buzzing (%)
Audiometry - Had a job exposure to loud noise (%)
Audiometry - Had off-work exposure to loud noise (%)
Blood Pressure & Cholesterol - Has high blood pressure (%)
Blood Pressure & Cholesterol - Checking blood pressure at home (%)
Blood Pressure & Cholesterol - Frequently checking blood cholesterol (%)
Blood Pressure & Cholesterol - Has high cholesterol level (%)
Consumer Behavior - Money monthly spent on food at supermarket/grocery store
Consumer Behavior - Money monthly spent on food at other stores
Consumer Behavior - Money monthly spent on eating out
Consumer Behavior - Money monthly spent on carryout/delivered foods
Consumer Behavior - Income spent on food at supermarket/grocery store (%)
Consumer Behavior - Income spent on food at other stores (%)
Consumer Behavior - Income spent on eating out (%)
Consumer Behavior - Income spent on carryout/delivered foods (%)
Current Health Status - General health condition (%)
Current Health Status - Blood donors (%)
Current Health Status - Has blood ever tested for HIV virus (%)
Current Health Status - Left-handed people (%)
Dermatology - People using sunscreen (%)
Diabetes - Diabetics (%)
Diabetes - Had a blood test for high blood sugar (%)
Diabetes - People taking insulin (%)
Diet Behavior & Nutrition - Diet health (%)
Diet Behavior & Nutrition - Milk product consumption (# of products/month)
Diet Behavior & Nutrition - Meals not home prepared (#/week)
Diet Behavior & Nutrition - Meals from fast food or pizza place (#/week)
Diet Behavior & Nutrition - Ready-to-eat foods (#/month)
Diet Behavior & Nutrition - Frozen meals/pizza (#/month)
Drug Use - People that ever used marijuana or hashish (%)
Drug Use - Ever used hard drugs (%)
Drug Use - Ever used any form of cocaine (%)
Drug Use - Ever used heroin (%)
Drug Use - Ever used methamphetamine (%)
Health Insurance - People covered by health insurance (%)
Kidney Conditions-Urology - Avg. # of times urinating at night
Medical Conditions - People with asthma (%)
Medical Conditions - People with anemia (%)
Medical Conditions - People with psoriasis (%)
Medical Conditions - People with overweight (%)
Medical Conditions - Elderly people having difficulties in thinking or remembering (%)
Medical Conditions - People who ever received blood transfusion (%)
Medical Conditions - People having trouble seeing even with glass/contacts (%)
Medical Conditions - People with arthritis (%)
Medical Conditions - People with gout (%)
Medical Conditions - People with congestive heart failure (%)
Medical Conditions - People with coronary heart disease (%)
Medical Conditions - People with angina pectoris (%)
Medical Conditions - People who ever had heart attack (%)
Medical Conditions - People who ever had stroke (%)
Medical Conditions - People with emphysema (%)
Medical Conditions - People with thyroid problem (%)
Medical Conditions - People with chronic bronchitis (%)
Medical Conditions - People with any liver condition (%)
Medical Conditions - People who ever had cancer or malignancy (%)
Mental Health - People who have little interest in doing things (%)
Mental Health - People feeling down, depressed, or hopeless (%)
Mental Health - People who have trouble sleeping or sleeping too much (%)
Mental Health - People feeling tired or having little energy (%)
Mental Health - People with poor appetite or overeating (%)
Mental Health - People feeling bad about themself (%)
Mental Health - People who have trouble concentrating on things (%)
Mental Health - People moving or speaking slowly or too fast (%)
Mental Health - People having thoughts they would be better off dead (%)
Oral Health - Average years since last visit a dentist
Oral Health - People embarrassed because of mouth (%)
Oral Health - People with gum disease (%)
Oral Health - General health of teeth and gums (%)
Oral Health - Average days a week using dental floss/device
Oral Health - Average days a week using mouthwash for dental problem
Oral Health - Average number of teeth
Pesticide Use - Households using pesticides to control insects (%)
Pesticide Use - Households using pesticides to kill weeds (%)
Physical Activity - People doing vigorous-intensity work activities (%)
Physical Activity - People doing moderate-intensity work activities (%)
Physical Activity - People walking or bicycling (%)
Physical Activity - People doing vigorous-intensity recreational activities (%)
Physical Activity - People doing moderate-intensity recreational activities (%)
Physical Activity - Average hours a day doing sedentary activities
Physical Activity - Average hours a day watching TV or videos
Physical Activity - Average hours a day using computer
Physical Functioning - People having limitations keeping them from working (%)
Physical Functioning - People limited in amount of work they can do (%)
Physical Functioning - People that need special equipment to walk (%)
Physical Functioning - People experiencing confusion/memory problems (%)
Physical Functioning - People requiring special healthcare equipment (%)
Prescription Medications - Average number of prescription medicines taking
Preventive Aspirin Use - Adults 40+ taking low-dose aspirin (%)
Reproductive Health - Vaginal deliveries (%)
Reproductive Health - Cesarean deliveries (%)
Reproductive Health - Deliveries resulted in a live birth (%)
Reproductive Health - Pregnancies resulted in a delivery (%)
Reproductive Health - Women breastfeeding newborns (%)
Reproductive Health - Women that had a hysterectomy (%)
Reproductive Health - Women that had both ovaries removed (%)
Reproductive Health - Women that have ever taken birth control pills (%)
Reproductive Health - Women taking birth control pills (%)
Reproductive Health - Women that have ever used Depo-Provera or injectables (%)
Reproductive Health - Women that have ever used female hormones (%)
Sexual Behavior - People 18+ that ever had sex (vaginal, anal, or oral) (%)
Sexual Behavior - Males 18+ that ever had vaginal sex with a woman (%)
Sexual Behavior - Males 18+ that ever performed oral sex on a woman (%)
Sexual Behavior - Males 18+ that ever had anal sex with a woman (%)
Sexual Behavior - Males 18+ that ever had any sex with a man (%)
Sexual Behavior - Females 18+ that ever had vaginal sex with a man (%)
Sexual Behavior - Females 18+ that ever performed oral sex on a man (%)
Sexual Behavior - Females 18+ that ever had anal sex with a man (%)
Sexual Behavior - Females 18+ that ever had any kind of sex with a woman (%)
Sexual Behavior - Average age people first had sex
Sexual Behavior - Average number of female sex partners in lifetime (males 18+)
Sexual Behavior - Average number of female vaginal sex partners in lifetime (males 18+)
Sexual Behavior - Average age people first performed oral sex on a woman (18+)
Sexual Behavior - Average number of woman performed oral sex on in lifetime (18+)
Sexual Behavior - Average number of male sex partners in lifetime (males 18+)
Sexual Behavior - Average number of male anal sex partners in lifetime (males 18+)
Sexual Behavior - Average age people first performed oral sex on a man (18+)
Sexual Behavior - Average number of male oral sex partners in lifetime (18+)
Sexual Behavior - People using protection when performing oral sex (%)
Sexual Behavior - Average number of times people have vaginal or anal sex a year
Sexual Behavior - People having sex without condom (%)
Sexual Behavior - Average number of male sex partners in lifetime (females 18+)
Sexual Behavior - Average number of male vaginal sex partners in lifetime (females 18+)
Sexual Behavior - Average number of female sex partners in lifetime (females 18+)
Sexual Behavior - Circumcised males 18+ (%)
Sleep Disorders - Average hours sleeping at night
Sleep Disorders - People that has trouble sleeping (%)
Smoking-Cigarette Use - People smoking cigarettes (%)
Taste & Smell - People 40+ having problems with smell (%)
Taste & Smell - People 40+ having problems with taste (%)
Taste & Smell - People 40+ that ever had wisdom teeth removed (%)
Taste & Smell - People 40+ that ever had tonsils teeth removed (%)
Taste & Smell - People 40+ that ever had a loss of consciousness because of a head injury (%)
Taste & Smell - People 40+ that ever had a broken nose or other serious injury to face or skull (%)
Taste & Smell - People 40+ that ever had two or more sinus infections (%)
Weight - Average height (inches)
Weight - Average weight (pounds)
Weight - Average BMI
Weight - People that are obese (%)
Weight - People that ever were obese (%)
Weight - People trying to lose weight (%)
100%
urban population.
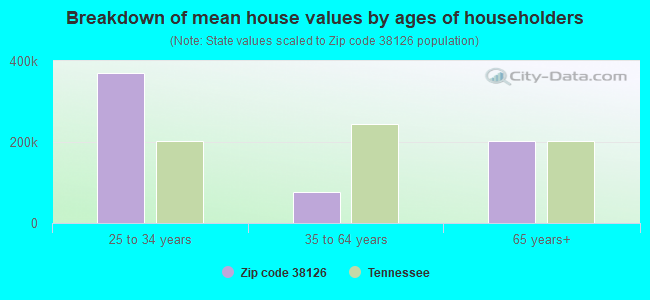
Estimated median house/condo value in 2022: $77,918
38126:
$77,918Tennessee:
$284,800
According to our research of Tennessee and other state lists, there were 21 registered sex offenders living in 38126 zip code as of April 24, 2024 . The ratio of all residents to sex offenders in zip code 38126 is 292 to 1.The ratio of registered sex offenders to all residents in this zip code is near the state average.
Median resident age: This zip code:
27.6 yearsTennessee median age:
39.2 years
Average household size: This zip code:
2.1 peopleTennessee:
2.4 people
Averages for the 2020 tax year for zip code 38126, filed in 2021:
Average Adjusted Gross Income (AGI) in 2020: $22,522 (Individual Income Tax Returns) Here:
$22,522State:
$69,014
Salary/wage: $20,673 (reported on 88.0% of returns )Here:
$20,673State:
$55,872
(% of AGI for various income ranges: 1119.7% for AGIs below $25k , 3333.3% for AGIs $25k-50k , 8505.0% for AGIs $50k-75k , 14035.0% for AGIs $75k-100k ) Taxable interest for individuals: $67 (reported on 2.6% of returns )This zip code:
$67Tennessee:
$1,945
(% of AGI for various income ranges: 0.5% for AGIs $25k-50k ) Profit/loss from business: +$2,381 (reported on 29.5% of returns )Here:
+$2,381State:
+$18,991
(% of AGI for various income ranges: 146.6% for AGIs below $25k ) Total itemized deductions: $23,325 (reported on 1.7% of returns )Here:
$23,325State:
$40,136
(% of AGI for various income ranges: 163.7% for AGIs $25k-50k ) Charity contributions: $8,133 (reported on 1.3% of returns )(% of AGI for various income ranges: 42.8% for AGIs $25k-50k ) Taxes paid: $3,067 (reported on 1.3% of returns )(% of AGI for various income ranges: 16.1% for AGIs $25k-50k ) Earned income credit: $3,378 (reported on 59.0% of returns )(% of AGI for various income ranges: 261.8% for AGIs below $25k , 174.7% for AGIs $25k-50k ) Percentage of individuals using paid preparers for their 2020 taxes: 94.4%(% for various income ranges: 94.8% for AGIs below $25k , 95.4% for AGIs $25k-50k , 88.9% for AGIs $50k-75k , 80.0% for AGIs $75k-100k )
Averages for the 2012 tax year for zip code 38126, filed in 2013:
Average Adjusted Gross Income (AGI) in 2012: $17,240 (Individual Income Tax Returns) Here:
$17,240State:
$53,767
Salary/wage: $16,795 (reported on 85.5% of returns )Here:
$16,795State:
$45,421
(% of AGI for various income ranges: 79.9% for AGIs below $25k , 94.8% for AGIs $25k-50k , 74.0% for AGIs $50k-75k ) Taxable interest for individuals: $100 (reported on 2.2% of returns )This zip code:
$100Tennessee:
$1,732
Profit/loss from business: +$5,589 (reported on 32.5% of returns )Here:
+$5,589State:
+$15,240
(% of AGI for various income ranges: 17.1% for AGIs below $25k ) Total itemized deductions: $14,029 (39% of AGI, reported on 6.1% of returns )Here:
$14,029State:
$21,976
Here:
39.0% of AGIState:
17.8% of AGI
(% of AGI for various income ranges: 1.6% for AGIs below $25k , 9.6% for AGIs $25k-50k , 12.4% for AGIs $50k-75k ) Charity contributions: $4,685 (reported on 5.7% of returns )(% of AGI for various income ranges: 0.5% for AGIs below $25k , 2.6% for AGIs $25k-50k , 4.9% for AGIs $50k-75k ) Taxes paid: $3,515 (reported on 5.7% of returns )(% of AGI for various income ranges: 0.6% for AGIs below $25k , 2.2% for AGIs $25k-50k , 1.5% for AGIs $50k-75k ) Earned income credit: $3,374 (reported on 69.7% of returns )(% of AGI for various income ranges: 21.0% for AGIs below $25k , 2.5% for AGIs $25k-50k ) Percentage of individuals using paid preparers for their 2012 taxes: 57.0%(% for various income ranges: 59.5% for AGIs below $25k , 43.8% for AGIs $25k-50k , 50.0% for AGIs $50k-75k )
Averages for the 2004 tax year for zip code 38126, filed in 2005:
Average Adjusted Gross Income (AGI) in 2004: $15,089 (Individual Income Tax Returns) Here:
$15,089State:
$44,088
Salary/wage: $14,743 (reported on 93.2% of returns )Here:
$14,743State:
$38,825
(% of AGI for various income ranges: 88.0% for AGIs below $10k , 91.5% for AGIs $10k-25k , 96.3% for AGIs $25k-50k , 76.6% for AGIs $50k-75k ) Taxable interest for individuals: $188 (reported on 3.3% of returns )This zip code:
$188Tennessee:
$1,802
(% of AGI for various income ranges: 0.1% for AGIs below $10k , 0.0% for AGIs $10k-25k , 0.1% for AGIs $25k-50k , 0.1% for AGIs $50k-75k ) Taxable dividends: $500 (reported on 0.7% of returns )Profit/loss from business: +$5,898 (reported on 9.2% of returns )Here:
+$5,898State:
+$12,882
Total itemized deductions: $13,585 (37% of AGI, reported on 5.5% of returns )Here:
$13,585State:
$18,035
Here:
36.8% of AGIState:
19.9% of AGI
Charity contributions deductions: $4,784 (13% of AGI, reported on 4.8% of returns )Here:
13.2% of AGIState:
5.3% of AGI
Total tax: $1,450 (reported on 33.1% of returns )(% of AGI for various income ranges: 1.5% for AGIs below $10k , 1.9% for AGIs $10k-25k , 4.4% for AGIs $25k-50k , 9.3% for AGIs $50k-75k ) Earned income credit: $2,365 (reported on 72.3% of returns )Percentage of individuals using paid preparers for their 2004 taxes: 72.9%(% for various income ranges: 72.8% for AGIs below $10k , 76.0% for AGIs $10k-25k , 62.4% for AGIs $25k-50k , 72.9% for AGIs $50k-75k )
Estimated median household income in 2022: This zip code:
$20,222Tennessee:
$65,254
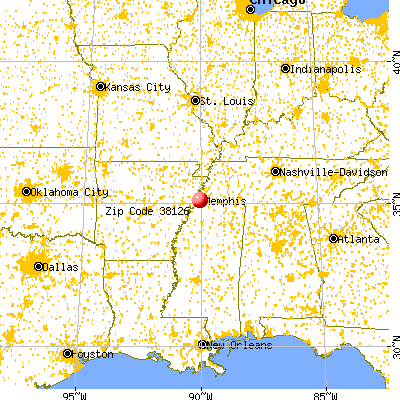
Nearest zip codes: 38105 ,
38103 ,
38104 ,
38107 ,
38106 ,
38114 .
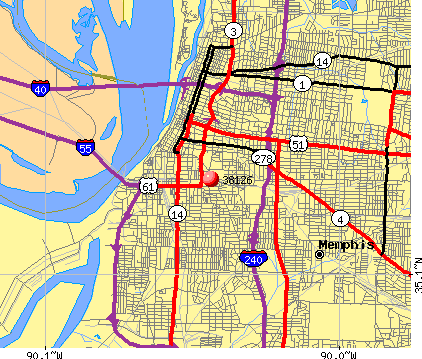
Memphis Zip Code Map
Percentage of family households: This zip code:
39.3%Tennessee:
46.2%
Percentage of households with unmarried partners: This zip code:
4.1%Tennessee:
47.1%
No gay or lesbian households reported
Household received Food Stamps/SNAP in the past 12 months: 1,229Household did not receive Food Stamps/SNAP in the past 12 months: 1,415
Women who had a birth in the past 12 months: 63 (0 now married , 60 unmarried) Women who did not have a birth in the past 12 months: 2,028 (167 now married , 1,859 unmarried)
Housing units in zip code 38126 with a mortgage: 102 (15
second mortgage )
Median monthly owner costs for units with a mortgage: $947
Median monthly owner costs for units without a mortgage: $421
Residents with income below the poverty level in 2022:
This zip code:
50.1%Whole state:
13.3%
Residents with income below 50% of the poverty level in 2022:
This zip code:
22.3%Whole state:
7.1%
Median number of rooms in houses and condos: Median number of rooms in apartments: Notable locations in this zip code not listed on our city pages
Click to draw/clear zip code borders Notable locations in zip code 38126: (A) , Greater Mount Moriah Archie L Rice Center (B) , Goodman Family Residence Hall (C) , Cornelia Crenshaw Branch Memphis Public Library (D) , African Methodist Episcopal Department of Church Growth and Development Building (E) , City of Memphis Division of Fire Station 8 (F) , Gaston Park Branch Library (G) . Display/hide their locations on the map
Churches in zip code 38126 include: (A) , Praise of Zion Baptist Church (B) , Progressive Baptist Church (C) , Bethel United Presbyterian Church (D) , Bible Day Revival Church (E) , Blessed Trinity Baptist Church (F) , Christ Temple Church of Christ (G) , Cross Temple Church of God in Christ (H) , Emmanuel Episcopal Church (I) . Display/hide their locations on the map
Streams, rivers, and creeks: (A) . Display/hide its location on the map
Parks in zip code 38126 include: (1) , Navy Park (2) , Foote Homes Park (3) . Display/hide their locations on the map
Tourist attractions (not listed on the city page) :
Year house built (houses)
0 2020 or later976 2010 to 2019478 2000 to 2009162 1990 to 199997 1980 to 1989140 1970 to 1979138 1960 to 1969681 1950 to 1959380 1940 to 1949154 1939 or earlier
Zip code 38126 household income distribution in 2022 528 Less than $10,000594 $10,000 to $14,999196 $15,000 to $19,999118 $20,000 to $24,999110 $25,000 to $29,999146 $30,000 to $34,999188 $35,000 to $39,99942 $40,000 to $44,99950 $45,000 to $49,999336 $50,000 to $59,999135 $60,000 to $74,999119 $75,000 to $99,99931 $100,000 to $124,99911 $125,000 to $149,99927 $150,000 to $199,999Estimate of home value of owner-occupied houses/condos in 2022 in zip code 38126 13 $10,000 to $14,99939 $15,000 to $19,99925 $20,000 to $24,9996 $25,000 to $29,9998 $30,000 to $34,99910 $40,000 to $49,99919 $50,000 to $59,99954 $60,000 to $69,9998 $70,000 to $79,99912 $80,000 to $89,99921 $100,000 to $124,99913 $125,000 to $149,99921 $150,000 to $174,9993 $175,000 to $199,9998 $400,000 to $499,99917 $500,000 to $749,999Rent paid by renters in 2022 in zip code 38126 55 Less than $10032 $100 to $149135 $150 to $199121 $200 to $249175 $250 to $29952 $300 to $34977 $350 to $39989 $400 to $449292 $450 to $499144 $500 to $54946 $550 to $59986 $600 to $64991 $650 to $69965 $700 to $749228 $750 to $79958 $800 to $899153 $900 to $99986 $1,000 to $1,249117 $1,250 to $1,4993 $1,500 to $1,9996 No cash rent
Median gross rent in 2022: $789.
Median price asked for vacant for-sale houses and condos in 2022: $112,188.
Estimated median house (or condo) value in 2022 for: Black or African American householders: $76,355Asian householders: $133,964Estimated median house or condo value in 2022: $77,918
38126:
$77,918Tennessee:
$284,800
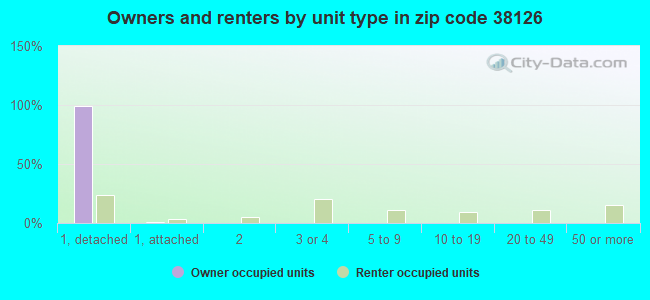
Mean price in 2022: Detached houses: $260,126Here:
$260,126State:
$374,382
Townhouses or other attached units: $293,298Here:
$293,298State:
$354,101
In 2-unit structures: $261,499Here:
$261,499State:
$247,693
In 3-to-4-unit structures: $101,791Here:
$101,791State:
$239,060
In 5-or-more-unit structures: $229,265Here:
$229,265State:
$317,434
Mobile homes: $169,958Here:
$169,958State:
$101,421
Occupied boats, RVs, vans, etc.: $194,150Here:
$194,150State:
$142,822
Housing units in structures:
One, detached: 1,119One, attached: 131Two: 1133 or 4: 5215 to 9: 28610 to 19: 31520 to 49: 27650 or more: 456Unemployment : 7.6%
Means of transportation to work in zip code 38126 74.1% 1,349 Drove a car alone9.0% 164 Carpooled2.6% 48 Bus or trolley bus0.3% 6 Taxi6.1% 111 Walked0.5% 9 Other means3.7% 67 Worked at homeTravel time to work (commute) in zip code 38126 12 Less than 5 minutes261 5 to 9 minutes174 10 to 14 minutes149 15 to 19 minutes847 20 to 24 minutes53 25 to 29 minutes139 30 to 34 minutes6 35 to 39 minutes50 40 to 44 minutes5 90 or more minutes
Neighborhoods in zip code 38126: Percentage of zip code residents living and working in this county: 98.3%
Household type by relationship:
Households: 6,145
Male householders: 722 (427 living alone ), Female householders: 1,983 (863 living alone )176 spouses (126 opposite-sex spouses ), 46 unmarried partners , (46 opposite-sex unmarried partners ), 2,191 children (2,049 natural , 75 adopted , 70 stepchildren ), 331 grandchildren , 59 brothers or sisters , 46 parents , 0 foster children , 155 other relatives , 66 non-relatives In group quarters: 348 (-1 institutionalized population )
Size of family households: 553 2-persons , 392 3-persons , 144 4-persons , 117 5-persons , 71 6-persons , 14 7-or-more-persons
Size of nonfamily households: 1,297 1-person , 95 2-persons
27 married couples with children. single-parent households (92 men , 1,364 women ).
97.2% of residents of 38126 zip code speak English at home. of residents speak Spanish at home (100% very well ).of residents speak other Indo-European language at home (100% very well ).of residents speak other language at home (100% very well ).
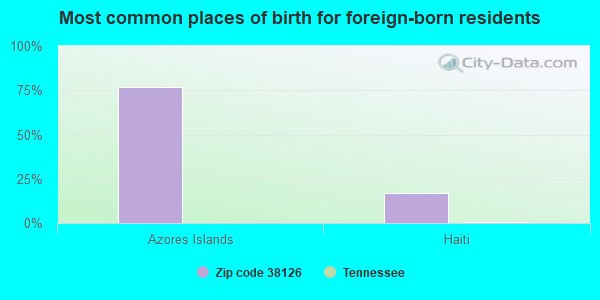
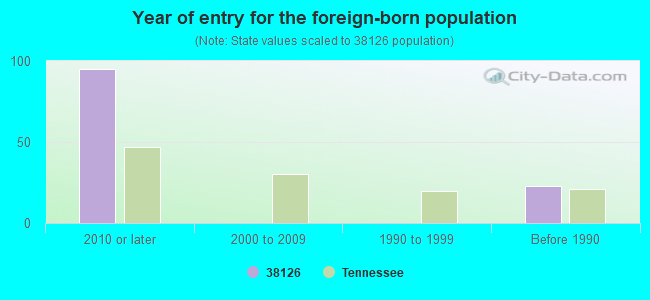
Foreign born population: 65 (1.1%)
(0.0%
of them are naturalized citizens )
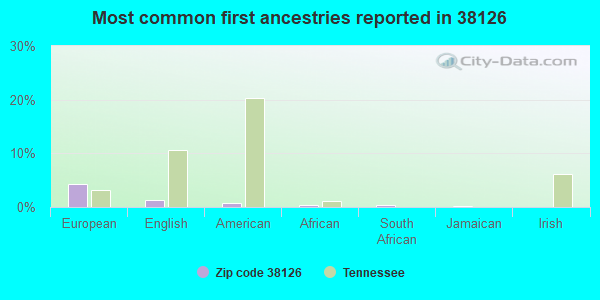
77% Azores Islands 17% Haiti 4% European 1% English 1% American 0% African 0% South African 0% Jamaican 0% Irish
Year of entry for the foreign-born population
95 2010 or later 0 2000 to 2009 0 1990 to 1999 23 Before 1990
There are
74 Medical Specialists in Zip Code 38126 .
Facilities with environmental interests located in this zip code:
B T WASHINGTON HIGH SCHOOL (715 SO LAUDERDALE in MEMPHIS, TN)
(National Center for Education Statistics) - STATE ID-0030 (Resource Conservation and Recovery Act (tracking hazardous waste)) Organizations: MEMPHIS CITY SCHOOL DISTRICT (SCHOOL DISTRICT)
Alternative names: MEMPHIS CITY SCHOOLS-BOOKER T WASHINGTON
CAR QUEST MEMPHIS (575 PHELAN AVE in MEMPHIS, TN)
(Resource Conservation and Recovery Act (tracking hazardous waste)) Organizations: CHARLES P LEDING (CONTACT/OPERATOR)
COLOR CRAFT PREFINISHED MOLDINGS CO. (575 SUZETTE in MEMPHIS, TN)
(Resource Conservation and Recovery Act (tracking hazardous waste)) TRI REPORTER (Tracking of toxic chemicals releasing facilities) Business SIC classification: MILLWORK
A C C REBUILDERS INC (853 CRUMP BOULEVARD in MEMPHIS, TN)
Small Quantity Generators, between 100 kg and 1000 kg of hazardous waste/month (Resource Conservation and Recovery Act (tracking hazardous waste)) Organizations: RONALD M CHAINES (CONTACT/OPERATOR)
, A C C BUILDERS (CONTACT/OWNER)
ACCARDI JOE & CO (586 HERNANDO in MEMPHIS, TN)
(Resource Conservation and Recovery Act (tracking hazardous waste)) Business NAICS classification: APPLIANCE REPAIR AND MAINTENANCE.
ALLIED INDUSTRIAL TRUCK SERVICE, INC (267 E E H CRUMP BLVD in MEMPHIS, TN)
(Resource Conservation and Recovery Act (tracking hazardous waste)) Business NAICS classification: GENERAL AUTOMOTIVE REPAIR.
AMOCO OIL SS# 327 (843 MISSISSIPPI BLVD in MEMPHIS, TN)
(Resource Conservation and Recovery Act (tracking hazardous waste)) Business NAICS classification: OTHER FUEL DEALERS.
CIRCLE C PRINTING CO (PO BOX 200 in MEMPHIS, TN)
(Resource Conservation and Recovery Act (tracking hazardous waste)) Business NAICS classification: COMMERCIAL GRAVURE PRINTING.
COLE JACK DIXIE HIGHWAY CO* (857 E GEORGIA in MEMPHIS, TN)
(Resource Conservation and Recovery Act (tracking hazardous waste))
COLONIAL REFRIGERATED TRANSP* (584 S THIRD ST in MEMPHIS, TN)
(Resource Conservation and Recovery Act (tracking hazardous waste))
DEWS GAS & MARKET (630 S 3RD ST in MEMPHIS, TN)
(Resource Conservation and Recovery Act (tracking hazardous waste)) Business NAICS classification: OTHER FUEL DEALERS.
CADY INDUSTRIES INC (711 LINDEN in MEMPHIS, TN)
Conditionally Exempt Small Quantity Generators, less than 100 kg/month of hazardous waste (Resource Conservation and Recovery Act (tracking hazardous waste)) - notification Business NAICS classification: TEXTILE BAG MILLS.
Housing units lacking complete plumbing facilities: 7.2%
Housing units lacking complete kitchen facilities: 10.8%
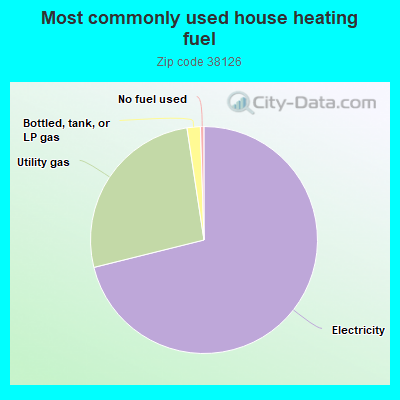
71.2% Electricity 26.5% Utility gas 1.9% Bottled, tank, or LP gas 0.5% No fuel used
Population in 1990: 16,391.
Place of birth for U.S.-born residents:
This state: 4,614Northeast: 21Midwest: 343South: 930West: 57
54% of the 38126 zip code residents lived in the same house 5 years ago.
Out of people who lived in different houses, 86% lived in this county.
Out of people who lived in different counties, 50% lived in Tennessee.
87% of the 38126 zip code residents lived in the same house 1 year ago.
Out of people who lived in different houses, 81% moved from this county.
Out of people who lived in different houses, 7% moved from different county within same state.
Out of people who lived in different houses, 4% moved from different state.
Private vs. public school enrollment:
Students in private schools in grades 1 to 8 (elementary and middle school): 39
Students in private schools in grades 9 to 12 (high school):
Students in private undergraduate colleges: 252
Here:
88.9%Tennessee:
23.5%
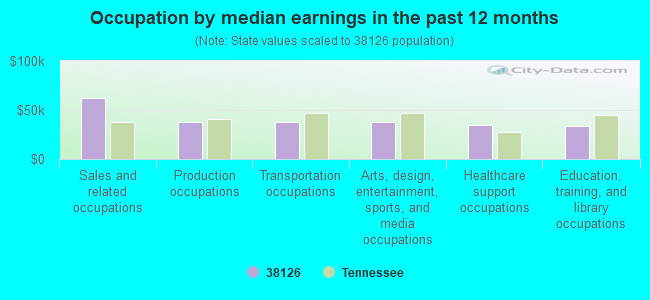
Occupation by median earnings in the past 12 months ($)
62,437 Sales and related occupations 37,984 Production occupations 37,719 Transportation occupations 37,684 Arts, design, entertainment, sports, and media occupations 35,140 Healthcare support occupations 33,738 Education, training, and library occupations
Companies with federal contracts located in this zip code (MEMPHIS, TN):
TRI-STATE MACK, INC (494 E H CRUMP BLVD; small business) in 20 contracts from 2001 to 2006
Contracts for Miscellaneous Construction Equipment, Maintenance, Repair and Rebuilding of Equipment -- Ground Effect Vehicles, Motor Vehicles, Trailers, and Cycles, Lease or Rental of Equipment -- Construction, Mining, Excavating, and Highway Maintenance Equipment by Defense Logistics Agency, U.S. Army Corps of Engineers - civil program financing only, ArmySigned by year: 2000: $0; 2001: $169,820; 2002: $15,931; 2003: $7,500; 2004: -$952; 2005: -$18,649; 2006: -$168.
Biggest contracts: with Defense Logistics Agency for Miscellaneous Construction Equipment. Signed on 2001-09-28. Completion date: 2001-11-27.
, same as above. Signed on 2001-09-28. Completion date: 2001-11-27.
with U.S. Army Corps of Engineers - civil program financing only for Maintenance, Repair and Rebuilding of Equipment -- Ground Effect Vehicles, Motor Vehicles, Trailers, and Cycles. Signed on 2002-08-30. Completion date: 2002-07-02.
with U.S. Army Corps of Engineers - civil program financing only for Lease or Rental of Equipment -- Construction, Mining, Excavating, and Highway Maintenance Equipment. Signed on 2002-05-13. Completion date: 2002-03-28.
SOUTHERN CAB CORPORATION (581 S 2ND ST; small business)
$76,341 with U.S. Army Corps of Engineers - civil program financing only for Motor Passenger Services. Signed on 1999-10-29. Completion date: 2000-09-22.
MACGRIFF INC (870 VANCE AVE; small business)
$36,120 with Army for Food Items For Resale. Signed on 2002-08-29. Completion date: 2002-09-07.
AMERIPRIDE SERVICES, INC (830 VANCE AVE) in 2 contracts in 2005
$3,433 with Defense Commissary Agency for Lease or Rental of Equipment -- Clothing, Individual Equipment, and Insignia. Signed on 2005-03-07. Completion date: 2005-05-29.
with Navy for Laundry and DryCleaning Services. Signed on 2005-01-03. Completion date: 2005-09-30.
Top industries in this zip code by the number of employees in 2005:
Wholesale Trade: Industrial Supplies Merchant Wholesalers (250-499 employees: 1 establishment, 50-99 employees: 1 establishment)Other Services (except Public Administration): Religious Organizations (50-99: 1, 20-49: 1, 10-19: 4, 5-9: 3, 1-4: 6)Health Care and Social Assistance: Outpatient Mental Health and Substance Abuse Centers (100-249: 1, 20-49: 1)Administrative and Support and Waste Management and Remediation Services: Armored Car Services (100-249: 1)Other Services (except Public Administration): Linen Supply (100-249: 1)Health Care and Social Assistance: Other Individual and Family Services (100-249: 1)Educational Services: Colleges, Universities, and Professional Schools (100-249: 1)Construction: Electrical Contractors (50-99: 2, 10-19: 1)Other Services (except Public Administration): Civic and Social Organizations (50-99: 1, 20-49: 2)Wholesale Trade: Motor Vehicle Supplies and New Parts Merchant Wholesalers (50-99: 1, 5-9: 1)
People in group quarters in 2010:
242 people in college/university student housing
151 people in other noninstitutional facilities
122 people in emergency and transitional shelters (with sleeping facilities) for people experiencing homelessness
40 people in group homes intended for adults
People in group quarters in 2000:
187 people in other noninstitutional group quarters
125 people in college dormitories (includes college quarters off campus)
34 people in homes for the mentally ill
3 people in religious group quarters
Fatal accident statistics in 2012:
Fatal accident count: 2Vehicles involved in fatal accidents: 4Fatal accidents caused by drunken drivers: 0Fatalities: 3Persons involved in fatal accidents: 8Pedestrians involved in fatal accidents: 0
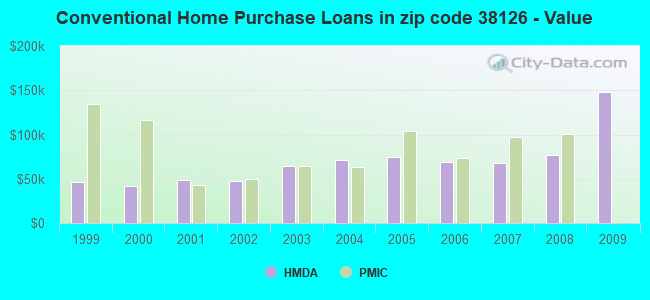
Home Mortgage Disclosure Act Aggregated Statistics For Year 2009(Based on 6 full and 12 partial tracts) A) FHA, FSA/RHS & VA B) Conventional C) Refinancings D) Home Improvement Loans F) Non-occupant Loans on Number Average Value Number Average Value Number Average Value Number Average Value Number Average Value
LOANS ORIGINATED 1 $158,240 4 $147,758 12 $117,706 0 $0 8 $39,636 APPLICATIONS APPROVED, NOT ACCEPTED 0 $0 0 $0 5 $43,408 4 $39,485 0 $0 APPLICATIONS DENIED 2 $79,550 8 $68,571 22 $64,093 4 $13,258 5 $53,106 APPLICATIONS WITHDRAWN 0 $0 2 $185,090 10 $76,489 0 $0 3 $107,530 FILES CLOSED FOR INCOMPLETENESS 1 $245,000 0 $0 2 $42,475 2 $69,970 0 $0
Aggregated Statistics For Year 2008(Based on 6 full and 12 partial tracts) A) FHA, FSA/RHS & VA B) Conventional C) Refinancings D) Home Improvement Loans E) Loans on Dwellings For 5+ Families F) Non-occupant Loans on G) Loans On Manufactured Number Average Value Number Average Value Number Average Value Number Average Value Number Average Value Number Average Value Number Average Value
LOANS ORIGINATED 6 $97,940 15 $77,232 8 $67,741 3 $43,510 2 $120,880 11 $43,885 0 $0 APPLICATIONS APPROVED, NOT ACCEPTED 0 $0 2 $123,990 3 $74,067 2 $32,090 0 $0 4 $46,352 0 $0 APPLICATIONS DENIED 9 $89,947 16 $76,653 50 $57,051 20 $33,138 0 $0 17 $40,312 1 $98,010 APPLICATIONS WITHDRAWN 3 $79,987 1 $51,790 13 $79,765 0 $0 2 $157,260 3 $48,350 0 $0 FILES CLOSED FOR INCOMPLETENESS 0 $0 1 $222,000 0 $0 0 $0 0 $0 0 $0 0 $0
Aggregated Statistics For Year 2007(Based on 6 full and 12 partial tracts) A) FHA, FSA/RHS & VA B) Conventional C) Refinancings D) Home Improvement Loans E) Loans on Dwellings For 5+ Families F) Non-occupant Loans on G) Loans On Manufactured Number Average Value Number Average Value Number Average Value Number Average Value Number Average Value Number Average Value Number Average Value
LOANS ORIGINATED 0 $0 52 $67,392 24 $69,297 7 $31,000 3 $136,193 44 $64,249 0 $0 APPLICATIONS APPROVED, NOT ACCEPTED 0 $0 6 $55,513 17 $76,620 0 $0 0 $0 3 $62,593 0 $0 APPLICATIONS DENIED 2 $49,450 62 $133,649 91 $70,331 19 $39,908 1 $187,750 42 $72,155 1 $120,840 APPLICATIONS WITHDRAWN 0 $0 11 $299,134 12 $71,845 3 $11,020 0 $0 10 $59,529 0 $0 FILES CLOSED FOR INCOMPLETENESS 0 $0 9 $338,193 9 $64,927 0 $0 0 $0 10 $292,386 0 $0
Aggregated Statistics For Year 2006(Based on 6 full and 12 partial tracts) A) FHA, FSA/RHS & VA B) Conventional C) Refinancings D) Home Improvement Loans E) Loans on Dwellings For 5+ Families F) Non-occupant Loans on G) Loans On Manufactured Number Average Value Number Average Value Number Average Value Number Average Value Number Average Value Number Average Value Number Average Value
LOANS ORIGINATED 4 $61,338 71 $69,042 58 $59,343 6 $42,475 2 $147,315 67 $56,567 0 $0 APPLICATIONS APPROVED, NOT ACCEPTED 0 $0 13 $70,865 19 $64,937 0 $0 0 $0 9 $67,056 0 $0 APPLICATIONS DENIED 0 $0 64 $65,495 89 $90,354 28 $20,330 1 $284,000 57 $76,705 2 $33,985 APPLICATIONS WITHDRAWN 2 $85,590 21 $68,827 30 $80,770 2 $15,215 0 $0 7 $63,574 0 $0 FILES CLOSED FOR INCOMPLETENESS 0 $0 9 $65,966 13 $76,145 0 $0 0 $0 6 $65,922 0 $0
Aggregated Statistics For Year 2005(Based on 6 full and 12 partial tracts) A) FHA, FSA/RHS & VA B) Conventional C) Refinancings D) Home Improvement Loans E) Loans on Dwellings For 5+ Families F) Non-occupant Loans on G) Loans On Manufactured Number Average Value Number Average Value Number Average Value Number Average Value Number Average Value Number Average Value Number Average Value
LOANS ORIGINATED 39 $60,010 94 $74,103 58 $76,822 5 $43,864 5 $215,558 70 $64,898 0 $0 APPLICATIONS APPROVED, NOT ACCEPTED 0 $0 15 $69,519 24 $86,185 0 $0 0 $0 10 $64,933 0 $0 APPLICATIONS DENIED 5 $67,532 74 $71,392 139 $65,780 28 $16,636 1 $1,815,200 49 $56,609 2 $17,995 APPLICATIONS WITHDRAWN 2 $53,255 59 $98,939 48 $94,805 8 $75,472 0 $0 24 $60,319 0 $0 FILES CLOSED FOR INCOMPLETENESS 0 $0 4 $111,805 12 $83,021 0 $0 0 $0 0 $0 0 $0
Aggregated Statistics For Year 2004(Based on 6 full and 12 partial tracts) A) FHA, FSA/RHS & VA B) Conventional C) Refinancings D) Home Improvement Loans E) Loans on Dwellings For 5+ Families F) Non-occupant Loans on Number Average Value Number Average Value Number Average Value Number Average Value Number Average Value Number Average Value
LOANS ORIGINATED 65 $60,267 45 $71,003 67 $57,385 8 $50,102 2 $232,730 44 $63,987 APPLICATIONS APPROVED, NOT ACCEPTED 4 $61,815 27 $54,910 30 $56,905 1 $7,670 0 $0 20 $49,735 APPLICATIONS DENIED 10 $56,401 53 $62,858 94 $54,573 18 $23,439 0 $0 49 $52,006 APPLICATIONS WITHDRAWN 2 $66,175 10 $83,988 39 $60,123 0 $0 2 $134,155 10 $77,485 FILES CLOSED FOR INCOMPLETENESS 0 $0 4 $72,458 11 $78,487 0 $0 0 $0 4 $60,272
Aggregated Statistics For Year 2003(Based on 6 full and 12 partial tracts) A) FHA, FSA/RHS & VA B) Conventional C) Refinancings D) Home Improvement Loans E) Loans on Dwellings For 5+ Families F) Non-occupant Loans on Number Average Value Number Average Value Number Average Value Number Average Value Number Average Value Number Average Value
LOANS ORIGINATED 11 $58,617 29 $64,446 56 $77,605 4 $40,985 0 $0 46 $49,291 APPLICATIONS APPROVED, NOT ACCEPTED 0 $0 14 $62,736 23 $53,637 2 $29,910 2 $75,970 8 $53,621 APPLICATIONS DENIED 1 $140,000 23 $52,670 121 $52,885 10 $9,801 1 $142,000 40 $41,464 APPLICATIONS WITHDRAWN 0 $0 12 $107,647 32 $57,235 2 $43,980 0 $0 6 $54,982 FILES CLOSED FOR INCOMPLETENESS 0 $0 5 $95,052 5 $55,654 0 $0 0 $0 2 $32,240
Aggregated Statistics For Year 2002(Based on 6 full and 12 partial tracts) A) FHA, FSA/RHS & VA B) Conventional C) Refinancings D) Home Improvement Loans E) Loans on Dwellings For 5+ Families F) Non-occupant Loans on Number Average Value Number Average Value Number Average Value Number Average Value Number Average Value Number Average Value
LOANS ORIGINATED 10 $81,091 55 $47,415 53 $54,274 12 $15,712 5 $1,622,926 55 $41,415 APPLICATIONS APPROVED, NOT ACCEPTED 0 $0 19 $64,712 32 $62,438 1 $40,280 0 $0 18 $47,010 APPLICATIONS DENIED 0 $0 41 $58,628 102 $56,388 3 $64,843 0 $0 25 $49,019 APPLICATIONS WITHDRAWN 0 $0 25 $57,860 47 $62,707 2 $14,995 0 $0 14 $51,551 FILES CLOSED FOR INCOMPLETENESS 0 $0 4 $89,825 10 $73,209 0 $0 0 $0 4 $45,675
Aggregated Statistics For Year 2001(Based on 6 full and 12 partial tracts) A) FHA, FSA/RHS & VA B) Conventional C) Refinancings D) Home Improvement Loans E) Loans on Dwellings For 5+ Families F) Non-occupant Loans on Number Average Value Number Average Value Number Average Value Number Average Value Number Average Value Number Average Value
LOANS ORIGINATED 6 $64,540 42 $48,388 65 $49,307 12 $20,656 3 $184,360 46 $44,114 APPLICATIONS APPROVED, NOT ACCEPTED 0 $0 11 $74,465 21 $50,586 7 $17,130 7 $101,251 9 $59,086 APPLICATIONS DENIED 2 $84,975 39 $52,467 114 $48,667 18 $20,016 0 $0 23 $45,356 APPLICATIONS WITHDRAWN 2 $88,620 10 $36,190 44 $55,098 3 $36,467 2 $58,970 15 $72,458 FILES CLOSED FOR INCOMPLETENESS 0 $0 3 $71,673 6 $55,332 0 $0 0 $0 2 $54,510
Aggregated Statistics For Year 2000(Based on 6 full and 12 partial tracts) A) FHA, FSA/RHS & VA B) Conventional C) Refinancings D) Home Improvement Loans E) Loans on Dwellings For 5+ Families F) Non-occupant Loans on Number Average Value Number Average Value Number Average Value Number Average Value Number Average Value Number Average Value
LOANS ORIGINATED 13 $50,998 43 $41,635 58 $40,482 17 $60,912 1 $229,440 45 $51,663 APPLICATIONS APPROVED, NOT ACCEPTED 0 $0 28 $42,971 43 $41,655 13 $9,061 0 $0 23 $38,610 APPLICATIONS DENIED 3 $62,897 63 $52,416 131 $45,865 47 $18,139 0 $0 52 $48,169 APPLICATIONS WITHDRAWN 0 $0 26 $52,859 36 $36,448 4 $29,240 0 $0 10 $37,751 FILES CLOSED FOR INCOMPLETENESS 0 $0 8 $55,779 22 $45,540 0 $0 0 $0 7 $41,577
Aggregated Statistics For Year 1999(Based on 4 full and 6 partial tracts) A) FHA, FSA/RHS & VA B) Conventional C) Refinancings D) Home Improvement Loans E) Loans on Dwellings For 5+ Families F) Non-occupant Loans on Number Average Value Number Average Value Number Average Value Number Average Value Number Average Value Number Average Value
LOANS ORIGINATED 4 $50,778 21 $46,888 35 $53,415 8 $15,181 2 $5,041,750 22 $53,765 APPLICATIONS APPROVED, NOT ACCEPTED 0 $0 10 $41,406 26 $37,869 5 $19,206 0 $0 7 $37,399 APPLICATIONS DENIED 3 $58,397 28 $41,060 65 $40,793 18 $16,178 0 $0 17 $38,925 APPLICATIONS WITHDRAWN 1 $57,000 11 $47,255 27 $40,761 0 $0 0 $0 8 $44,051 FILES CLOSED FOR INCOMPLETENESS 0 $0 5 $58,956 11 $43,318 0 $0 0 $0 0 $0
Private Mortgage Insurance Companies Aggregated Statistics For Year 2008(Based on 4 full and 10 partial tracts) A) Conventional B) Refinancings C) Non-occupant Loans on Number Average Value Number Average Value Number Average Value
LOANS ORIGINATED 6 $100,242 0 $0 0 $0 APPLICATIONS APPROVED, NOT ACCEPTED 6 $162,028 1 $112,000 1 $268,520 APPLICATIONS DENIED 4 $47,025 0 $0 2 $51,590 APPLICATIONS WITHDRAWN 0 $0 0 $0 0 $0 FILES CLOSED FOR INCOMPLETENESS 0 $0 0 $0 0 $0
Aggregated Statistics For Year 2007(Based on 4 full and 12 partial tracts) A) Conventional C) Non-occupant Loans on Number Average Value Number Average Value
LOANS ORIGINATED 15 $97,288 6 $77,165 APPLICATIONS APPROVED, NOT ACCEPTED 3 $110,440 0 $0 APPLICATIONS DENIED 0 $0 0 $0 APPLICATIONS WITHDRAWN 0 $0 0 $0 FILES CLOSED FOR INCOMPLETENESS 0 $0 0 $0
Aggregated Statistics For Year 2006(Based on 5 full and 12 partial tracts) A) Conventional B) Refinancings C) Non-occupant Loans on Number Average Value Number Average Value Number Average Value
LOANS ORIGINATED 8 $74,006 7 $67,489 9 $60,937 APPLICATIONS APPROVED, NOT ACCEPTED 1 $122,790 0 $0 0 $0 APPLICATIONS DENIED 2 $62,975 0 $0 0 $0 APPLICATIONS WITHDRAWN 0 $0 2 $131,310 0 $0 FILES CLOSED FOR INCOMPLETENESS 0 $0 0 $0 0 $0
Aggregated Statistics For Year 2005(Based on 3 full and 10 partial tracts) A) Conventional B) Refinancings C) Non-occupant Loans on Number Average Value Number Average Value Number Average Value
LOANS ORIGINATED 8 $104,448 2 $175,855 3 $131,387 APPLICATIONS APPROVED, NOT ACCEPTED 3 $156,333 8 $107,352 0 $0 APPLICATIONS DENIED 0 $0 0 $0 0 $0 APPLICATIONS WITHDRAWN 0 $0 3 $154,513 0 $0 FILES CLOSED FOR INCOMPLETENESS 0 $0 0 $0 0 $0
Aggregated Statistics For Year 2004(Based on 5 full and 10 partial tracts) A) Conventional B) Refinancings C) Non-occupant Loans on Number Average Value Number Average Value Number Average Value
LOANS ORIGINATED 9 $63,273 4 $51,692 2 $102,730 APPLICATIONS APPROVED, NOT ACCEPTED 5 $125,050 0 $0 3 $51,080 APPLICATIONS DENIED 0 $0 1 $78,410 1 $78,410 APPLICATIONS WITHDRAWN 0 $0 0 $0 0 $0 FILES CLOSED FOR INCOMPLETENESS 0 $0 0 $0 0 $0
Aggregated Statistics For Year 2003(Based on 4 full and 10 partial tracts) A) Conventional B) Refinancings C) Non-occupant Loans on Number Average Value Number Average Value Number Average Value
LOANS ORIGINATED 5 $64,688 11 $67,045 11 $47,985 APPLICATIONS APPROVED, NOT ACCEPTED 3 $104,247 4 $60,978 3 $75,237 APPLICATIONS DENIED 0 $0 0 $0 0 $0 APPLICATIONS WITHDRAWN 0 $0 2 $55,040 0 $0 FILES CLOSED FOR INCOMPLETENESS 0 $0 0 $0 0 $0
Aggregated Statistics For Year 2002(Based on 5 full and 10 partial tracts) A) Conventional B) Refinancings C) Non-occupant Loans on Number Average Value Number Average Value Number Average Value
LOANS ORIGINATED 8 $50,009 8 $54,545 11 $50,082 APPLICATIONS APPROVED, NOT ACCEPTED 4 $37,352 3 $49,627 2 $27,805 APPLICATIONS DENIED 0 $0 3 $40,440 1 $42,690 APPLICATIONS WITHDRAWN 0 $0 3 $51,897 3 $51,897 FILES CLOSED FOR INCOMPLETENESS 2 $48,790 2 $51,355 4 $50,072
Aggregated Statistics For Year 2001(Based on 4 full and 6 partial tracts) A) Conventional B) Refinancings C) Non-occupant Loans on Number Average Value Number Average Value Number Average Value
LOANS ORIGINATED 4 $43,362 16 $50,886 17 $49,301 APPLICATIONS APPROVED, NOT ACCEPTED 0 $0 0 $0 0 $0 APPLICATIONS DENIED 0 $0 2 $48,400 2 $48,400 APPLICATIONS WITHDRAWN 0 $0 0 $0 0 $0 FILES CLOSED FOR INCOMPLETENESS 0 $0 0 $0 0 $0
Aggregated Statistics For Year 2000(Based on 4 full and 8 partial tracts) A) Conventional B) Refinancings C) Non-occupant Loans on Number Average Value Number Average Value Number Average Value
LOANS ORIGINATED 4 $116,890 3 $81,687 2 $39,630 APPLICATIONS APPROVED, NOT ACCEPTED 0 $0 1 $42,590 0 $0 APPLICATIONS DENIED 0 $0 0 $0 0 $0 APPLICATIONS WITHDRAWN 0 $0 0 $0 0 $0 FILES CLOSED FOR INCOMPLETENESS 0 $0 0 $0 0 $0
Aggregated Statistics For Year 1999(Based on 2 full and 3 partial tracts) A) Conventional B) Refinancings C) Non-occupant Loans on Number Average Value Number Average Value Number Average Value
LOANS ORIGINATED 1 $134,430 3 $70,477 2 $34,690 APPLICATIONS APPROVED, NOT ACCEPTED 1 $95,860 0 $0 0 $0 APPLICATIONS DENIED 0 $0 2 $40,070 1 $78,060 APPLICATIONS WITHDRAWN 0 $0 0 $0 0 $0 FILES CLOSED FOR INCOMPLETENESS 0 $0 0 $0 0 $0
2002 - 2018 National Fire Incident Reporting System (NFIRS) incidents See full 2006 National Fire Incident Reporting System statistics for zip code 38126, Tennessee
Most common first names in zip code 38126 among deceased individuals Name Count Lived (average)
Willie 180 68.5 years James 158 67.3 years Mary 146 74.6 years John 122 69.6 years Robert 117 69.3 years George 96 71.7 years William 83 70.9 years Annie 66 76.9 years Henry 65 70.9 years Jessie 51 70.5 years
Most common last names in zip code 38126 among deceased individuals Last name Count Lived (average)
Williams 177 70.7 years Jones 131 70.7 years Smith 116 69.8 years Johnson 109 72.8 years Brown 77 70.8 years Harris 69 66.9 years Davis 67 69.1 years Jackson 67 70.4 years Thomas 60 71.4 years Taylor 54 70.0 years
Businesses in zip code 38126


 Nearest zip codes: 38105, 38103, 38104, 38107, 38106, 38114.
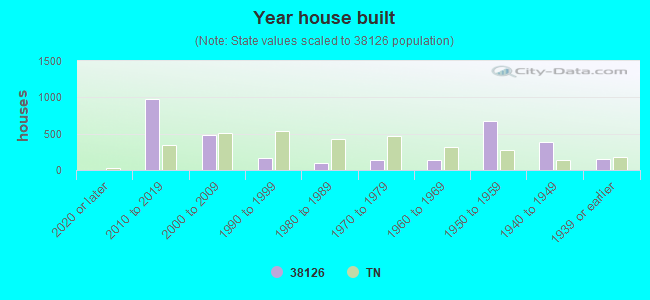


 According to the data from the years 2002 - 2018 the average number of fire incidents per year is 51. The highest number of fires - 103 took place in 2010, and the least - 14 in 2004. The data has a growing trend.
 When looking into fire subcategories, the most incidents belonged to: Structure Fires (40.7%), and Outside Fires (31.5%).