Estimated zip code population in 2022: 6,647 Zip code population in 2010: 6,145 Zip code population in 2000: 5,508
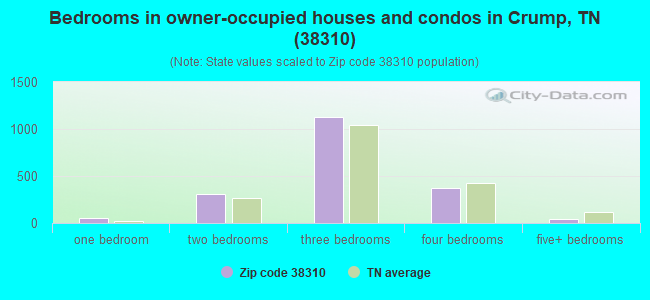
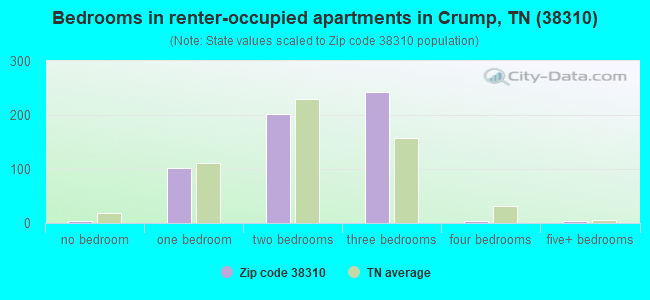
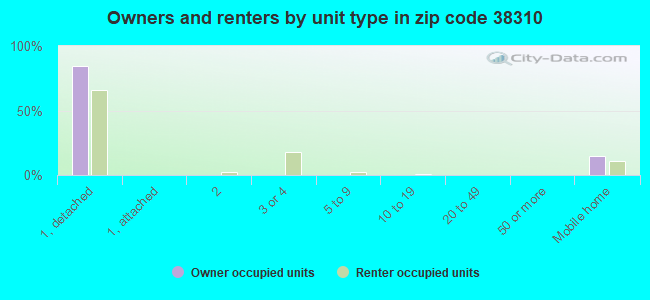
Houses and condos: 3,101 Renter-occupied apartments: 563
% of renters here:
23%
State:
33%
March 2022 cost of living index in zip code 38310: 79.2 (low, U.S. average is 100)
Land area: 114.1 sq. mi. Water area: 0.5 sq. mi.
Population density: 58 people per square mile
(very low).
OSM Map
General Map
Google Map
MSN Map
OSM Map
General Map
Google Map
MSN Map
OSM Map
General Map
Google Map
MSN Map
OSM Map
General Map
Google Map
MSN Map
Please wait while loading the map...
Real estate property taxes paid for housing units in 2022:
This zip code:
0.4% ($572)
Tennessee:
0.5% ($1,376)
Median real estate property taxes paid for housing units with mortgages in 2022: $598 (0.3%) Median real estate property taxes paid for housing units with no mortgage in 2022: $545 (0.4%)
Business Search- 14 Million verified businesses
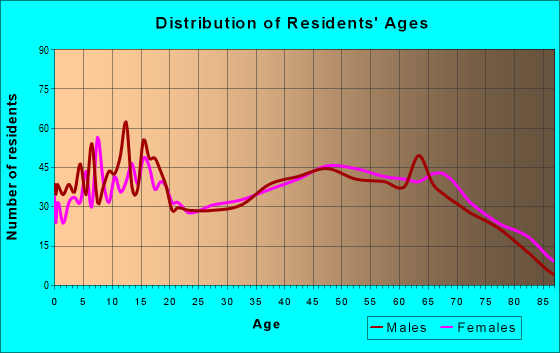
Males: 3,473
(52.3%)
Females: 3,173
(47.7%)
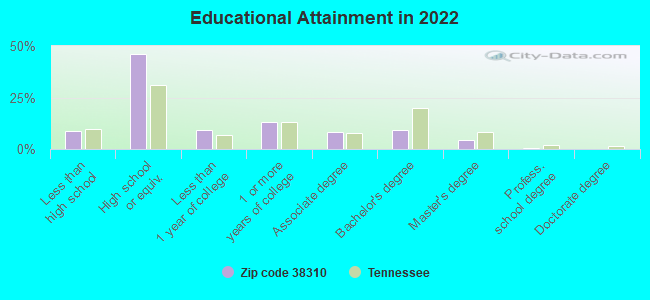
For population 25 years and over in 38310:
High school or higher: 89.9%
Bachelor's degree or higher: 14.2%
Graduate or professional degree: 5.0%
Unemployed: 4.5%
Mean travel time to work (commute): 29.2 minutes
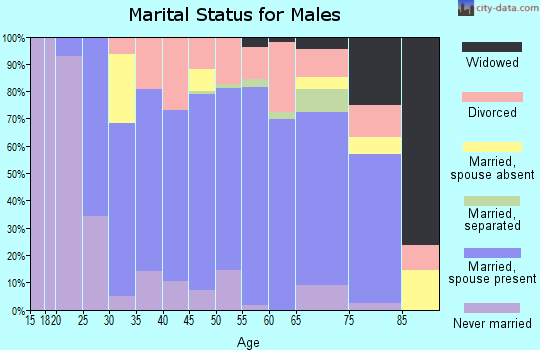
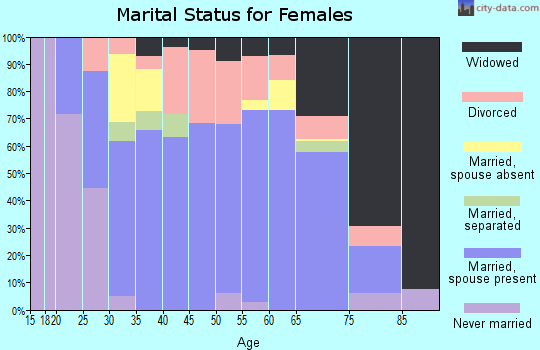
For population 15 years and over in 38310:
Never married: 22.9%
Now married: 57.7%
Separated: 2.2%
Widowed: 5.9%
Divorced: 11.4%
Zip code 38310 compared to state average:
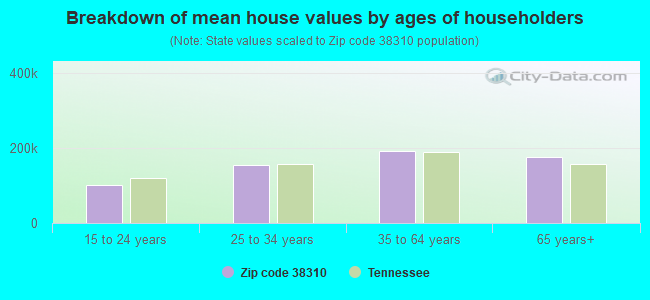
Median house value below state average.
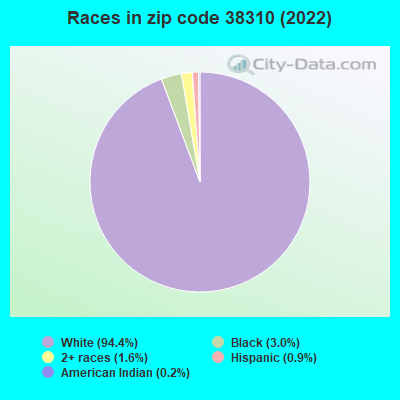
Black race population percentage significantly below state average.
Hispanic race population percentage significantly below state average.
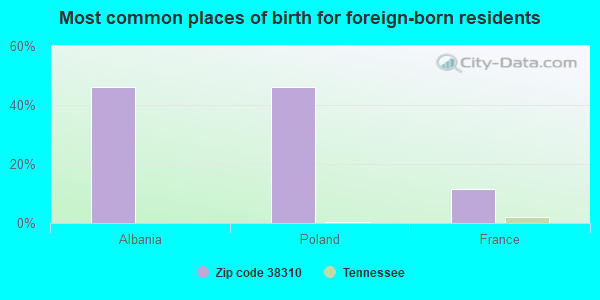
Foreign-born population percentage significantly below state average.
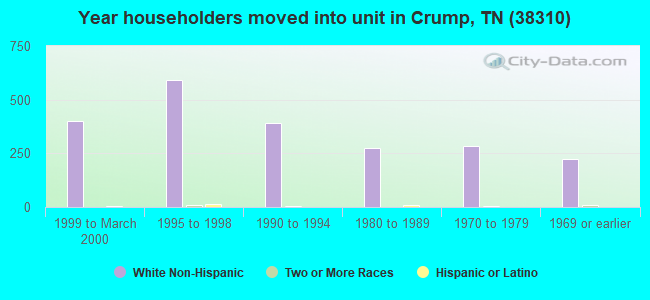
Length of stay since moving in significantly above state average.
Percentage of population with a bachelor's degree or higher significantly below state average.
Estimated median house/condo value in 2022: $158,168
38310:
$158,168
Tennessee:
$284,800
According to our research of Tennessee and other state lists, there were 17 registered sex offenders living in 38310 zip code as of April 24, 2024. The ratio of all residents to sex offenders in zip code 38310 is 365 to 1. The ratio of registered sex offenders to all residents in this zip code is near the state average.
Median resident age:
This zip code:
37.1 years
Tennessee median age:
39.2 years
Average household size:
This zip code:
2.7 people
Tennessee:
2.4 people
Averages for the 2020 tax year for zip code 38310, filed in 2021:
Average Adjusted Gross Income (AGI) in 2020: $50,948 (Individual Income Tax Returns)
Here:
$50,948
State:
$69,014
Salary/wage: $45,160 (reported on 81.4% of returns)
Here:
$45,160
State:
$55,872
(% of AGI for various income ranges: 1103.8% for AGIs below $25k, 3602.9% for AGIs $25k-50k, 6528.5% for AGIs $50k-75k, 9545.3% for AGIs $75k-100k, 15260.0% for AGIs $100k-200k, 46860.0% for AGIs over 200k)
Taxable interest for individuals: $1,409 (reported on 25.6% of returns)
This zip code:
$1,409
Tennessee:
$1,945
(% of AGI for various income ranges: 19.9% for AGIs below $25k, 14.1% for AGIs $25k-50k, 54.6% for AGIs $50k-75k, 47.3% for AGIs $75k-100k, 203.8% for AGIs $100k-200k, 775.0% for AGIs over 200k)
Ordinary dividends: $3,359 (reported on 8.5% of returns)
Here:
$3,359
State:
$8,105
(% of AGI for various income ranges: 4.9% for AGIs below $25k, 12.2% for AGIs $25k-50k, 28.8% for AGIs $50k-75k, 67.5% for AGIs $100k-200k, 2230.0% for AGIs over 200k)
Net capital gain/loss in AGI: +$16,743 (reported on 8.9% of returns)
Here:
+$16,743
State:
+$33,664
(% of AGI for various income ranges: 10.1% for AGIs below $25k, 34.6% for AGIs $25k-50k, 131.9% for AGIs $50k-75k, 683.1% for AGIs $100k-200k, 10665.0% for AGIs over 200k)
Profit/loss from business: +$16,707 (reported on 15.9% of returns)
Here:
+$16,707
State:
+$18,991
(% of AGI for various income ranges: 137.4% for AGIs below $25k, 127.5% for AGIs $25k-50k, 235.4% for AGIs $50k-75k, 192.7% for AGIs $75k-100k, 2586.9% for AGIs $100k-200k)
Taxable individual retirement arrangement distribution: $15,455 (reported on 8.5% of returns)
38310:
$15,455
Tennessee:
$20,036
(% of AGI for various income ranges: 45.3% for AGIs below $25k, 93.6% for AGIs $25k-50k, 138.1% for AGIs $50k-75k, 392.0% for AGIs $75k-100k, 970.0% for AGIs $100k-200k)
Total itemized deductions: $38,067 (reported on 2.3% of returns)
Here:
$38,067
State:
$40,136
(% of AGI for various income ranges: 149.3% for AGIs $25k-50k, 876.9% for AGIs $100k-200k)
Charity contributions: $14,680 (reported on 1.9% of returns)
Here:
$14,680
State:
$19,852
(% of AGI for various income ranges: 17.9% for AGIs below $25k, 372.5% for AGIs $100k-200k)
Taxes paid: $4,383 (reported on 2.3% of returns)
38310:
$4,383
State:
$6,038
(% of AGI for various income ranges: 14.2% for AGIs $25k-50k, 111.9% for AGIs $100k-200k)
Earned income credit: $2,545 (reported on 23.3% of returns)
Here:
$2,545
State:
$2,391
(% of AGI for various income ranges: 124.0% for AGIs below $25k, 96.9% for AGIs $25k-50k)
Percentage of individuals using paid preparers for their 2020 taxes: 93.8%
Here:
94%
State:
93%
(% for various income ranges: 92.9% for AGIs below $25k, 95.8% for AGIs $25k-50k, 94.4% for AGIs $50k-75k, 95.2% for AGIs $75k-100k, 92.0% for AGIs $100k-200k, 83.3% for AGIs over 200k)
Averages for the 2012 tax year for zip code 38310, filed in 2013:
Average Adjusted Gross Income (AGI) in 2012: $40,255 (Individual Income Tax Returns)
Here:
$40,255
State:
$53,767
Salary/wage: $36,499 (reported on 80.2% of returns)
Here:
$36,499
State:
$45,421
(% of AGI for various income ranges: 72.0% for AGIs below $25k, 76.8% for AGIs $25k-50k, 80.3% for AGIs $50k-75k, 77.3% for AGIs $75k-100k, 96.8% for AGIs $100k-200k)
Taxable interest for individuals: $1,159 (reported on 26.9% of returns)
This zip code:
$1,159
Tennessee:
$1,732
(% of AGI for various income ranges: 1.6% for AGIs below $25k, 0.7% for AGIs $25k-50k, 0.7% for AGIs $50k-75k, 0.3% for AGIs $75k-100k, 1.1% for AGIs $100k-200k)
Ordinary dividends: $3,174 (reported on 8.4% of returns)
Here:
$3,174
State:
$6,739
(% of AGI for various income ranges: 0.3% for AGIs below $25k, 1.2% for AGIs $25k-50k, 0.3% for AGIs $50k-75k, 1.4% for AGIs $100k-200k)
Net capital gain/loss in AGI: +$11,267 (reported on 6.6% of returns)
Here:
+$11,267
State:
+$19,082
(% of AGI for various income ranges: 0.9% for AGIs $25k-50k, 8.7% for AGIs $100k-200k)
Profit/loss from business: +$9,905 (reported on 18.9% of returns)
Here:
+$9,905
State:
+$15,240
(% of AGI for various income ranges: 10.9% for AGIs below $25k, 3.4% for AGIs $25k-50k, 3.0% for AGIs $50k-75k, 1.8% for AGIs $75k-100k, 7.9% for AGIs $100k-200k)
Taxable individual retirement arrangement distribution: $12,895 (reported on 9.3% of returns)
38310:
$12,895
Tennessee:
$15,505
(% of AGI for various income ranges: 2.8% for AGIs below $25k, 2.6% for AGIs $25k-50k, 2.1% for AGIs $50k-75k, 4.9% for AGIs $75k-100k, 4.6% for AGIs $100k-200k)
Total itemized deductions: $20,149 (24% of AGI, reported on 15.4% of returns)
Here:
$20,149
State:
$21,976
Here:
23.8% of AGI
State:
17.8% of AGI
(% of AGI for various income ranges: 4.7% for AGIs below $25k, 6.4% for AGIs $25k-50k, 8.9% for AGIs $50k-75k, 8.3% for AGIs $75k-100k, 14.3% for AGIs $100k-200k)
Charity contributions: $6,429 (reported on 10.6% of returns)
Here:
$6,429
State:
$6,709
(% of AGI for various income ranges: 1.0% for AGIs $25k-50k, 1.5% for AGIs $50k-75k, 2.0% for AGIs $75k-100k, 4.8% for AGIs $100k-200k)
Taxes paid: $3,597 (reported on 14.5% of returns)
38310:
$3,597
State:
$4,829
(% of AGI for various income ranges: 0.5% for AGIs below $25k, 0.8% for AGIs $25k-50k, 1.5% for AGIs $50k-75k, 1.6% for AGIs $75k-100k, 2.9% for AGIs $100k-200k)
Earned income credit: $2,462 (reported on 28.2% of returns)
Here:
$2,462
State:
$2,404
(% of AGI for various income ranges: 9.5% for AGIs below $25k, 1.6% for AGIs $25k-50k)
Percentage of individuals using paid preparers for their 2012 taxes: 62.6%
Here:
63%
State:
52%
(% for various income ranges: 57.5% for AGIs below $25k, 63.9% for AGIs $25k-50k, 65.5% for AGIs $50k-75k, 73.3% for AGIs $75k-100k, 85.7% for AGIs $100k-200k)
Averages for the 2004 tax year for zip code 38310, filed in 2005:
Average Adjusted Gross Income (AGI) in 2004: $31,498 (Individual Income Tax Returns)
Here:
$31,498
State:
$44,088
Salary/wage: $30,337 (reported on 84.3% of returns)
Here:
$30,337
State:
$38,825
(% of AGI for various income ranges: 159.5% for AGIs below $10k, 77.0% for AGIs $10k-25k, 85.3% for AGIs $25k-50k, 86.8% for AGIs $50k-75k, 85.4% for AGIs $75k-100k, 58.3% for AGIs over 100k)
Taxable interest for individuals: $1,393 (reported on 31.4% of returns)
This zip code:
$1,393
Tennessee:
$1,802
(% of AGI for various income ranges: 8.5% for AGIs below $10k, 1.5% for AGIs $10k-25k, 1.0% for AGIs $25k-50k, 0.9% for AGIs $50k-75k, 0.5% for AGIs $75k-100k, 2.5% for AGIs over 100k)
Taxable dividends: $1,200 (reported on 9.0% of returns)
Here:
$1,200
State:
$3,727
(% of AGI for various income ranges: 0.5% for AGIs below $10k, 0.3% for AGIs $10k-25k, 0.5% for AGIs $25k-50k, 0.1% for AGIs $50k-75k, 0.3% for AGIs $75k-100k, 0.4% for AGIs over 100k)
Net capital gain/loss: +$4,849 (reported on 8.0% of returns)
Here:
+$4,849
State:
+$15,776
(% of AGI for various income ranges: 2.3% for AGIs below $10k, 0.5% for AGIs $10k-25k, 0.5% for AGIs $25k-50k, -0.1% for AGIs $50k-75k, 1.1% for AGIs $75k-100k, 5.4% for AGIs over 100k)
Profit/loss from business: +$8,397 (reported on 19.4% of returns)
Here:
+$8,397
State:
+$12,882
(% of AGI for various income ranges: 25.7% for AGIs below $10k, 7.6% for AGIs $10k-25k, 4.1% for AGIs $25k-50k, 2.2% for AGIs $50k-75k, 3.0% for AGIs $75k-100k, 8.2% for AGIs over 100k)
IRA payment deduction: $3,314 (reported on 2.3% of returns)
38310:
$3,314
Tennessee:
$2,934
(% of AGI for various income ranges: 0.2% for AGIs $10k-25k, 0.2% for AGIs $25k-50k, 0.3% for AGIs $50k-75k, 0.7% for AGIs $75k-100k)
Total itemized deductions: $16,715 (24% of AGI, reported on 13.9% of returns)
Here:
$16,715
State:
$18,035
Here:
24.2% of AGI
State:
19.9% of AGI
(% of AGI for various income ranges: 4.7% for AGIs $10k-25k, 7.0% for AGIs $25k-50k, 7.8% for AGIs $50k-75k, 9.6% for AGIs $75k-100k, 9.8% for AGIs over 100k)
Charity contributions deductions: $5,060 (7% of AGI, reported on 11.2% of returns)
Here:
$5,060
State:
$5,167
Here:
6.7% of AGI
State:
5.3% of AGI
(% of AGI for various income ranges: 0.6% for AGIs $10k-25k, 1.0% for AGIs $25k-50k, 1.7% for AGIs $50k-75k, 2.6% for AGIs $75k-100k, 4.4% for AGIs over 100k)
Total tax: $4,124 (reported on 69.0% of returns)
38310:
$4,124
State:
$7,482
(% of AGI for various income ranges: 6.8% for AGIs below $10k, 3.8% for AGIs $10k-25k, 6.2% for AGIs $25k-50k, 8.6% for AGIs $50k-75k, 10.7% for AGIs $75k-100k, 19.8% for AGIs over 100k)
Earned income credit: $1,900 (reported on 26.0% of returns)
Here:
$1,900
State:
$1,826
Percentage of individuals using paid preparers for their 2004 taxes: 68.4%
Here:
68%
State:
60%
(% for various income ranges: 62.1% for AGIs below $10k, 71.4% for AGIs $10k-25k, 69.2% for AGIs $25k-50k, 68.1% for AGIs $50k-75k, 68.8% for AGIs $75k-100k, 76.6% for AGIs over 100k)
Likely homosexual households (counted as self-reported same-sex unmarried-partner households)
Lesbian couples: 0.0% of all households
Gay men: 0.3% of all households
Household received Food Stamps/SNAP in the past 12 months: 407 Household did not receive Food Stamps/SNAP in the past 12 months: 2,047
Women who had a birth in the past 12 months: 130 (73 now married, 56 unmarried) Women who did not have a birth in the past 12 months: 1,159 (684 now married, 475 unmarried)
Housing units in zip code 38310 with a mortgage: 847 (9 second mortgage, 4 both second mortgage and home equity loan) Houses without a mortgage: 14
Median monthly owner costs for units with a mortgage: $1,070 Median monthly owner costs for units without a mortgage: $378
Residents with income below the poverty level in 2022:
This zip code:
17.0%
Whole state:
13.3%
Residents with income below 50% of the poverty level in 2022:
This zip code:
8.8%
Whole state:
7.1%
Median number of rooms in houses and condos:
Here:
6.0
State:
6.5
Median number of rooms in apartments:
Here:
4.3
State:
4.4
Notable locations in this zip code not listed on our city pages
Notable locations in zip code 38310: Hagy Bridge (A), Coffee Landing (B), Perkins Bluff Landing (C), McNairy County Fire Department Station 12 Leapwood Fire Department (D), Adamsville Volunteer Fire Department (E). Display/hide their locations on the map
Churches in zip code 38310 include: Good Hope Baptist Church (A), Adamsville First Baptist Church (B), Calvary Church (C), Hardin Beauty Church (D), Old Union Church (E), Mars Hill Church (F). Display/hide their locations on the map
Cemeteries: Sanders Cemetery (1), Sweeney Cemetery (2), Taylor Cemetery (3), Williams Cemetery (4), Winding Ridge Cemetery (5), Wolverton Cemetery (6), Worley Cemetery (7). Display/hide their locations on the map
Streams, rivers, and creeks: Little Snake Creek (A), Lick Creek (B), Layton Branch (C), Beason Creek (D), Horse Creek (E), Hardin Slough (F), Glover Branch (G), Fulwood Branch (H), Factory Branch (I). Display/hide their locations on the map
1,181 married couples with children.
300 single-parent households (93 men, 207 women).
98.5% of residents of 38310 zip code speak English at home.
1.1% of residents speak Spanish at home (100% very well).
0.2% of residents speak other Indo-European language at home (100% very well).
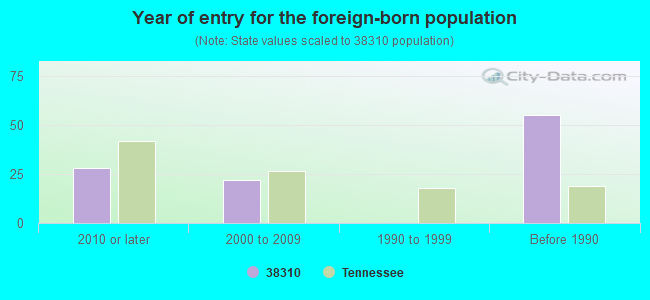
Foreign born population: 25 (0.4%) (100.0% of them are naturalized citizens)
This zip code:
0.4%
Whole state:
5.6%
46%Albania
46%Poland
12%France
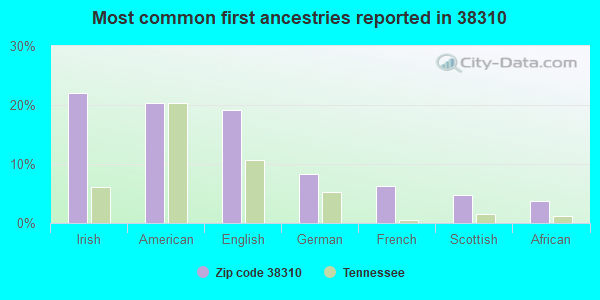
22%Irish
20%American
19%English
8%German
6%French
5%Scottish
4%African
Year of entry for the foreign-born population
282010 or later
222000 to 2009
01990 to 1999
55Before 1990
Facilities with environmental interests located in this zip code:
AQUA GLASS II COMPOSITE CONCEPTS (445 FARBER DRIVE in ADAMSVILLE, TN)
AIR MAJOR (AIRS/AFS) CRITERIA AND HAZARDOUS AIR POLLUTANT INVENTORY (Inventory of air pollution sources) HAZARDOUS WASTE BIENNIAL REPORTER (Resource Conservation and Recovery Act (tracking hazardous waste)) Large Quantity Generators, more that 1000 kg of hazardous waste/month (Resource Conservation and Recovery Act (tracking hazardous waste)) - notification TRI REPORTER (Tracking of toxic chemicals releasing facilities) Business SIC classification: PLASTICS PLUMBING FIXTURES; PLASTICS PRODUCTS Business NAICS classification: PLASTICS PLUMBING FIXTURE MANUFACTURING. Organizations: BEVERLY HOLLIN, PLANT MANAGER (CONTACT/OPERATOR)
, BRENT THOMAS (CONTACT/OPERATOR)
, AQUA GLASS CORPORATION (CONTACT/OWNER)
Alternative names: AQUA GLASS CORP., AQUA II, AQUA II COMPOSITE CONCEPTS DIVISION OF A
ADAMSVILLE ELEMENTARY SCHOOL (P O BOX 335 in ADAMSVILLE, TN)
(Geographic Names Information System) (National Center for Education Statistics) - STATE ID-0005 Organizations: MCNAIRY COUNTY SCHOOL DISTRICT (SCHOOL DISTRICT)
AQUA GLASS CORPORATION (MAIN PLANT) (320 INDUSTRIAL PARK ROAD in ADAMSVILLE, TN)
AIR MAJOR (AIRS/AFS) CRITERIA AND HAZARDOUS AIR POLLUTANT INVENTORY (Inventory of air pollution sources) HAZARDOUS WASTE BIENNIAL REPORTER (Resource Conservation and Recovery Act (tracking hazardous waste)) Large Quantity Generators, more that 1000 kg of hazardous waste/month (Resource Conservation and Recovery Act (tracking hazardous waste)) - notification TRI REPORTER (Tracking of toxic chemicals releasing facilities) Business SIC classification: PLASTICS PLUMBING FIXTURES Business NAICS classification: PLASTICS PLUMBING FIXTURE MANUFACTURING.; PLASTICS PLUMBING FIXTURE MANUFACTURING. Alternative names: AGUAGLASS CORP.
ADAMSVILLE JUNIOR / SENIOR HIGH SCHOOL (P O BOX 407 in ADAMSVILLE, TN)
(National Center for Education Statistics) - STATE ID-0010 Organizations: MCNAIRY COUNTY SCHOOL DISTRICT (SCHOOL DISTRICT)
ADAMSVILLE LAGOON (LAGOON STREET in ADAMSVILLE, TN)
National Pollutant Discharge Elimination System NON-MAJOR (Tracking pollutant discharge elimination systems) - permit Business SIC classification: SEWERAGE SYSTEMS Organizations: PAUL W. PLUNK (CONTACT/OWNER)
AQUA GLASS CORP MOLD SHOP (LAGOON STREET in ADAMSVILLE, TN)
(Resource Conservation and Recovery Act (tracking hazardous waste)) Business NAICS classification: MINERAL WOOL MANUFACTURING.
BANNER PUBLISHING CO INC (MAIN ST in ADAMSVILLE, TN)
(Resource Conservation and Recovery Act (tracking hazardous waste))
DBH ATTACHMENTS INC (N Y Y Y in ADAMSVILLE, TN)
(Resource Conservation and Recovery Act (tracking hazardous waste))
CENTURY ELECTRIC (SUNSET BLVD in ADAMSVILLE, TN)
AIR MAJOR (AIRS/AFS) Business SIC classification: MOTORS AND GENERATORS
Housing units lacking complete plumbing facilities: 0.2% Housing units lacking complete kitchen facilities: 0.4%
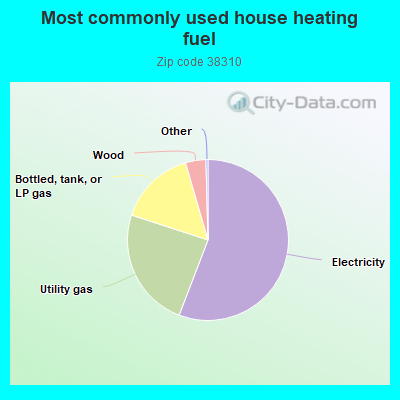
55.9%Electricity
24.2%Utility gas
15.5%Bottled, tank, or LP gas
4.1%Wood
Population in 1990: 3,042. Population change in the 1990s: +2,466 (+81.1%).
Place of birth for U.S.-born residents:
This state: 4,517
Northeast: 216
Midwest: 592
South: 943
West: 225
56% of the 38310 zip code residents lived in the same house 5 years ago. Out of people who lived in different houses, 47% lived in this county. Out of people who lived in different counties, 50% lived in Tennessee.
92% of the 38310 zip code residents lived in the same house 1 year ago. Out of people who lived in different houses, 38% moved from this county. Out of people who lived in different houses, 37% moved from different county within same state. Out of people who lived in different houses, 27% moved from different state. Out of people who lived in different houses, 1% moved from abroad.
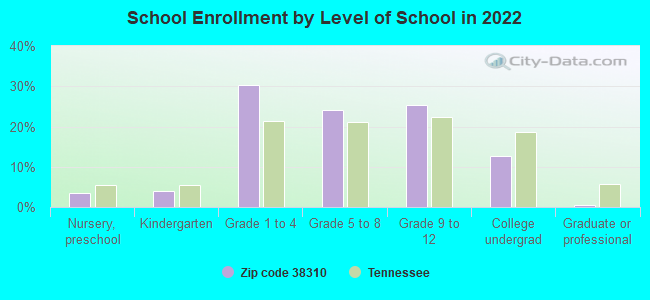
Private vs. public school enrollment:
Students in private schools in grades 1 to 8 (elementary and middle school): 357
Here:
35.3%
Tennessee:
15.0%
Students in private schools in grades 9 to 12 (high school): 29
Here:
6.5%
Tennessee:
16.2%
Students in private undergraduate colleges: 96
Here:
42.4%
Tennessee:
23.5%
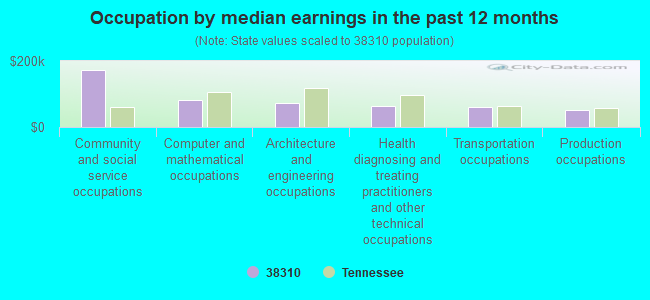
Occupation by median earnings in the past 12 months ($)
172,027Community and social service occupations
81,952Computer and mathematical occupations
71,731Architecture and engineering occupations
63,303Health diagnosing and treating practitioners and other technical occupations
61,693Transportation occupations
51,952Production occupations
Top industries in this zip code by the number of employees in 2005:
Administrative and Support and Waste Management and Remediation Services: Temporary Help Services (100-249 employees: 1 establishment)
Health Care and Social Assistance: Nursing Care Facilities (50-99: 1)
Health Care and Social Assistance: Offices of Physicians (except Mental Health Specialists) (10-19: 2, 5-9: 2)
Accommodation and Food Services: Full-Service Restaurants (20-49: 1, 1-4: 2)
People in group quarters in 2010:
111 people in nursing facilities/skilled-nursing facilities
People in group quarters in 2000:
144 people in nursing homes
Fatal accident statistics in 2014:
Fatal accident count: 1
Vehicles involved in fatal accidents: 1
Fatal accidents caused by drunken drivers: 1
Fatalities: 1
Persons involved in fatal accidents: 3
Pedestrians involved in fatal accidents: 0
Fatal accident statistics in 2013:
Fatal accident count: 4
Vehicles involved in fatal accidents: 5
Fatal accidents caused by drunken drivers: 0
Fatalities: 4
Persons involved in fatal accidents: 6
Pedestrians involved in fatal accidents: 1
2004 - 2018 National Fire Incident Reporting System (NFIRS) incidents
Based on the data from the years 2004 - 2018 the average number of fires per year is 31. The highest number of reported fires - 46 took place in 2007, and the least - 13 in 2013. The data has a growing trend.
When looking into fire subcategories, the most incidents belonged to: Structure Fires (43.5%), and Outside Fires (41.8%).
Fire incident types reported to NFIRS in Zip Code 38310
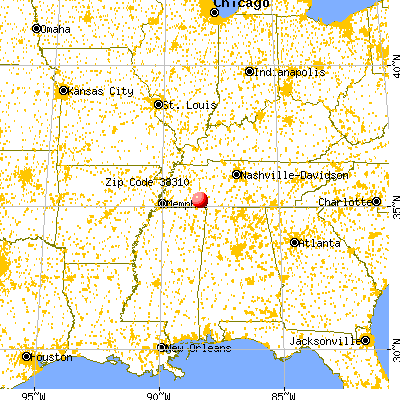


 Nearest zip codes: 38379, 38327, 38361, 38359, 38332, 38376.


 Based on the data from the years 2004 - 2018 the average number of fires per year is 31. The highest number of reported fires - 46 took place in 2007, and the least - 13 in 2013. The data has a growing trend.
 When looking into fire subcategories, the most incidents belonged to: Structure Fires (43.5%), and Outside Fires (41.8%).