Estimated zip code population in 2022: 4,129 Zip code population in 2010: 4,404 Zip code population in 2000: 4,424
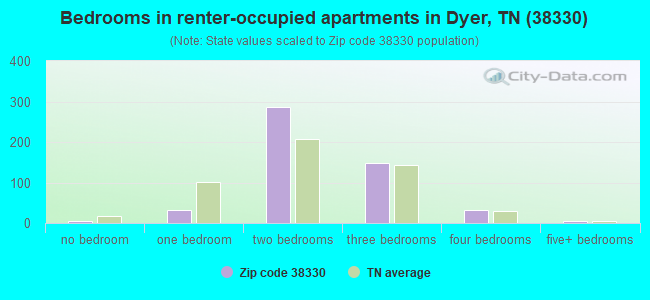
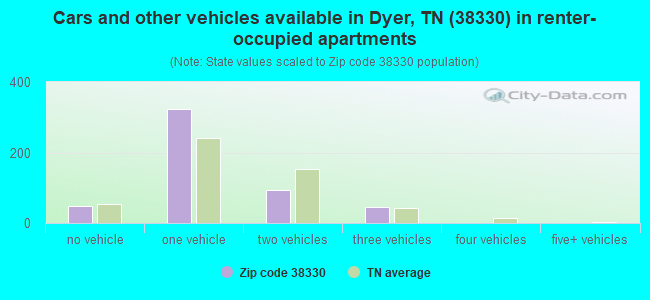
Houses and condos: 1,714 Renter-occupied apartments: 509
% of renters here:
32%
State:
33%
March 2022 cost of living index in zip code 38330: 78.0 (low, U.S. average is 100)
Land area: 69.6 sq. mi. Water area: 0.0 sq. mi.
Population density: 59 people per square mile
(very low).
OSM Map
General Map
Google Map
MSN Map
OSM Map
General Map
Google Map
MSN Map
OSM Map
General Map
Google Map
MSN Map
OSM Map
General Map
Google Map
MSN Map
Please wait while loading the map...
Real estate property taxes paid for housing units in 2022:
This zip code:
0.8% ($1,057)
Tennessee:
0.5% ($1,376)
Median real estate property taxes paid for housing units with mortgages in 2022: $1,180 (0.6%) Median real estate property taxes paid for housing units with no mortgage in 2022: $920 (0.8%)
Business Search- 14 Million verified businesses
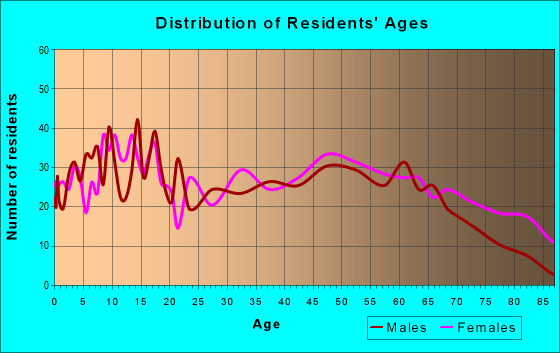
Males: 1,842
(44.6%)
Females: 2,287
(55.4%)
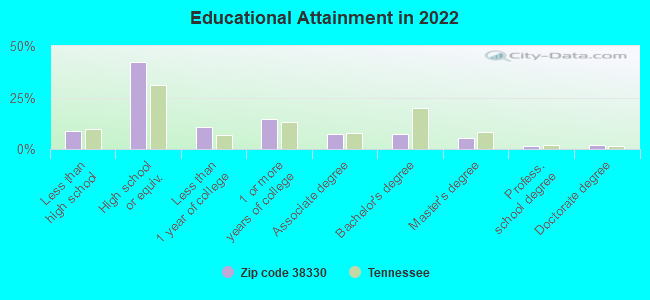
For population 25 years and over in 38330:
High school or higher: 90.8%
Bachelor's degree or higher: 16.2%
Graduate or professional degree: 8.8%
Unemployed: 1.9%
Mean travel time to work (commute): 27.9 minutes
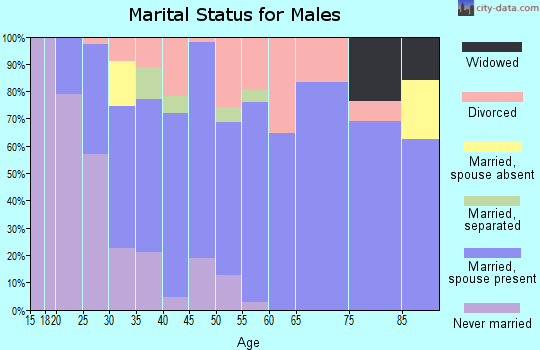
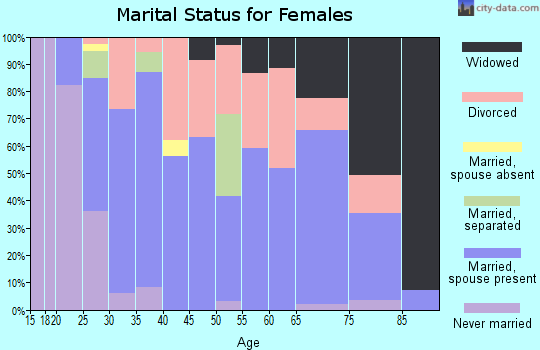
For population 15 years and over in 38330:
Never married: 29.8%
Now married: 49.3%
Separated: 5.0%
Widowed: 6.6%
Divorced: 9.4%
Zip code 38330 compared to state average:
Median house value below state average.
Unemployed percentage below state average.
Hispanic race population percentage below state average.
Foreign-born population percentage significantly below state average.
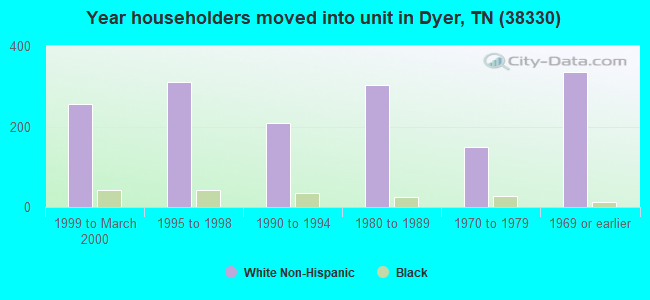
Length of stay since moving in significantly above state average.
Number of college students below state average.
Percentage of population with a bachelor's degree or higher below state average.
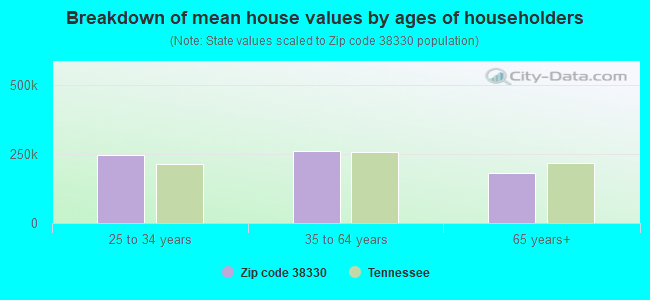
Estimated median house/condo value in 2022: $132,277
38330:
$132,277
Tennessee:
$284,800
According to our research of Tennessee and other state lists, there were 8 registered sex offenders living in 38330 zip code as of April 25, 2024. The ratio of all residents to sex offenders in zip code 38330 is 564 to 1. The ratio of registered sex offenders to all residents in this zip code is lower than the state average.
Median resident age:
This zip code:
38.0 years
Tennessee median age:
39.2 years
Average household size:
This zip code:
2.5 people
Tennessee:
2.4 people
Averages for the 2020 tax year for zip code 38330, filed in 2021:
Average Adjusted Gross Income (AGI) in 2020: $46,873 (Individual Income Tax Returns)
Here:
$46,873
State:
$69,014
Salary/wage: $41,956 (reported on 83.5% of returns)
Here:
$41,956
State:
$55,872
(% of AGI for various income ranges: 1086.2% for AGIs below $25k, 3511.8% for AGIs $25k-50k, 6228.0% for AGIs $50k-75k, 9047.0% for AGIs $75k-100k, 18270.0% for AGIs $100k-200k)
Taxable interest for individuals: $798 (reported on 28.2% of returns)
This zip code:
$798
Tennessee:
$1,945
(% of AGI for various income ranges: 13.8% for AGIs below $25k, 10.5% for AGIs $25k-50k, 47.0% for AGIs $50k-75k, 57.0% for AGIs $75k-100k, 117.0% for AGIs $100k-200k)
Ordinary dividends: $2,706 (reported on 10.6% of returns)
Here:
$2,706
State:
$8,105
(% of AGI for various income ranges: 10.8% for AGIs below $25k, 11.8% for AGIs $25k-50k, 57.5% for AGIs $50k-75k, 80.0% for AGIs $75k-100k, 188.0% for AGIs $100k-200k)
Net capital gain/loss in AGI: +$13,956 (reported on 10.6% of returns)
Here:
+$13,956
State:
+$33,664
(% of AGI for various income ranges: 8.3% for AGIs below $25k, 21.8% for AGIs $25k-50k, 77.0% for AGIs $50k-75k, 27.0% for AGIs $75k-100k, 2200.0% for AGIs $100k-200k)
Profit/loss from business: +$9,900 (reported on 12.9% of returns)
Here:
+$9,900
State:
+$18,991
(% of AGI for various income ranges: 106.0% for AGIs below $25k, 89.2% for AGIs $25k-50k, 214.5% for AGIs $50k-75k, 830.0% for AGIs $100k-200k)
Taxable individual retirement arrangement distribution: $10,050 (reported on 9.4% of returns)
38330:
$10,050
Tennessee:
$20,036
(% of AGI for various income ranges: 45.1% for AGIs below $25k, 43.2% for AGIs $25k-50k, 329.5% for AGIs $50k-75k, 537.0% for AGIs $100k-200k)
Total itemized deductions: $26,167 (reported on 1.8% of returns)
Here:
$26,167
State:
$40,136
(% of AGI for various income ranges: 196.2% for AGIs $25k-50k)
Charity contributions: $17,750 (reported on 1.2% of returns)
Here:
$17,750
State:
$19,852
(% of AGI for various income ranges: 88.8% for AGIs $25k-50k)
Taxes paid: $3,200 (reported on 1.8% of returns)
38330:
$3,200
State:
$6,038
(% of AGI for various income ranges: 24.0% for AGIs $25k-50k)
Earned income credit: $2,577 (reported on 25.3% of returns)
Here:
$2,577
State:
$2,391
(% of AGI for various income ranges: 129.2% for AGIs below $25k, 105.8% for AGIs $25k-50k)
Percentage of individuals using paid preparers for their 2020 taxes: 98.2%
Here:
98%
State:
93%
(% for various income ranges: 97.0% for AGIs below $25k, 97.9% for AGIs $25k-50k, 100.0% for AGIs $50k-75k, 100.0% for AGIs $75k-100k, 100.0% for AGIs $100k-200k, 100.0% for AGIs over 200k)
Averages for the 2012 tax year for zip code 38330, filed in 2013:
Average Adjusted Gross Income (AGI) in 2012: $37,344 (Individual Income Tax Returns)
Here:
$37,344
State:
$53,767
Salary/wage: $32,362 (reported on 84.2% of returns)
Here:
$32,362
State:
$45,421
(% of AGI for various income ranges: 71.5% for AGIs below $25k, 79.4% for AGIs $25k-50k, 79.1% for AGIs $50k-75k, 77.6% for AGIs $75k-100k, 52.2% for AGIs $100k-200k)
Taxable interest for individuals: $1,004 (reported on 31.5% of returns)
This zip code:
$1,004
Tennessee:
$1,732
(% of AGI for various income ranges: 1.0% for AGIs below $25k, 0.8% for AGIs $25k-50k, 0.6% for AGIs $50k-75k, 0.5% for AGIs $75k-100k, 1.5% for AGIs $100k-200k)
Ordinary dividends: $2,174 (reported on 11.5% of returns)
Here:
$2,174
State:
$6,739
(% of AGI for various income ranges: 0.6% for AGIs below $25k, 0.7% for AGIs $25k-50k, 0.5% for AGIs $50k-75k, 0.7% for AGIs $75k-100k, 0.9% for AGIs $100k-200k)
Net capital gain/loss in AGI: +$3,192 (reported on 7.9% of returns)
Here:
+$3,192
State:
+$19,082
(% of AGI for various income ranges: 4.3% for AGIs $100k-200k)
Profit/loss from business: +$8,178 (reported on 13.9% of returns)
Here:
+$8,178
State:
+$15,240
(% of AGI for various income ranges: 6.8% for AGIs below $25k, 3.3% for AGIs $25k-50k, 1.9% for AGIs $50k-75k, 4.3% for AGIs $75k-100k)
Taxable individual retirement arrangement distribution: $10,106 (reported on 10.9% of returns)
38330:
$10,106
Tennessee:
$15,505
(% of AGI for various income ranges: 4.5% for AGIs below $25k, 2.2% for AGIs $25k-50k, 3.1% for AGIs $50k-75k, 6.2% for AGIs $75k-100k)
Total itemized deductions: $20,071 (28% of AGI, reported on 12.7% of returns)
Here:
$20,071
State:
$21,976
Here:
27.5% of AGI
State:
17.8% of AGI
(% of AGI for various income ranges: 7.2% for AGIs $25k-50k, 7.9% for AGIs $50k-75k, 8.5% for AGIs $75k-100k, 9.2% for AGIs $100k-200k)
Charity contributions: $6,694 (reported on 9.7% of returns)
Here:
$6,694
State:
$6,709
(% of AGI for various income ranges: 1.2% for AGIs $25k-50k, 1.6% for AGIs $50k-75k, 2.5% for AGIs $75k-100k, 3.7% for AGIs $100k-200k)
Taxes paid: $3,176 (reported on 12.7% of returns)
38330:
$3,176
State:
$4,829
(% of AGI for various income ranges: 1.0% for AGIs $25k-50k, 1.2% for AGIs $50k-75k, 1.4% for AGIs $75k-100k, 1.6% for AGIs $100k-200k)
Earned income credit: $2,316 (reported on 27.3% of returns)
Here:
$2,316
State:
$2,404
(% of AGI for various income ranges: 8.3% for AGIs below $25k, 1.6% for AGIs $25k-50k)
Percentage of individuals using paid preparers for their 2012 taxes: 65.5%
Here:
65%
State:
52%
(% for various income ranges: 63.5% for AGIs below $25k, 66.0% for AGIs $25k-50k, 68.0% for AGIs $50k-75k, 63.6% for AGIs $75k-100k, 75.0% for AGIs $100k-200k)
Averages for the 2004 tax year for zip code 38330, filed in 2005:
Average Adjusted Gross Income (AGI) in 2004: $32,381 (Individual Income Tax Returns)
Here:
$32,381
State:
$44,088
Salary/wage: $31,218 (reported on 83.9% of returns)
Here:
$31,218
State:
$38,825
(% of AGI for various income ranges: 100.4% for AGIs below $10k, 80.2% for AGIs $10k-25k, 82.9% for AGIs $25k-50k, 84.2% for AGIs $50k-75k, 85.1% for AGIs $75k-100k, 62.5% for AGIs over 100k)
Taxable interest for individuals: $1,618 (reported on 38.9% of returns)
This zip code:
$1,618
Tennessee:
$1,802
(% of AGI for various income ranges: 7.9% for AGIs below $10k, 2.6% for AGIs $10k-25k, 1.6% for AGIs $25k-50k, 1.7% for AGIs $50k-75k, 0.8% for AGIs $75k-100k, 2.1% for AGIs over 100k)
Taxable dividends: $1,713 (reported on 13.3% of returns)
Here:
$1,713
State:
$3,727
(% of AGI for various income ranges: 2.0% for AGIs below $10k, 0.5% for AGIs $10k-25k, 0.5% for AGIs $25k-50k, 0.9% for AGIs $50k-75k, 0.3% for AGIs $75k-100k, 1.2% for AGIs over 100k)
Net capital gain/loss: +$894 (reported on 10.6% of returns)
Here:
+$894
State:
+$15,776
(% of AGI for various income ranges: 1.5% for AGIs below $10k, 0.1% for AGIs $10k-25k, -0.0% for AGIs $25k-50k, 0.3% for AGIs $50k-75k, 0.4% for AGIs $75k-100k, 1.0% for AGIs over 100k)
Profit/loss from business: +$8,465 (reported on 14.6% of returns)
Here:
+$8,465
State:
+$12,882
(% of AGI for various income ranges: 17.6% for AGIs below $10k, 3.4% for AGIs $10k-25k, 3.3% for AGIs $25k-50k, 2.3% for AGIs $50k-75k, 2.9% for AGIs $75k-100k, 6.6% for AGIs over 100k)
IRA payment deduction: $3,098 (reported on 2.4% of returns)
38330:
$3,098
Tennessee:
$2,934
Total itemized deductions: $15,667 (22% of AGI, reported on 10.9% of returns)
Here:
$15,667
State:
$18,035
Here:
22.1% of AGI
State:
19.9% of AGI
(% of AGI for various income ranges: 2.3% for AGIs $10k-25k, 4.7% for AGIs $25k-50k, 5.5% for AGIs $50k-75k, 6.7% for AGIs $75k-100k, 9.6% for AGIs over 100k)
Charity contributions deductions: $5,490 (7% of AGI, reported on 9.1% of returns)
Here:
$5,490
State:
$5,167
Here:
7.2% of AGI
State:
5.3% of AGI
(% of AGI for various income ranges: 0.3% for AGIs $10k-25k, 0.9% for AGIs $25k-50k, 1.4% for AGIs $50k-75k, 1.8% for AGIs $75k-100k, 5.0% for AGIs over 100k)
Total tax: $4,085 (reported on 70.5% of returns)
38330:
$4,085
State:
$7,482
(% of AGI for various income ranges: 4.6% for AGIs below $10k, 3.4% for AGIs $10k-25k, 6.5% for AGIs $25k-50k, 8.7% for AGIs $50k-75k, 11.6% for AGIs $75k-100k, 20.1% for AGIs over 100k)
Earned income credit: $1,948 (reported on 21.9% of returns)
Here:
$1,948
State:
$1,826
Percentage of individuals using paid preparers for their 2004 taxes: 68.8%
Here:
69%
State:
60%
(% for various income ranges: 66.9% for AGIs below $10k, 70.1% for AGIs $10k-25k, 71.5% for AGIs $25k-50k, 65.6% for AGIs $50k-75k, 65.1% for AGIs $75k-100k, 65.1% for AGIs over 100k)
Likely homosexual households (counted as self-reported same-sex unmarried-partner households)
Lesbian couples: 1.5% of all households
Gay men: 0.0% of all households
Household received Food Stamps/SNAP in the past 12 months: 293 Household did not receive Food Stamps/SNAP in the past 12 months: 1,282
Women who had a birth in the past 12 months: 34 (0 now married, 33 unmarried) Women who did not have a birth in the past 12 months: 942 (436 now married, 505 unmarried)
Housing units in zip code 38330 with a mortgage: 565 (10 second mortgage, 9 both second mortgage and home equity loan) Houses without a mortgage: 3
Median monthly owner costs for units with a mortgage: $1,058 Median monthly owner costs for units without a mortgage: $403
Residents with income below the poverty level in 2022:
This zip code:
19.2%
Whole state:
13.3%
Residents with income below 50% of the poverty level in 2022:
This zip code:
8.0%
Whole state:
7.1%
Median number of rooms in houses and condos:
Here:
6.4
State:
6.5
Median number of rooms in apartments:
Here:
4.4
State:
4.4
Notable locations in this zip code not listed on our city pages
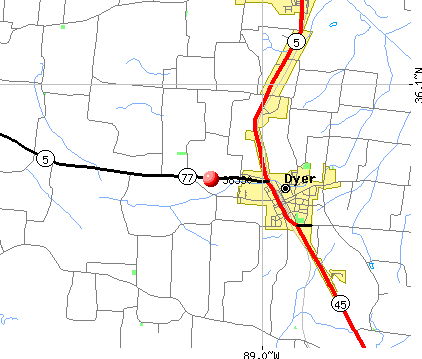
Notable locations in zip code 38330: Dyer Industrial Park (A), Yorkville Fire Department (B), Dyer Volunteer Fire Department (C), Dyer City Hall (D). Display/hide their locations on the map
Churches in zip code 38330 include: Bells Chapel (A), Beech Grove Church (B), Good Hope Church (C), Yorkville Church of Christ (D), Griers Chapel (E), Clear Creek Church (F), Bethel Baptist Church (G), Dyer Church of Christ (H), First Baptist Church of Dyer (I). Display/hide their locations on the map
Cemeteries: Keas Cemetery (1), Bethel Cemetery (2), Bobbitt Cemetery (3), Bucksnort Cemetery (4), Poplar Grove Cemetery (5), New Bethlehem Cemetery (6), Mount Olive Cemetery (7). Display/hide their locations on the map
Streams, rivers, and creeks: Dry Creek (A), Cow Creek (B), Owen Branch (C), Mud Creek (D), Sand Creek (E), Rogers Branch (F), Squirt Creek (G). Display/hide their locations on the map
In group quarters: 93 (-1 institutionalized population)
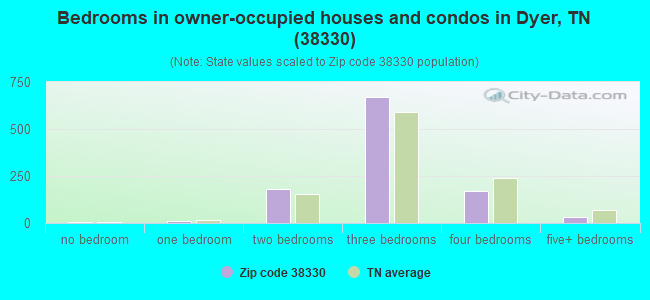
Size of family households: 509 2-persons, 206 3-persons, 253 4-persons, 98 5-persons, 29 6-persons, 2 7-or-more-persons
Size of nonfamily households: 328 1-person, 151 2-persons, 5 4-persons
494 married couples with children.
591 single-parent households (245 men, 346 women).
99.3% of residents of 38330 zip code speak English at home.
0.3% of residents speak Spanish at home (25% very well, 75% well).
0.1% of residents speak Asian or Pacific Island language at home (100% very well).
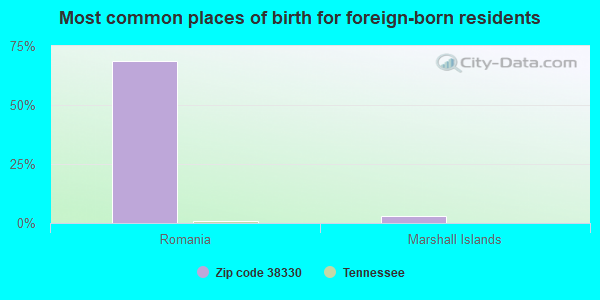
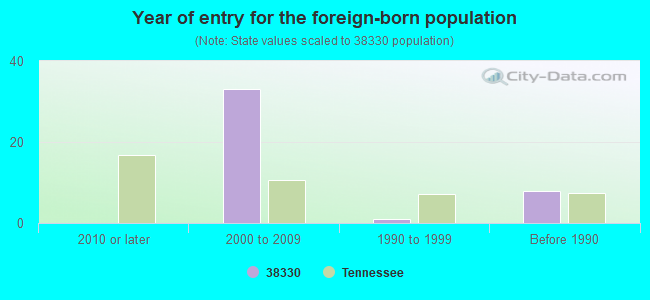
Foreign born population: 35 (0.9%) (97.0% of them are naturalized citizens)
This zip code:
0.9%
Whole state:
5.6%
69%Romania
3%Marshall Islands
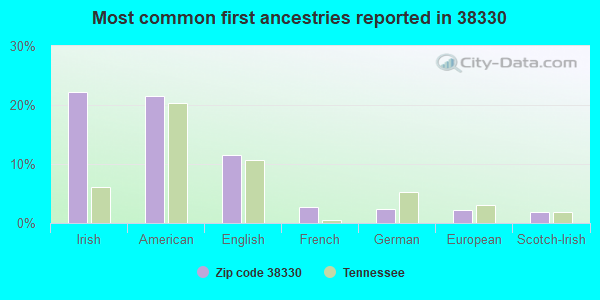
22%Irish
21%American
11%English
3%French
2%German
2%European
2%Scotch-Irish
Year of entry for the foreign-born population
02010 or later
332000 to 2009
11990 to 1999
8Before 1990
Facilities with environmental interests located in this zip code:
BROWN SHOE CO (211 E. COLLEGE ST. in DYER, TN)
(Resource Conservation and Recovery Act (tracking hazardous waste)) TRI REPORTER (Tracking of toxic chemicals releasing facilities) Business SIC classification: WOMEN'S FOOTWEAR, EXCEPT ATHLETIC Business NAICS classification: WOMEN'S FOOTWEAR (EXCEPT ATHLETIC) MANUFACTURING. Alternative names: BROWN SHOE CO-DYER PLANT
BARROWS EXXON (547 SOUTH MAIN STREET in DYER, TN)
(Resource Conservation and Recovery Act (tracking hazardous waste))
BUSY BEAVER MULCH (1226 NORTH MAIN STREET in DYER, TN)
AIR SYNTHETIC MINOR (AIRS/AFS) Business SIC classification: LAWN AND GARDEN TRACTORS AND HOME LAWN AND GARDEN EQUIPMENT
Housing units lacking complete plumbing facilities: 2.0% Housing units lacking complete kitchen facilities: 1.2%
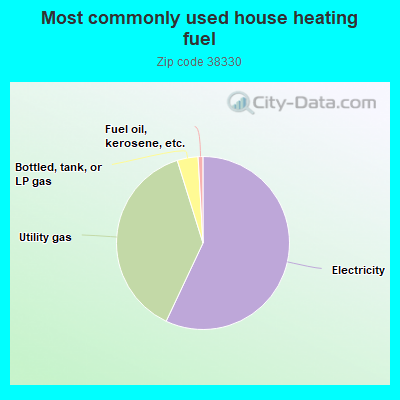
57.0%Electricity
38.2%Utility gas
3.9%Bottled, tank, or LP gas
0.9%Fuel oil, kerosene, etc.
Population in 1990: 4,695.
Place of birth for U.S.-born residents:
This state: 3,192
Northeast: 147
Midwest: 295
South: 360
West: 45
60% of the 38330 zip code residents lived in the same house 5 years ago. Out of people who lived in different houses, 68% lived in this county. Out of people who lived in different counties, 50% lived in Tennessee.
88% of the 38330 zip code residents lived in the same house 1 year ago. Out of people who lived in different houses, 66% moved from this county. Out of people who lived in different houses, 20% moved from different county within same state. Out of people who lived in different houses, 6% moved from different state. Out of people who lived in different houses, 3% moved from abroad.
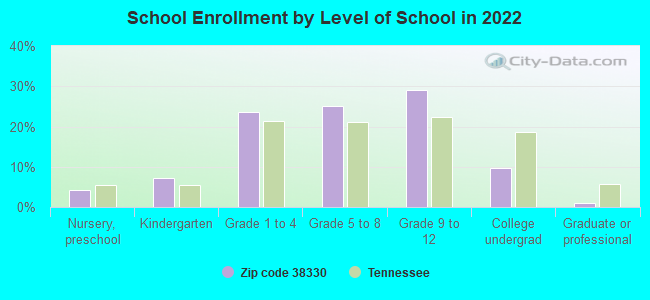
Private vs. public school enrollment:
Students in private schools in grades 1 to 8 (elementary and middle school): 50
Here:
10.7%
Tennessee:
15.0%
Students in private schools in grades 9 to 12 (high school): 33
Here:
11.8%
Tennessee:
16.2%
Students in private undergraduate colleges:
Here:
1.0%
Tennessee:
23.5%
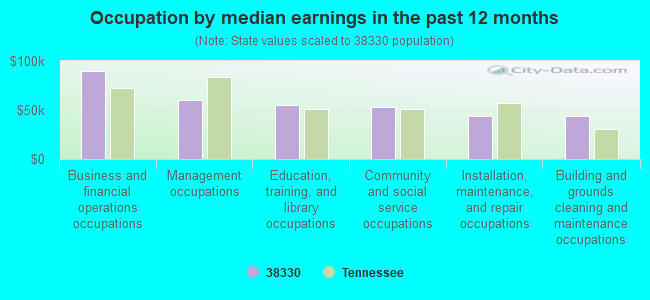
Occupation by median earnings in the past 12 months ($)
89,417Business and financial operations occupations
59,800Management occupations
54,724Education, training, and library occupations
53,403Community and social service occupations
44,361Installation, maintenance, and repair occupations
43,441Building and grounds cleaning and maintenance occupations
Companies with federal contracts located in this zip code:
DYER FIBERGLASS, INC (59 CURRIE ROAD in DYER, TN) : $12,184 in 2 contractsin 2005
$6,092 with U.S. Army Corps of Engineers - civil program financing only for Prefabricated and Portable Buildings. Taking place in MO. Signed on 2005-09-17. Completion date: 2005-09-30.
$6,092 with Army for Prefabricated and Portable Buildings. Taking place in MO. Signed on 2005-09-17. Completion date: 2005-09-30.
Top industries in this zip code by the number of employees in 2005:
Health Care and Social Assistance: Nursing Care Facilities (100-249 employees: 1 establishment, 5-9 employees: 1 establishment)
Accommodation and Food Services: Full-Service Restaurants (10-19: 2)
Other Services (except Public Administration): Religious Organizations (5-9: 1, 1-4: 6)
People in group quarters in 2010:
111 people in nursing facilities/skilled-nursing facilities
People in group quarters in 2000:
117 people in nursing homes
2003 - 2018 National Fire Incident Reporting System (NFIRS) incidents
According to the data from the years 2003 - 2018 the average number of fire incidents per year is 32. The highest number of reported fires - 52 took place in 2006, and the least - 20 in 2014. The data has a rising trend.
When looking into fire subcategories, the most reports belonged to: Outside Fires (45.9%), and Structure Fires (34.3%).
Fire incident types reported to NFIRS in Zip Code 38330
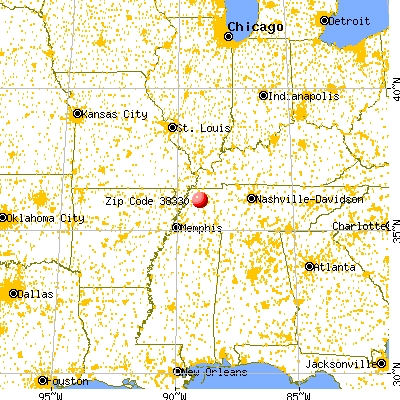


 Nearest zip codes: 38369, 38382, 38233, 38259, 38059, 38316.
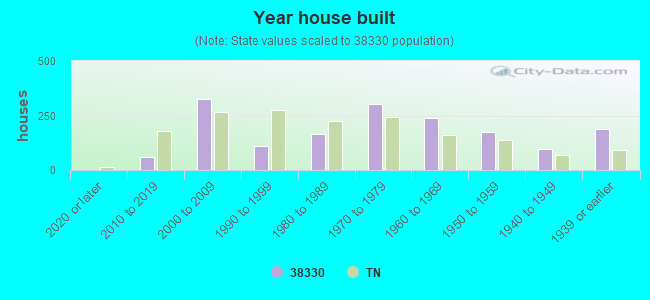


 According to the data from the years 2003 - 2018 the average number of fire incidents per year is 32. The highest number of reported fires - 52 took place in 2006, and the least - 20 in 2014. The data has a rising trend.
 When looking into fire subcategories, the most reports belonged to: Outside Fires (45.9%), and Structure Fires (34.3%).