Estimated zip code population in 2022: 2,853 Zip code population in 2010: 2,817 Zip code population in 2000: 2,639
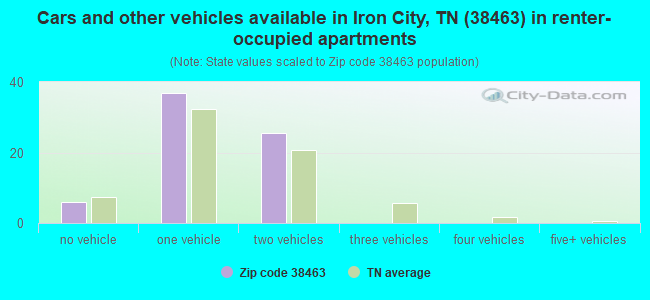
Houses and condos: 1,343 Renter-occupied apartments: 68
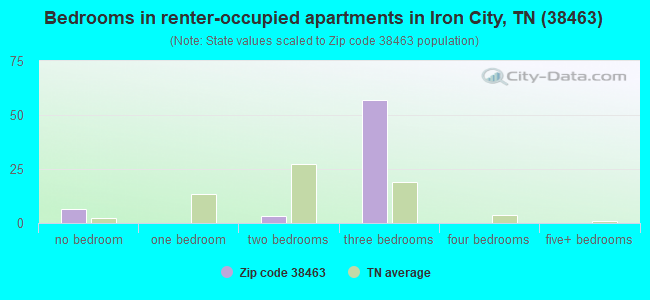
% of renters here:
6%
State:
33%
March 2022 cost of living index in zip code 38463: 77.8 (low, U.S. average is 100)
Land area: 113.2 sq. mi. Water area: 0.1 sq. mi.
Population density: 25 people per square mile
(very low).
OSM Map
General Map
Google Map
MSN Map
OSM Map
General Map
Google Map
MSN Map
OSM Map
General Map
Google Map
MSN Map
OSM Map
General Map
Google Map
MSN Map
Please wait while loading the map...
Real estate property taxes paid for housing units in 2022:
This zip code:
0.4% ($771)
Tennessee:
0.5% ($1,376)
Median real estate property taxes paid for housing units with mortgages in 2022: $839 (0.4%) Median real estate property taxes paid for housing units with no mortgage in 2022: $676 (0.5%)
Averages for the 2020 tax year for zip code 38463, filed in 2021:
Average Adjusted Gross Income (AGI) in 2020: $47,014 (Individual Income Tax Returns)
Here:
$47,014
State:
$69,014
Salary/wage: $46,969 (reported on 81.8% of returns)
Here:
$46,969
State:
$55,872
(% of AGI for various income ranges: 1131.6% for AGIs below $25k, 3722.5% for AGIs $25k-50k, 6951.7% for AGIs $50k-75k, 10053.3% for AGIs $75k-100k, 15550.0% for AGIs $100k-200k)
Taxable interest for individuals: $556 (reported on 29.1% of returns)
This zip code:
$556
Tennessee:
$1,945
(% of AGI for various income ranges: 18.7% for AGIs below $25k, 13.3% for AGIs $25k-50k, 21.7% for AGIs $50k-75k, 48.9% for AGIs $75k-100k, 22.5% for AGIs $100k-200k)
Ordinary dividends: $1,517 (reported on 5.5% of returns)
Here:
$1,517
State:
$8,105
(% of AGI for various income ranges: 25.0% for AGIs $25k-50k, 34.4% for AGIs $75k-100k)
Net capital gain/loss in AGI: +$7,675 (reported on 7.3% of returns)
Here:
+$7,675
State:
+$33,664
(% of AGI for various income ranges: 25.0% for AGIs $25k-50k, 75.8% for AGIs $50k-75k, 578.8% for AGIs $100k-200k)
Profit/loss from business: +$7,850 (reported on 14.5% of returns)
Here:
+$7,850
State:
+$18,991
(% of AGI for various income ranges: 168.4% for AGIs below $25k, 192.5% for AGIs $25k-50k, 235.8% for AGIs $50k-75k)
Taxable individual retirement arrangement distribution: $6,420 (reported on 4.5% of returns)
38463:
$6,420
Tennessee:
$20,036
(% of AGI for various income ranges: 133.8% for AGIs $25k-50k)
Earned income credit: $2,464 (reported on 20.0% of returns)
Here:
$2,464
State:
$2,391
(% of AGI for various income ranges: 112.9% for AGIs below $25k, 80.0% for AGIs $25k-50k)
Percentage of individuals using paid preparers for their 2020 taxes: 96.4%
Here:
96%
State:
93%
(% for various income ranges: 95.2% for AGIs below $25k, 96.6% for AGIs $25k-50k, 93.8% for AGIs $50k-75k, 100.0% for AGIs $75k-100k, 100.0% for AGIs $100k-200k)
Averages for the 2012 tax year for zip code 38463, filed in 2013:
Average Adjusted Gross Income (AGI) in 2012: $36,105 (Individual Income Tax Returns)
Here:
$36,105
State:
$53,767
Salary/wage: $36,917 (reported on 83.2% of returns)
Here:
$36,917
State:
$45,421
(% of AGI for various income ranges: 71.2% for AGIs below $25k, 84.1% for AGIs $25k-50k, 91.9% for AGIs $50k-75k, 92.3% for AGIs $75k-100k, 83.7% for AGIs $100k-200k)
Taxable interest for individuals: $890 (reported on 29.7% of returns)
This zip code:
$890
Tennessee:
$1,732
(% of AGI for various income ranges: 1.8% for AGIs below $25k, 1.0% for AGIs $25k-50k, 0.3% for AGIs $50k-75k, 0.3% for AGIs $75k-100k, 0.2% for AGIs $100k-200k)
Ordinary dividends: $560 (reported on 5.0% of returns)
Here:
$560
State:
$6,739
Net capital gain/loss in AGI: +$5,940 (reported on 5.0% of returns)
Here:
+$5,940
State:
+$19,082
Profit/loss from business: +$5,995 (reported on 18.8% of returns)
Here:
+$5,995
State:
+$15,240
(% of AGI for various income ranges: 13.3% for AGIs below $25k, 2.1% for AGIs $25k-50k, 0.7% for AGIs $50k-75k, 0.9% for AGIs $75k-100k)
Taxable individual retirement arrangement distribution: $6,840 (reported on 5.0% of returns)
38463:
$6,840
Tennessee:
$15,505
(% of AGI for various income ranges: 2.9% for AGIs below $25k, 1.7% for AGIs $25k-50k)
Total itemized deductions: $17,563 (28% of AGI, reported on 18.8% of returns)
Here:
$17,563
State:
$21,976
Here:
28.5% of AGI
State:
17.8% of AGI
(% of AGI for various income ranges: 5.5% for AGIs below $25k, 8.0% for AGIs $25k-50k, 10.1% for AGIs $50k-75k, 9.3% for AGIs $75k-100k, 13.0% for AGIs $100k-200k)
Charity contributions: $3,379 (reported on 13.9% of returns)
Here:
$3,379
State:
$6,709
(% of AGI for various income ranges: 0.6% for AGIs below $25k, 0.9% for AGIs $25k-50k, 1.2% for AGIs $50k-75k, 1.7% for AGIs $75k-100k, 2.4% for AGIs $100k-200k)
Taxes paid: $2,872 (reported on 17.8% of returns)
38463:
$2,872
State:
$4,829
(% of AGI for various income ranges: 0.7% for AGIs below $25k, 1.1% for AGIs $25k-50k, 1.4% for AGIs $50k-75k, 1.8% for AGIs $75k-100k, 2.2% for AGIs $100k-200k)
Earned income credit: $2,293 (reported on 28.7% of returns)
Here:
$2,293
State:
$2,404
(% of AGI for various income ranges: 8.2% for AGIs below $25k, 1.7% for AGIs $25k-50k)
Percentage of individuals using paid preparers for their 2012 taxes: 76.2%
Here:
76%
State:
52%
(% for various income ranges: 69.4% for AGIs below $25k, 76.9% for AGIs $25k-50k, 92.9% for AGIs $50k-75k, 85.7% for AGIs $75k-100k, 80.0% for AGIs $100k-200k)
Averages for the 2004 tax year for zip code 38463, filed in 2005:
Average Adjusted Gross Income (AGI) in 2004: $27,846 (Individual Income Tax Returns)
Here:
$27,846
State:
$44,088
Salary/wage: $28,096 (reported on 86.8% of returns)
Here:
$28,096
State:
$38,825
(% of AGI for various income ranges: 206.2% for AGIs below $10k, 76.3% for AGIs $10k-25k, 88.1% for AGIs $25k-50k, 92.7% for AGIs $50k-75k, 87.0% for AGIs $75k-100k, 69.5% for AGIs over 100k)
Taxable interest for individuals: $847 (reported on 38.8% of returns)
This zip code:
$847
Tennessee:
$1,802
(% of AGI for various income ranges: 10.1% for AGIs below $10k, 2.4% for AGIs $10k-25k, 0.9% for AGIs $25k-50k, 0.4% for AGIs $50k-75k, 0.8% for AGIs $75k-100k)
Taxable dividends: $362 (reported on 5.7% of returns)
Here:
$362
State:
$3,727
(% of AGI for various income ranges: 0.7% for AGIs below $10k, 0.1% for AGIs $10k-25k, 0.0% for AGIs $25k-50k, 0.1% for AGIs $50k-75k)
Net capital gain/loss: +$3,241 (reported on 8.2% of returns)
Here:
+$3,241
State:
+$15,776
(% of AGI for various income ranges: 8.6% for AGIs below $10k, 1.0% for AGIs $10k-25k, 1.3% for AGIs $25k-50k, 0.6% for AGIs $50k-75k)
Profit/loss from business: +$6,435 (reported on 14.5% of returns)
Here:
+$6,435
State:
+$12,882
(% of AGI for various income ranges: 34.3% for AGIs below $10k, 7.1% for AGIs $10k-25k, 3.6% for AGIs $25k-50k, 0.5% for AGIs $50k-75k)
IRA payment deduction: $3,333 (reported on 1.5% of returns)
38463:
$3,333
Tennessee:
$2,934
Total itemized deductions: $14,644 (28% of AGI, reported on 13.3% of returns)
Here:
$14,644
State:
$18,035
Here:
28.2% of AGI
State:
19.9% of AGI
(% of AGI for various income ranges: 5.4% for AGIs $10k-25k, 5.5% for AGIs $25k-50k, 8.3% for AGIs $50k-75k, 16.2% for AGIs $75k-100k)
Charity contributions deductions: $2,184 (4% of AGI, reported on 10.2% of returns)
Here:
$2,184
State:
$5,167
Here:
4.3% of AGI
State:
5.3% of AGI
(% of AGI for various income ranges: 0.7% for AGIs $10k-25k, 0.6% for AGIs $25k-50k, 1.0% for AGIs $50k-75k, 1.9% for AGIs $75k-100k)
Total tax: $2,812 (reported on 65.6% of returns)
38463:
$2,812
State:
$7,482
(% of AGI for various income ranges: 7.2% for AGIs below $10k, 3.5% for AGIs $10k-25k, 5.0% for AGIs $25k-50k, 7.4% for AGIs $50k-75k, 10.6% for AGIs $75k-100k, 17.2% for AGIs over 100k)
Earned income credit: $1,784 (reported on 29.2% of returns)
Here:
$1,784
State:
$1,826
Percentage of individuals using paid preparers for their 2004 taxes: 78.3%
Here:
78%
State:
60%
(% for various income ranges: 69.2% for AGIs below $10k, 79.7% for AGIs $10k-25k, 81.0% for AGIs $25k-50k, 78.8% for AGIs $50k-75k, 86.8% for AGIs $75k-100k, 100.0% for AGIs over 100k)
Household received Food Stamps/SNAP in the past 12 months: 167 Household did not receive Food Stamps/SNAP in the past 12 months: 989
Women who had a birth in the past 12 months: 19 (20 now married, 0 unmarried) Women who did not have a birth in the past 12 months: 624 (288 now married, 336 unmarried)
Housing units in zip code 38463 with a mortgage: 546 (56 second mortgage, 45 both second mortgage and home equity loan) Houses without a mortgage: 7
Median monthly owner costs for units with a mortgage: $1,032 Median monthly owner costs for units without a mortgage: $395
Residents with income below the poverty level in 2022:
This zip code:
8.5%
Whole state:
13.3%
Residents with income below 50% of the poverty level in 2022:
This zip code:
4.0%
Whole state:
7.1%
Median number of rooms in houses and condos:
Here:
6.2
State:
6.5
Median number of rooms in apartments:
Here:
4.9
State:
4.4
Notable locations in this zip code not listed on our city pages
Notable locations in zip code 38463: Whitten Farms (A), Holly Creek Volunteer Fire Department (B), Iron City Volunteer Fire Department (C), Southgate Volunteer Fire Department (D). Display/hide their locations on the map
Churches in zip code 38463 include: Fairview Church (A), Cedar Grove Baptist Church (B), Mount Nebo Cumberland Presbyterian Church (C), Pleasant Springs Church (D), Oak Grove Baptist Church (E), Wayland Springs Methodist Church (F), Iron City Methodist Church (G), Iron City Freewill Baptist Church (H), Iron City Baptist Church (I). Display/hide their locations on the map
Cemeteries: Wade Cemetery (1), Shiloh Cemetery (2), Wolf Creek Cemetery (3), Wayland Springs Cemetery (4), Mount Nebo Cemetery (5), Whittens Cross Roads Cemetery (6), Simmons Cemetery (7). Display/hide their locations on the map
Streams, rivers, and creeks: Little Dry Branch (A), Spain Branch (B), Fantail Branch (C), Carter Branch (D), First Butler Creek (E), Holly Creek (F), Brewer Branch (G), Last Butler Creek (H), Middle Butler Creek (I). Display/hide their locations on the map
Size of family households: 322 2-persons, 173 3-persons, 162 4-persons, 84 5-persons, 12 6-persons, 8 7-or-more-persons
Size of nonfamily households: 267 1-person, 132 2-persons
375 married couples with children.
101 single-parent households (45 men, 56 women).
99.0% of residents of 38463 zip code speak English at home.
0.9% of residents speak other Indo-European language at home (100% very well).
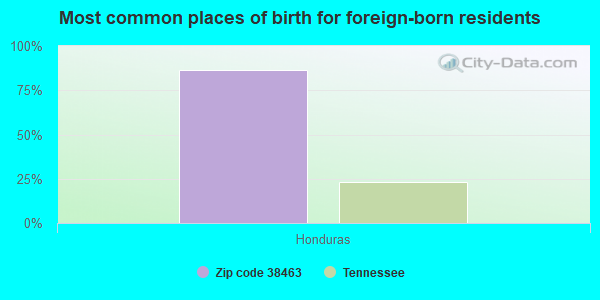
Foreign born population: 22 (0.8%) (100.0% of them are naturalized citizens)
This zip code:
0.8%
Whole state:
5.6%
86%Honduras
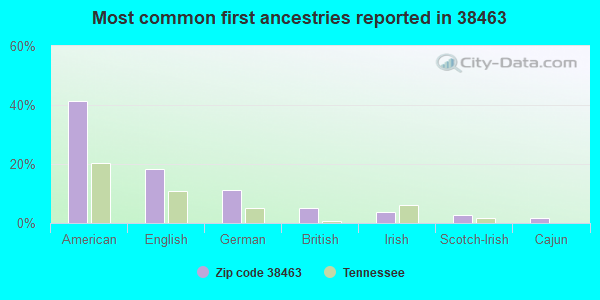
41%American
18%English
11%German
5%British
4%Irish
3%Scotch-Irish
2%Cajun
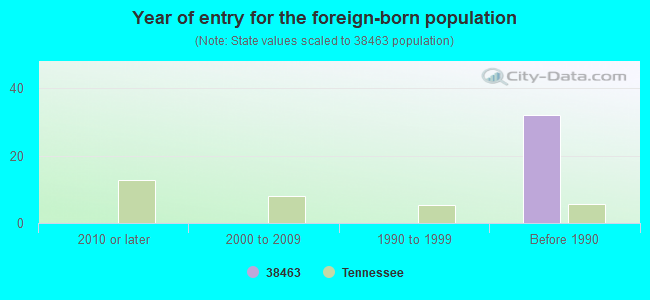
Year of entry for the foreign-born population
02010 or later
02000 to 2009
01990 to 1999
32Before 1990
Facilities with environmental interests located in this zip code:
EDDY DAVID E (RURAL RT 1 in IRON CITY, TN)
(Resource Conservation and Recovery Act (tracking hazardous waste)) Business NAICS classification: BURIAL CASKET MANUFACTURING.
ETHEREDGE MFG. CO. (DIEMASTER MACHINE & TOOL CO 61 in IRON CITY, TN)
(Resource Conservation and Recovery Act (tracking hazardous waste)) Business NAICS classification: BURIAL CASKET MANUFACTURING.
Housing units lacking complete plumbing facilities: 3.3% Housing units lacking complete kitchen facilities: 3.7%
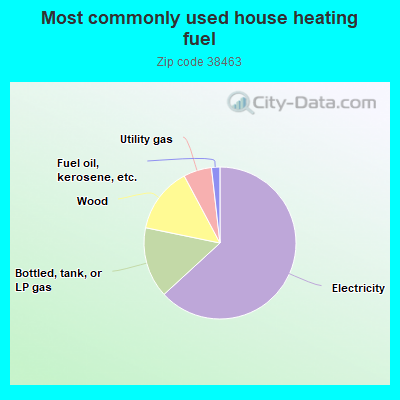
63.3%Electricity
15.1%Bottled, tank, or LP gas
14.0%Wood
6.0%Utility gas
1.8%Fuel oil, kerosene, etc.
Population in 1990: 2,249. Population change in the 1990s: +390 (+17.3%).
Place of birth for U.S.-born residents:
This state: 1,470
Northeast: 101
Midwest: 143
South: 1,080
West: 14
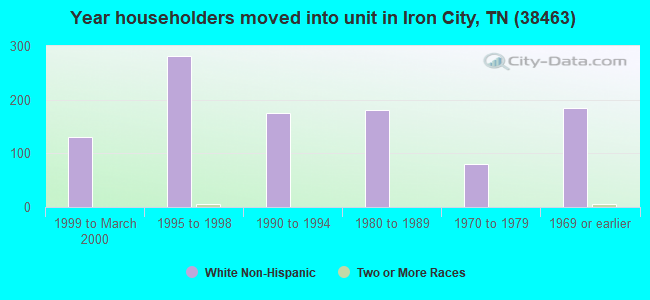
66% of the 38463 zip code residents lived in the same house 5 years ago. Out of people who lived in different houses, 54% lived in this county. Out of people who lived in different counties, 50% lived in Tennessee.
96% of the 38463 zip code residents lived in the same house 1 year ago. Out of people who lived in different houses, 32% moved from this county. Out of people who lived in different houses, 84% moved from different state.
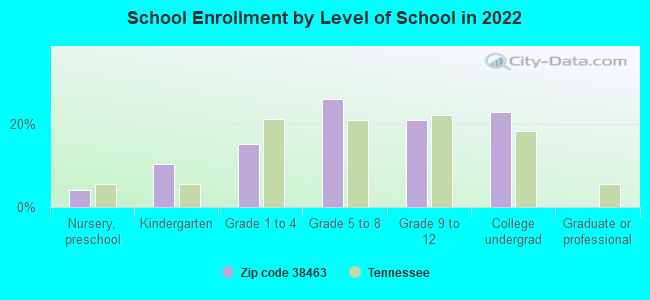
Private vs. public school enrollment:
Students in private schools in grades 1 to 8 (elementary and middle school):
Here:
0.0%
Tennessee:
15.0%
Students in private schools in grades 9 to 12 (high school):
Here:
0.0%
Tennessee:
16.2%
Students in private undergraduate colleges: 19
Here:
17.2%
Tennessee:
23.5%
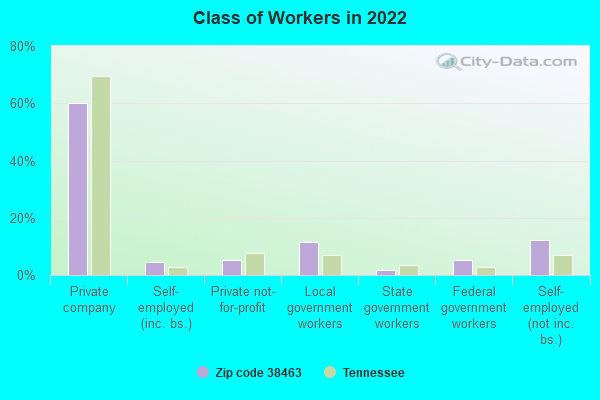
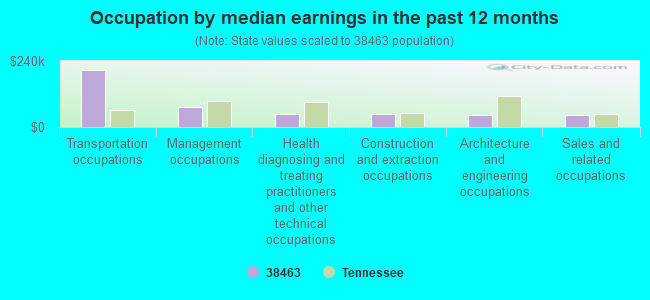
Occupation by median earnings in the past 12 months ($)
208,807Transportation occupations
71,295Management occupations
48,009Health diagnosing and treating practitioners and other technical occupations
46,070Construction and extraction occupations
44,633Architecture and engineering occupations
43,645Sales and related occupations
Top industries in this zip code by the number of employees in 2005:
Construction: Site Preparation Contractors (10-19 employees: 1 establishment)
Health Care and Social Assistance: Child Day Care Services (5-9: 1, 1-4: 1)
Accommodation and Food Services: Full-Service Restaurants (5-9: 1)
Other Services (except Public Administration): Automotive Exhaust System Repair (1-4: 1)
Fatal accident statistics in 2014:
Fatal accident count: 1
Vehicles involved in fatal accidents: 1
Fatal accidents caused by drunken drivers: 0
Fatalities: 2
Persons involved in fatal accidents: 2
Pedestrians involved in fatal accidents: 0
Fatal accident statistics in 2012:
Fatal accident count: 2
Vehicles involved in fatal accidents: 2
Fatal accidents caused by drunken drivers: 0
Fatalities: 3
Persons involved in fatal accidents: 6
Pedestrians involved in fatal accidents: 0
2002 - 2018 National Fire Incident Reporting System (NFIRS) incidents
Based on the data from the years 2002 - 2018 the average number of fires per year is 29. The highest number of fire incidents - 75 took place in 2007, and the least - 2 in 2002. The data has a rising trend.
When looking into fire subcategories, the most incidents belonged to: Structure Fires (37.7%), and Outside Fires (34.2%).
Fire incident types reported to NFIRS in Zip Code 38463
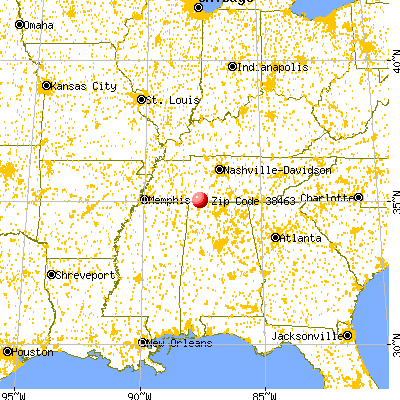


 Nearest zip codes: 38486, 38452, 35634, 38481, 38450, 38469.
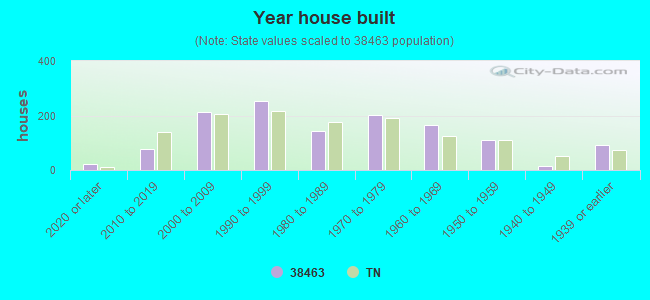


 Based on the data from the years 2002 - 2018 the average number of fires per year is 29. The highest number of fire incidents - 75 took place in 2007, and the least - 2 in 2002. The data has a rising trend.
 When looking into fire subcategories, the most incidents belonged to: Structure Fires (37.7%), and Outside Fires (34.2%).