Estimated zip code population in 2022: 959 Zip code population in 2010: 1,353 Zip code population in 2000: 1,469
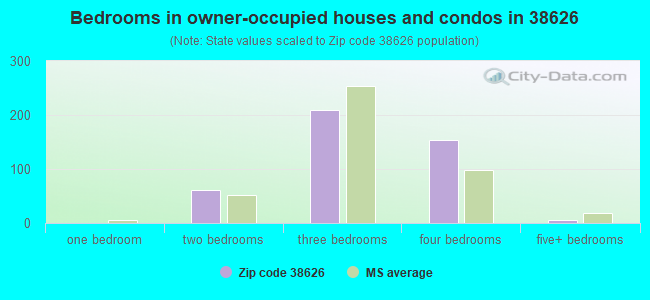
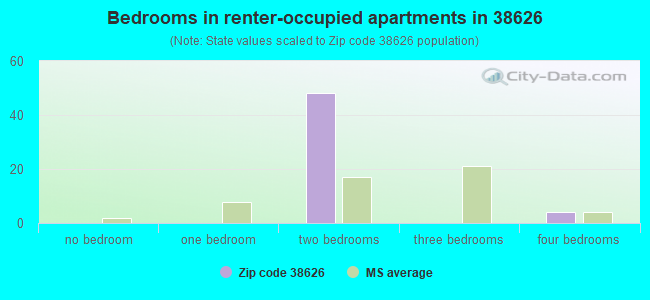
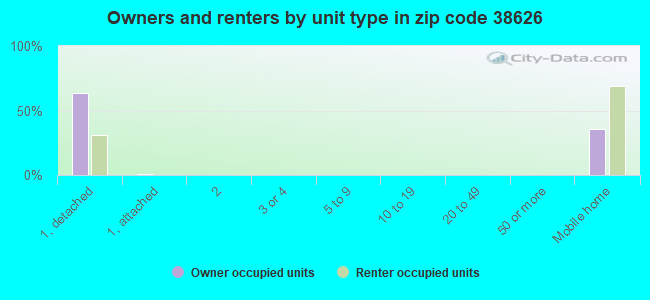
Houses and condos: 731 Renter-occupied apartments: 54
% of renters here:
11%
State:
30%
March 2022 cost of living index in zip code 38626: 81.1 (low, U.S. average is 100)
Land area: 161.1 sq. mi. Water area: 5.6 sq. mi.
Population density: 6 people per square mile
(very low).
OSM Map
General Map
Google Map
MSN Map
OSM Map
General Map
Google Map
MSN Map
OSM Map
General Map
Google Map
MSN Map
OSM Map
General Map
Google Map
MSN Map
Please wait while loading the map...
Median real estate property taxes paid for housing units with mortgages in 2022: $2,453 Median real estate property taxes paid for housing units with no mortgage in 2022: $467
Business Search- 14 Million verified businesses
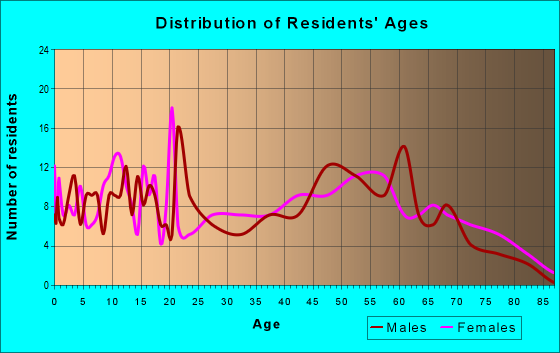
Males: 538
(56.1%)
Females: 420
(43.9%)
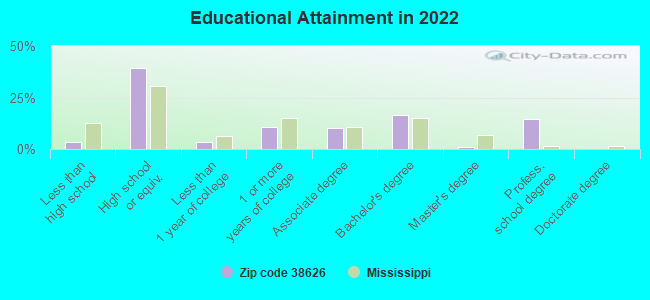
For population 25 years and over in 38626:
High school or higher: 96.3%
Bachelor's degree or higher: 32.2%
Graduate or professional degree: 15.8%
Unemployed: 0.8%
Mean travel time to work (commute): 26.4 minutes
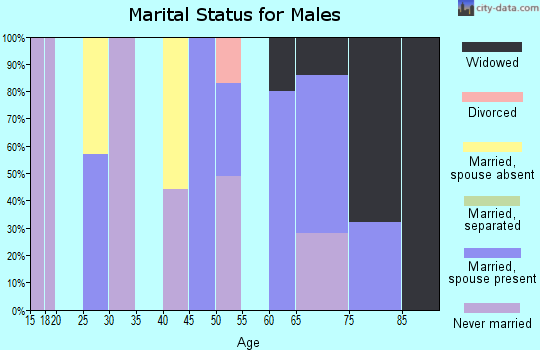
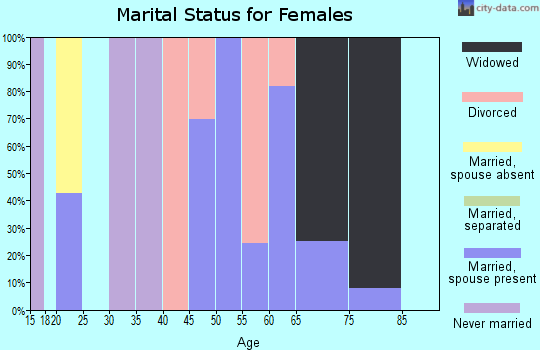
For population 15 years and over in 38626:
Never married: 26.6%
Now married: 51.4%
Separated: 0.0%
Widowed: 6.1%
Divorced: 15.8%
Zip code 38626 compared to state average:
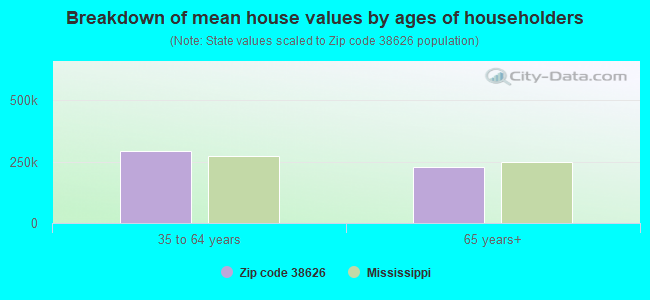
Median house value above state average.
Unemployed percentage significantly below state average.
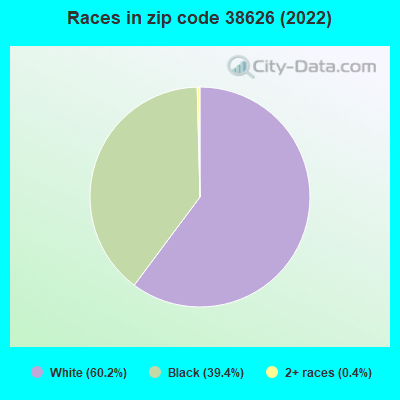
Hispanic race population percentage significantly below state average.
Median age significantly above state average.
Foreign-born population percentage significantly below state average.
Renting percentage significantly below state average.
Length of stay since moving in above state average.
Number of college students significantly below state average.
Percentage of population with a bachelor's degree or higher above state average.
Estimated median house/condo value in 2022: $328,121
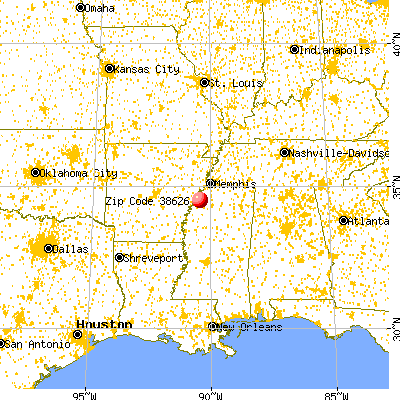
38626:
$328,121
Mississippi:
$162,500
According to our research of Mississippi and other state lists, there was 1 registered sex offender living in 38626 zip code as of April 25, 2024. The ratio of all residents to sex offenders in zip code 38626 is 1,421 to 1. The ratio of registered sex offenders to all residents in this zip code is much lower than the state average.
Median resident age:
This zip code:
60.6 years
Mississippi median age:
38.9 years
Average household size:
This zip code:
2.0 people
Mississippi:
2.5 people
Averages for the 2020 tax year for zip code 38626, filed in 2021:
Average Adjusted Gross Income (AGI) in 2020: $57,625 (Individual Income Tax Returns)
Here:
$57,625
State:
$54,084
Salary/wage: $32,885 (reported on 85.0% of returns)
Here:
$32,885
State:
$45,187
(% of AGI for various income ranges: 1431.5% for AGIs below $25k, 3880.0% for AGIs $25k-50k, 6532.5% for AGIs $50k-75k)
Taxable interest for individuals: $1,533 (reported on 15.0% of returns)
This zip code:
$1,533
Mississippi:
$1,434
(% of AGI for various income ranges: 6.2% for AGIs below $25k)
Ordinary dividends: $8,467 (reported on 7.5% of returns)
Here:
$8,467
State:
$6,661
(% of AGI for various income ranges: 635.0% for AGIs $50k-75k)
Net capital gain/loss in AGI: +$30,367 (reported on 7.5% of returns)
Here:
+$30,367
State:
+$16,833
(% of AGI for various income ranges: 911.0% for AGIs $25k-50k)
Total itemized deductions: $32,350 (reported on 5.0% of returns)
Here:
$32,350
State:
$34,027
(% of AGI for various income ranges: 647.0% for AGIs $25k-50k)
Charity contributions: $14,150 (reported on 5.0% of returns)
Here:
$14,150
State:
$14,997
(% of AGI for various income ranges: 217.7% for AGIs below $25k)
Taxes paid: $7,250 (reported on 5.0% of returns)
38626:
$7,250
State:
$6,353
(% of AGI for various income ranges: 111.5% for AGIs below $25k)
Earned income credit: $2,646 (reported on 32.5% of returns)
Here:
$2,646
State:
$2,689
(% of AGI for various income ranges: 165.4% for AGIs below $25k, 129.0% for AGIs $25k-50k)
Percentage of individuals using paid preparers for their 2020 taxes: 90.0%
Here:
90%
State:
94%
(% for various income ranges: 94.1% for AGIs below $25k, 92.3% for AGIs $25k-50k, 83.3% for AGIs $50k-75k, 75.0% for AGIs $100k-200k)
Averages for the 2012 tax year for zip code 38626, filed in 2013:
Average Adjusted Gross Income (AGI) in 2012: $47,939 (Individual Income Tax Returns)
Here:
$47,939
State:
$46,197
Salary/wage: $27,733 (reported on 85.7% of returns)
Here:
$27,733
State:
$38,549
(% of AGI for various income ranges: 88.5% for AGIs below $25k, 88.8% for AGIs $25k-50k, 68.9% for AGIs $50k-75k, 15.7% for AGIs $100k-200k)
Taxable interest for individuals: $2,183 (reported on 12.2% of returns)
This zip code:
$2,183
Mississippi:
$1,482
Ordinary dividends: $7,100 (reported on 4.1% of returns)
Here:
$7,100
State:
$5,401
Net capital gain/loss in AGI: +$12,667 (reported on 6.1% of returns)
Here:
+$12,667
State:
+$12,121
Profit/loss from business: +$2,550 (reported on 16.3% of returns)
Here:
+$2,550
State:
+$10,220
Total itemized deductions: $22,873 (18% of AGI, reported on 22.4% of returns)
Here:
$22,873
State:
$22,078
Here:
17.8% of AGI
State:
21.8% of AGI
(% of AGI for various income ranges: 15.6% for AGIs $25k-50k, 12.3% for AGIs $50k-75k, 11.7% for AGIs $100k-200k)
Charity contributions: $5,825 (reported on 16.3% of returns)
Here:
$5,825
State:
$6,081
Taxes paid: $4,236 (reported on 22.4% of returns)
38626:
$4,236
State:
$5,794
(% of AGI for various income ranges: 1.5% for AGIs $25k-50k, 2.5% for AGIs $50k-75k, 2.7% for AGIs $100k-200k)
Earned income credit: $2,761 (reported on 46.9% of returns)
Here:
$2,761
State:
$2,710
(% of AGI for various income ranges: 14.2% for AGIs below $25k, 2.2% for AGIs $25k-50k)
Percentage of individuals using paid preparers for their 2012 taxes: 65.3%
Here:
65%
State:
60%
(% for various income ranges: 61.5% for AGIs below $25k, 64.3% for AGIs $25k-50k, 80.0% for AGIs $50k-75k, 75.0% for AGIs $100k-200k)
Averages for the 2004 tax year for zip code 38626, filed in 2005:
Average Adjusted Gross Income (AGI) in 2004: $31,657 (Individual Income Tax Returns)
Here:
$31,657
State:
$36,110
Salary/wage: $22,047 (reported on 91.3% of returns)
Here:
$22,047
State:
$31,757
(% of AGI for various income ranges: 151.3% for AGIs below $10k, 91.4% for AGIs $10k-25k, 89.1% for AGIs $25k-50k, 69.2% for AGIs $50k-75k, 75.3% for AGIs $75k-100k, 10.1% for AGIs over 100k)
Taxable interest for individuals: $3,940 (reported on 17.0% of returns)
This zip code:
$3,940
Mississippi:
$1,649
(% of AGI for various income ranges: 4.3% for AGIs below $10k, 0.4% for AGIs $10k-25k, 0.3% for AGIs $25k-50k, 0.6% for AGIs $50k-75k, 5.9% for AGIs over 100k)
Taxable dividends: $4,585 (reported on 8.3% of returns)
Here:
$4,585
State:
$3,089
Net capital gain/loss: +$9,406 (reported on 6.5% of returns)
Here:
+$9,406
State:
+$8,427
Profit/loss from business: +$1,568 (reported on 7.5% of returns)
Here:
+$1,568
State:
+$8,818
Profit/loss from farming: +$5,800 (reported on 2.0% of returns)
Here:
+$5,800
State:
-$5,673
Total itemized deductions: $17,195 (22% of AGI, reported on 16.6% of returns)
Here:
$17,195
State:
$17,896
Here:
21.9% of AGI
State:
22.5% of AGI
(% of AGI for various income ranges: 3.0% for AGIs $10k-25k, 11.5% for AGIs $25k-50k, 17.7% for AGIs $50k-75k, 18.2% for AGIs $75k-100k, 6.7% for AGIs over 100k)
Charity contributions deductions: $4,297 (4% of AGI, reported on 13.0% of returns)
Here:
$4,297
State:
$4,735
Here:
4.4% of AGI
State:
5.7% of AGI
(% of AGI for various income ranges: 1.8% for AGIs $25k-50k, 2.9% for AGIs $50k-75k, 2.6% for AGIs $75k-100k, 2.6% for AGIs over 100k)
Total tax: $5,919 (reported on 47.9% of returns)
38626:
$5,919
State:
$5,562
(% of AGI for various income ranges: 2.3% for AGIs below $10k, 1.7% for AGIs $10k-25k, 6.0% for AGIs $25k-50k, 8.9% for AGIs $50k-75k, 11.8% for AGIs $75k-100k, 16.7% for AGIs over 100k)
Earned income credit: $2,276 (reported on 51.5% of returns)
Here:
$2,276
State:
$2,107
Percentage of individuals using paid preparers for their 2004 taxes: 76.1%
Here:
76%
State:
65%
(% for various income ranges: 73.8% for AGIs below $10k, 78.8% for AGIs $10k-25k, 69.3% for AGIs $25k-50k, 67.7% for AGIs $50k-75k, 93.8% for AGIs $75k-100k, 93.8% for AGIs over 100k)
Household received Food Stamps/SNAP in the past 12 months: 12 Household did not receive Food Stamps/SNAP in the past 12 months: 466
Women who did not have a birth in the past 12 months: 69 (62 now married, 6 unmarried)
Housing units in zip code 38626 with a mortgage: 153 (15 second mortgage, 15 both second mortgage and home equity loan) Median monthly owner costs for units with a mortgage: $2,517 Median monthly owner costs for units without a mortgage: $499
Residents with income below the poverty level in 2022:
This zip code:
30.8%
Whole state:
19.1%
Residents with income below 50% of the poverty level in 2022:
This zip code:
23.3%
Whole state:
10.3%
Median number of rooms in houses and condos:
Here:
6.0
State:
6.3
Median number of rooms in apartments:
Here:
4.0
State:
4.8
Notable locations in this zip code not listed on our city pages
Churches in zip code 38626 include: Oak Grove Church (A), Peters Rock Church (B), Phillips Church (C), Pleasant Grove Church (D), Prospect Church (E), Withers Church (F), Rising Sun Church (G), Sanders Church (H), Antioch Church (I). Display/hide their locations on the map
Cemeteries: Church of God Cemetery (1), Mount Olive Cemetery (2), Dowd Cemetery (3), Mount Sinia Cemetery (4), Kyles Cemetery (5), Walton Cemetery (6), Saunder Chapel Cemetery (7). Display/hide their locations on the map
Lakes and swamps: Sixmile Lake (A), Eagle Lake (B), Lake Tyranza (C), Twomile Lake (D), Bear Lake (E), Trout Lake (F), Souva Lake (G), Cypress Lake (H). Display/hide their locations on the map
Size of family households: 263 2-persons, 3 3-persons, 42 4-persons, 6 5-persons
Size of nonfamily households: 166 1-person
114 married couples with children.
0 single-parent households ().
100.3% of residents of 38626 zip code speak English at home.
0.5% of residents speak Spanish at home (100% well).
Foreign born population: 0 (0.0%)
:
0.0%
Whole state:
2.2%
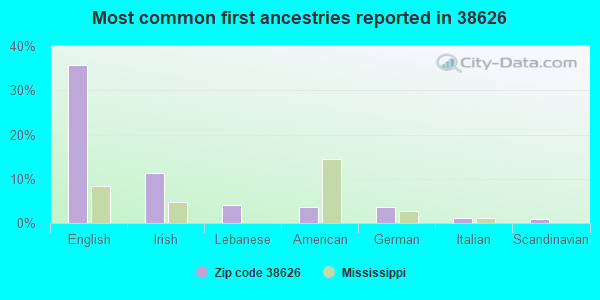
36%English
11%Irish
4%Lebanese
4%American
4%German
1%Italian
1%Scandinavian
Facilities with environmental interests located in this zip code:
AUSTIN TRAILER PARK (HIGHWAY 61 SOUTH in DUNDEE, MS)
STATE MASTER (Mississippi compliance, permits, activity tracking ) - ENSITE-MS0051934, National Pollutant Discharge Elimination System Permit National Pollutant Discharge Elimination System NON-MAJOR (Tracking pollutant discharge elimination systems) - permit Business SIC classification: OPERATORS OF RESIDENTIAL MOBILE HOME SITES Alternative names: TUNICA COUNTY
HAWKINS STORE (1052 RYALS ROAD in DUNDEE, MS)
STATE MASTER (Mississippi compliance, permits, activity tracking ) - ENSITE-MSU096001, WASTEWATER FACILITY National Pollutant Discharge Elimination System NON-MAJOR (Tracking pollutant discharge elimination systems) - permit Business SIC classification: GASOLINE SERVICE STATIONS Alternative names: TUNICA
CLAYTON ELEVATOR INC. (RT 1 BOX 384 in DUNDEE, MS)
COMPLIANCE ACTIVITY (Tracking inspections of insecticide, fungicide, and rodenticide, and toxic substances)
Housing units lacking complete plumbing facilities: 7.6% Housing units lacking complete kitchen facilities: 4.8%
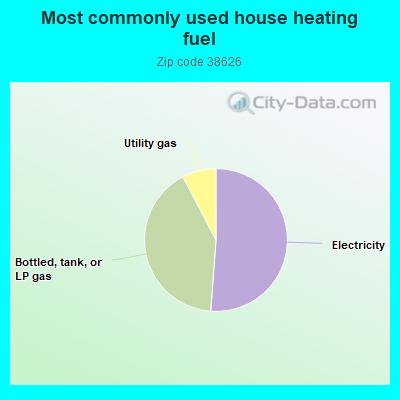
51.4%Electricity
41.3%Bottled, tank, or LP gas
7.7%Utility gas
Population in 1990: 1,443. Population change in the 1990s: +26 (+1.8%).
Place of birth for U.S.-born residents:
This state: 598
Midwest: 4
South: 353
West: 3
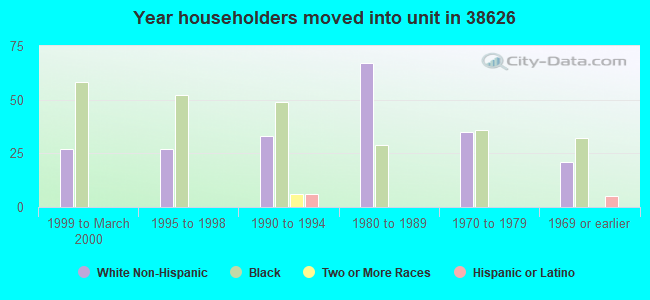
66% of the 38626 zip code residents lived in the same house 5 years ago. Out of people who lived in different houses, 57% lived in this county. Out of people who lived in different counties, 50% lived in Mississippi.
95% of the 38626 zip code residents lived in the same house 1 year ago. Out of people who lived in different houses, 100% moved from different county within same state.
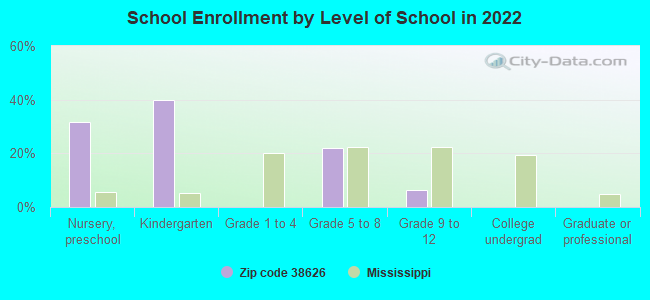
Private vs. public school enrollment:
Students in private schools in grades 1 to 8 (elementary and middle school): 9
Here:
36.9%
Mississippi:
16.1%
Students in private schools in grades 9 to 12 (high school): 8
Here:
100.0%
Mississippi:
14.6%
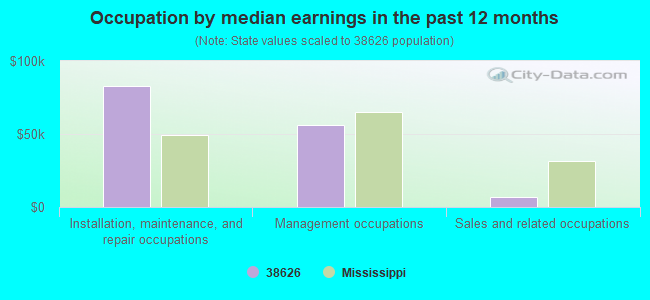
Occupation by median earnings in the past 12 months ($)
82,671Installation, maintenance, and repair occupations
56,120Management occupations
7,014Sales and related occupations
Top industries in this zip code by the number of employees in 2005:
Administrative and Support and Waste Management and Remediation Services: Landscaping Services (5-9 employees: 1 establishment)
Accommodation and Food Services: Full-Service Restaurants (1-4: 2)
Real Estate and Rental and Leasing: Residential Property Managers (1-4: 1)
Accommodation and Food Services: Limited-Service Restaurants (1-4: 1)
Fatal accident statistics in 2010:
Fatal accident count: 1
Vehicles involved in fatal accidents: 2
Fatal accidents caused by drunken drivers: 2
Fatalities: 1
Persons involved in fatal accidents: 3
Pedestrians involved in fatal accidents: 0
2003 - 2018 National Fire Incident Reporting System (NFIRS) incidents
Based on the data from the years 2003 - 2018 the average number of fires per year is 7. The highest number of reported fires - 18 took place in 2005, and the least - 0 in 2014. The data has a declining trend.
When looking into fire subcategories, the most incidents belonged to: Structure Fires (36.8%), and Mobile Property/Vehicle Fires (35.1%).
Fire incident types reported to NFIRS in Zip Code 38626


+$5,800
-$5,673
 Nearest zip codes: 38644, 38676, 38670, 38617, 38623, 38639.


 Based on the data from the years 2003 - 2018 the average number of fires per year is 7. The highest number of reported fires - 18 took place in 2005, and the least - 0 in 2014. The data has a declining trend.
 When looking into fire subcategories, the most incidents belonged to: Structure Fires (36.8%), and Mobile Property/Vehicle Fires (35.1%).