Estimated zip code population in 2022: 14,220 Zip code population in 2010: 12,225 Zip code population in 2000: 9,539
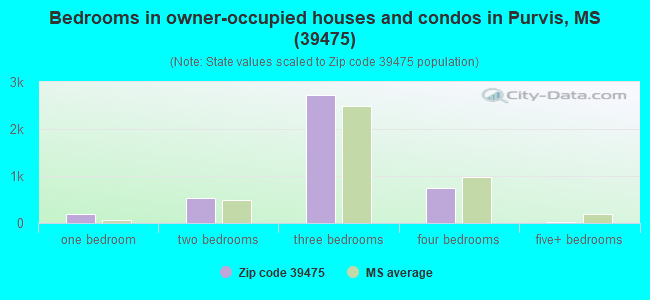
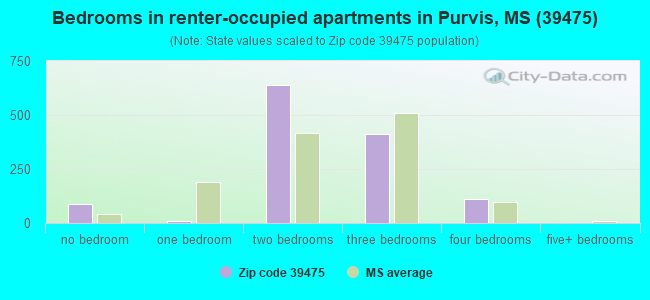
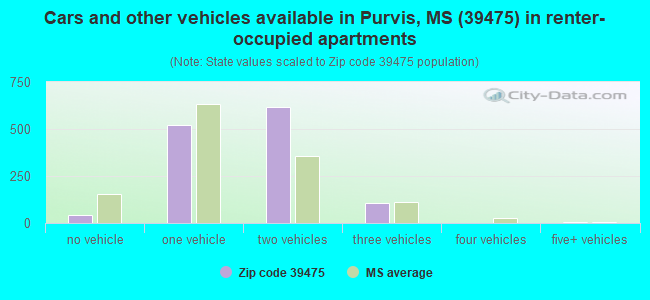
Houses and condos: 5,921 Renter-occupied apartments: 1,284
% of renters here:
23%
State:
30%
March 2022 cost of living index in zip code 39475: 79.2 (low, U.S. average is 100)
Land area: 167.9 sq. mi. Water area: 0.5 sq. mi.
Population density: 85 people per square mile
(very low).
OSM Map
General Map
Google Map
MSN Map
OSM Map
General Map
Google Map
MSN Map
OSM Map
General Map
Google Map
MSN Map
OSM Map
General Map
Google Map
MSN Map
Please wait while loading the map...
Real estate property taxes paid for housing units in 2022:
This zip code:
0.7% ($1,189)
Mississippi:
0.7% ($1,161)
Median real estate property taxes paid for housing units with mortgages in 2022: $1,427 (0.7%) Median real estate property taxes paid for housing units with no mortgage in 2022: $711 (0.6%)
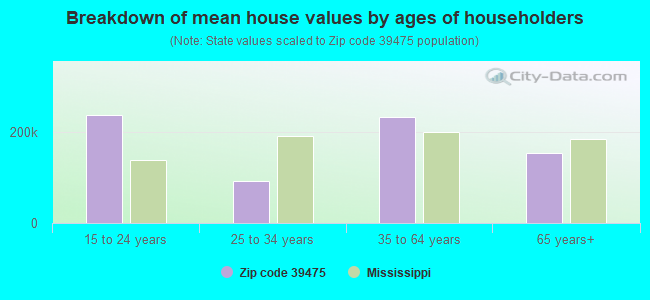
Estimated median house/condo value in 2022: $180,579
39475:
$180,579
Mississippi:
$162,500
According to our research of Mississippi and other state lists, there were 14 registered sex offenders living in 39475 zip code as of April 16, 2024. The ratio of all residents to sex offenders in zip code 39475 is 901 to 1. The ratio of registered sex offenders to all residents in this zip code is much lower than the state average.
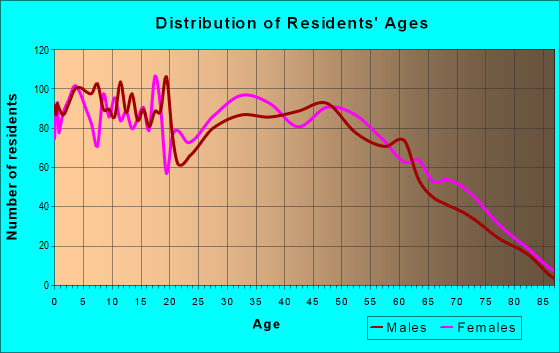
Median resident age:
This zip code:
37.8 years
Mississippi median age:
38.9 years
Average household size:
This zip code:
2.6 people
Mississippi:
2.5 people
Averages for the 2020 tax year for zip code 39475, filed in 2021:
Average Adjusted Gross Income (AGI) in 2020: $59,016 (Individual Income Tax Returns)
Here:
$59,016
State:
$54,084
Salary/wage: $49,844 (reported on 83.4% of returns)
Here:
$49,844
State:
$45,187
(% of AGI for various income ranges: 1213.7% for AGIs below $25k, 3710.4% for AGIs $25k-50k, 6799.8% for AGIs $50k-75k, 9422.8% for AGIs $75k-100k, 16883.3% for AGIs $100k-200k, 48892.0% for AGIs over 200k)
Taxable interest for individuals: $1,536 (reported on 20.9% of returns)
This zip code:
$1,536
Mississippi:
$1,434
(% of AGI for various income ranges: 7.5% for AGIs below $25k, 14.3% for AGIs $25k-50k, 25.2% for AGIs $50k-75k, 40.0% for AGIs $75k-100k, 100.5% for AGIs $100k-200k, 1604.0% for AGIs over 200k)
Ordinary dividends: $4,269 (reported on 11.3% of returns)
Here:
$4,269
State:
$6,661
(% of AGI for various income ranges: 12.3% for AGIs below $25k, 17.6% for AGIs $25k-50k, 29.1% for AGIs $50k-75k, 73.3% for AGIs $75k-100k, 155.2% for AGIs $100k-200k, 2458.0% for AGIs over 200k)
Net capital gain/loss in AGI: +$20,754 (reported on 10.1% of returns)
Here:
+$20,754
State:
+$16,833
(% of AGI for various income ranges: 4.8% for AGIs below $25k, 22.0% for AGIs $25k-50k, 56.1% for AGIs $50k-75k, 98.5% for AGIs $75k-100k, 526.7% for AGIs $100k-200k, 17120.0% for AGIs over 200k)
Profit/loss from business: +$8,619 (reported on 18.4% of returns)
Here:
+$8,619
State:
+$7,724
(% of AGI for various income ranges: 96.9% for AGIs below $25k, 183.3% for AGIs $25k-50k, 190.3% for AGIs $50k-75k, 277.7% for AGIs $75k-100k, 492.4% for AGIs $100k-200k, 2232.0% for AGIs over 200k)
Taxable individual retirement arrangement distribution: $19,032 (reported on 6.7% of returns)
39475:
$19,032
Mississippi:
$17,717
(% of AGI for various income ranges: 36.4% for AGIs below $25k, 84.0% for AGIs $25k-50k, 124.4% for AGIs $50k-75k, 404.6% for AGIs $75k-100k, 806.0% for AGIs $100k-200k)
Total itemized deductions: $35,260 (reported on 5.3% of returns)
Here:
$35,260
State:
$34,027
(% of AGI for various income ranges: 93.5% for AGIs $25k-50k, 185.5% for AGIs $50k-75k, 261.8% for AGIs $75k-100k, 766.2% for AGIs $100k-200k, 8248.0% for AGIs over 200k)
Charity contributions: $14,812 (reported on 4.2% of returns)
Here:
$14,812
State:
$14,997
(% of AGI for various income ranges: 11.6% for AGIs $25k-50k, 30.6% for AGIs $50k-75k, 94.1% for AGIs $75k-100k, 321.2% for AGIs $100k-200k, 3030.0% for AGIs over 200k)
Taxes paid: $6,290 (reported on 5.3% of returns)
39475:
$6,290
State:
$6,353
(% of AGI for various income ranges: 10.7% for AGIs $25k-50k, 31.9% for AGIs $50k-75k, 45.9% for AGIs $75k-100k, 178.6% for AGIs $100k-200k, 1272.0% for AGIs over 200k)
Earned income credit: $2,528 (reported on 22.1% of returns)
Here:
$2,528
State:
$2,689
(% of AGI for various income ranges: 127.7% for AGIs below $25k, 112.0% for AGIs $25k-50k)
Percentage of individuals using paid preparers for their 2020 taxes: 94.0%
Here:
94%
State:
94%
(% for various income ranges: 93.4% for AGIs below $25k, 95.0% for AGIs $25k-50k, 93.2% for AGIs $50k-75k, 96.4% for AGIs $75k-100k, 93.0% for AGIs $100k-200k, 92.9% for AGIs over 200k)
Averages for the 2012 tax year for zip code 39475, filed in 2013:
Average Adjusted Gross Income (AGI) in 2012: $51,462 (Individual Income Tax Returns)
Here:
$51,462
State:
$46,197
Salary/wage: $44,777 (reported on 87.3% of returns)
Here:
$44,777
State:
$38,549
(% of AGI for various income ranges: 79.6% for AGIs below $25k, 83.2% for AGIs $25k-50k, 82.5% for AGIs $50k-75k, 81.4% for AGIs $75k-100k, 81.3% for AGIs $100k-200k, 45.9% for AGIs over 200k)
Taxable interest for individuals: $1,259 (reported on 23.6% of returns)
This zip code:
$1,259
Mississippi:
$1,482
(% of AGI for various income ranges: 0.9% for AGIs below $25k, 0.6% for AGIs $25k-50k, 0.4% for AGIs $50k-75k, 0.6% for AGIs $75k-100k, 0.4% for AGIs $100k-200k, 0.8% for AGIs over 200k)
Ordinary dividends: $3,442 (reported on 11.9% of returns)
Here:
$3,442
State:
$5,401
(% of AGI for various income ranges: 0.8% for AGIs below $25k, 0.4% for AGIs $25k-50k, 0.2% for AGIs $50k-75k, 0.5% for AGIs $75k-100k, 0.8% for AGIs $100k-200k, 2.0% for AGIs over 200k)
Net capital gain/loss in AGI: +$12,935 (reported on 9.1% of returns)
Here:
+$12,935
State:
+$12,121
(% of AGI for various income ranges: 0.3% for AGIs $25k-50k, 0.7% for AGIs $50k-75k, 0.5% for AGIs $75k-100k, 1.5% for AGIs $100k-200k, 10.6% for AGIs over 200k)
Profit/loss from business: +$11,761 (reported on 17.6% of returns)
Here:
+$11,761
State:
+$10,220
(% of AGI for various income ranges: 10.0% for AGIs below $25k, 3.3% for AGIs $25k-50k, 3.3% for AGIs $50k-75k, 2.3% for AGIs $75k-100k, 1.2% for AGIs $100k-200k, 7.6% for AGIs over 200k)
Taxable individual retirement arrangement distribution: $13,924 (reported on 6.7% of returns)
39475:
$13,924
Mississippi:
$13,665
(% of AGI for various income ranges: 2.3% for AGIs below $25k, 1.8% for AGIs $25k-50k, 1.4% for AGIs $50k-75k, 2.6% for AGIs $75k-100k, 2.7% for AGIs $100k-200k)
Total itemized deductions: $20,993 (21% of AGI, reported on 27.3% of returns)
Here:
$20,993
State:
$22,078
Here:
20.6% of AGI
State:
21.8% of AGI
(% of AGI for various income ranges: 5.8% for AGIs below $25k, 9.3% for AGIs $25k-50k, 10.7% for AGIs $50k-75k, 13.1% for AGIs $75k-100k, 13.3% for AGIs $100k-200k, 11.9% for AGIs over 200k)
Charity contributions: $5,876 (reported on 21.8% of returns)
Here:
$5,876
State:
$6,081
(% of AGI for various income ranges: 0.8% for AGIs below $25k, 1.6% for AGIs $25k-50k, 1.9% for AGIs $50k-75k, 2.6% for AGIs $75k-100k, 3.1% for AGIs $100k-200k, 4.1% for AGIs over 200k)
Taxes paid: $5,777 (reported on 27.1% of returns)
39475:
$5,777
State:
$5,794
(% of AGI for various income ranges: 0.8% for AGIs below $25k, 1.5% for AGIs $25k-50k, 2.2% for AGIs $50k-75k, 3.2% for AGIs $75k-100k, 4.9% for AGIs $100k-200k, 4.3% for AGIs over 200k)
Earned income credit: $2,437 (reported on 25.5% of returns)
Here:
$2,437
State:
$2,710
(% of AGI for various income ranges: 9.4% for AGIs below $25k, 1.7% for AGIs $25k-50k)
Percentage of individuals using paid preparers for their 2012 taxes: 58.8%
Here:
59%
State:
60%
(% for various income ranges: 54.5% for AGIs below $25k, 59.0% for AGIs $25k-50k, 58.4% for AGIs $50k-75k, 60.0% for AGIs $75k-100k, 70.5% for AGIs $100k-200k, 90.0% for AGIs over 200k)
Averages for the 2004 tax year for zip code 39475, filed in 2005:
Average Adjusted Gross Income (AGI) in 2004: $38,540 (Individual Income Tax Returns)
Here:
$38,540
State:
$36,110
Salary/wage: $34,337 (reported on 87.8% of returns)
Here:
$34,337
State:
$31,757
(% of AGI for various income ranges: 136.5% for AGIs below $10k, 80.1% for AGIs $10k-25k, 85.4% for AGIs $25k-50k, 86.2% for AGIs $50k-75k, 82.2% for AGIs $75k-100k, 55.4% for AGIs over 100k)
Taxable interest for individuals: $1,305 (reported on 30.1% of returns)
This zip code:
$1,305
Mississippi:
$1,649
(% of AGI for various income ranges: 4.8% for AGIs below $10k, 1.5% for AGIs $10k-25k, 1.1% for AGIs $25k-50k, 0.6% for AGIs $50k-75k, 0.7% for AGIs $75k-100k, 1.0% for AGIs over 100k)
Taxable dividends: $2,302 (reported on 13.7% of returns)
Here:
$2,302
State:
$3,089
(% of AGI for various income ranges: 3.2% for AGIs below $10k, 0.4% for AGIs $10k-25k, 0.4% for AGIs $25k-50k, 0.2% for AGIs $50k-75k, 0.4% for AGIs $75k-100k, 2.1% for AGIs over 100k)
Net capital gain/loss: +$9,734 (reported on 10.8% of returns)
Here:
+$9,734
State:
+$8,427
(% of AGI for various income ranges: -1.9% for AGIs below $10k, 0.5% for AGIs $10k-25k, 0.5% for AGIs $25k-50k, 0.4% for AGIs $50k-75k, 1.3% for AGIs $75k-100k, 9.6% for AGIs over 100k)
Profit/loss from business: +$8,981 (reported on 16.8% of returns)
Here:
+$8,981
State:
+$8,818
(% of AGI for various income ranges: 17.5% for AGIs below $10k, 7.4% for AGIs $10k-25k, 2.9% for AGIs $25k-50k, 1.2% for AGIs $50k-75k, 2.9% for AGIs $75k-100k, 5.6% for AGIs over 100k)
IRA payment deduction: $2,864 (reported on 2.6% of returns)
39475:
$2,864
Mississippi:
$3,024
(% of AGI for various income ranges: 0.3% for AGIs $10k-25k, 0.3% for AGIs $25k-50k, 0.2% for AGIs $50k-75k, 0.1% for AGIs $75k-100k, 0.2% for AGIs over 100k)
Total itemized deductions: $17,538 (22% of AGI, reported on 24.5% of returns)
Here:
$17,538
State:
$17,896
Here:
21.8% of AGI
State:
22.5% of AGI
(% of AGI for various income ranges: 4.9% for AGIs below $10k, 5.0% for AGIs $10k-25k, 9.1% for AGIs $25k-50k, 12.5% for AGIs $50k-75k, 14.2% for AGIs $75k-100k, 13.6% for AGIs over 100k)
Charity contributions deductions: $4,778 (6% of AGI, reported on 20.7% of returns)
Here:
$4,778
State:
$4,735
Here:
5.6% of AGI
State:
5.7% of AGI
(% of AGI for various income ranges: 0.5% for AGIs below $10k, 0.9% for AGIs $10k-25k, 1.5% for AGIs $25k-50k, 2.4% for AGIs $50k-75k, 3.1% for AGIs $75k-100k, 4.4% for AGIs over 100k)
Total tax: $5,155 (reported on 72.0% of returns)
39475:
$5,155
State:
$5,562
(% of AGI for various income ranges: 4.3% for AGIs below $10k, 3.9% for AGIs $10k-25k, 5.7% for AGIs $25k-50k, 7.9% for AGIs $50k-75k, 10.2% for AGIs $75k-100k, 18.3% for AGIs over 100k)
Earned income credit: $1,901 (reported on 24.1% of returns)
Here:
$1,901
State:
$2,107
Percentage of individuals using paid preparers for their 2004 taxes: 63.5%
Here:
63%
State:
65%
(% for various income ranges: 59.2% for AGIs below $10k, 63.2% for AGIs $10k-25k, 66.4% for AGIs $25k-50k, 62.1% for AGIs $50k-75k, 62.5% for AGIs $75k-100k, 73.5% for AGIs over 100k)
Likely homosexual households (counted as self-reported same-sex unmarried-partner households)
Lesbian couples: 0.1% of all households
Gay men: 0.0% of all households
Household received Food Stamps/SNAP in the past 12 months: 372 Household did not receive Food Stamps/SNAP in the past 12 months: 5,147
Women who had a birth in the past 12 months: 182 (156 now married, 28 unmarried) Women who did not have a birth in the past 12 months: 3,445 (2,066 now married, 1,370 unmarried)
Housing units in zip code 39475 with a mortgage: 2,421 (321 second mortgage, 284 both second mortgage and home equity loan) Houses without a mortgage: 17
Median monthly owner costs for units with a mortgage: $1,293 Median monthly owner costs for units without a mortgage: $359
Residents with income below the poverty level in 2022:
This zip code:
13.6%
Whole state:
19.1%
Residents with income below 50% of the poverty level in 2022:
This zip code:
9.2%
Whole state:
10.3%
Median number of rooms in houses and condos:
Here:
5.9
State:
6.3
Median number of rooms in apartments:
Here:
4.7
State:
4.8
Notable locations in this zip code not listed on our city pages
Notable locations in zip code 39475: Lamar County Industrial Park (A), Forrest County Home (B), Tatums Camps (C), Black Creek Refinery (D), Pine Creek Golf Club (E), Purvis Fire Department (F), Southwest Lamar Volunteer Fire Department Station 2 (G), Pine Ridge Volunteer Fire Department (H), Purvis Fire Department Administration (I), Lamar County Sheriff's Department (J), Purvis Police Department (K), Lamar County Emergency (L), Purvis City Hall (M). Display/hide their locations on the map
Churches in zip code 39475 include: Pleasant Home Church (A), Burnt Bridge Church (B), Whites Chapel (C), Central Church (D), Ephesus Church (E), First Baptist Church (F), Good Hope Baptist Church (G), Okahola Baptist Church (H), Pine Grove Baptist Church (I). Display/hide their locations on the map
Cemeteries: Simmons Cemetery (1), Coal Town Cemetery (2), Entrekin Cemetery (3), Fillingame Cemetery (4), Lee Cemetery (5), Cameron Cemetery (6), Slade Cemetery (7). Display/hide their locations on the map
Streams, rivers, and creeks: Black Tom Creek (A), Beaver Pond Branch (B), Allens Reed Brake (C), Camerons Reed Brake (D), Alec Prong (E), Trace Branch (F), Tan Trough Creek (G), Sweatmans Creek (H), Spring Creek (I). Display/hide their locations on the map
In group quarters: 92 (-1 institutionalized population)
Size of family households: 1,619 2-persons, 1,031 3-persons, 622 4-persons, 454 5-persons, 216 6-persons, 106 7-or-more-persons
Size of nonfamily households: 1,140 1-person, 161 2-persons, 121 3-persons
2,972 married couples with children.
515 single-parent households (94 men, 421 women).
97.0% of residents of 39475 zip code speak English at home.
1.8% of residents speak Spanish at home (95% very well, 3% well, 2% not well).
0.2% of residents speak other Indo-European language at home (69% very well, 31% well).
0.8% of residents speak Asian or Pacific Island language at home (81% very well, 19% well).
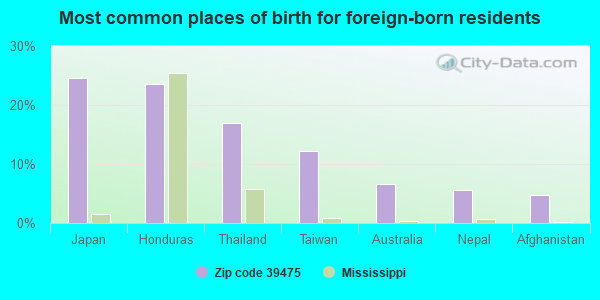
Foreign born population: 94 (0.7%) (88.3% of them are naturalized citizens)
This zip code:
0.7%
Whole state:
2.2%
25%Japan
24%Honduras
17%Thailand
12%Taiwan
7%Australia
6%Nepal
5%Afghanistan
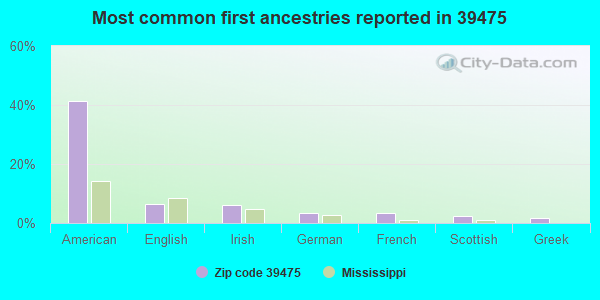
41%American
6%English
6%Irish
3%German
3%French
2%Scottish
2%Greek
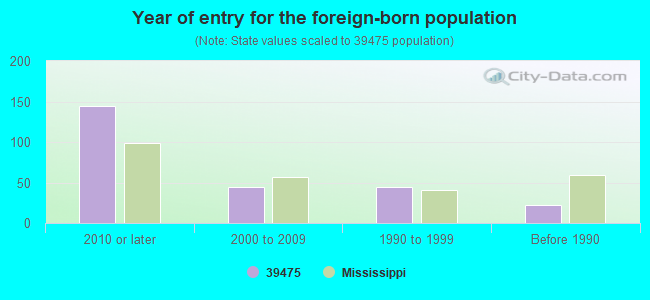
Year of entry for the foreign-born population
1442010 or later
452000 to 2009
451990 to 1999
22Before 1990
Facilities with environmental interests located in this zip code:
CII CARBON PURVIS FACILITY (BOX 349, HWY 11 NORTH in PURVIS, MS)
(Integrated Compliance Information System) - ICIS-HQ-2004-7001, ENFORCEMENT/COMPLIANCE ACTIVITY FORMAL ENFORCEMENT ACTION (Integrated Compliance Information System) - ICIS-HQ-2004-7001, ENFORCEMENT/COMPLIANCE ACTIVITY
CII CARBON LLC (863 OLD RICHBURG ROAD in PURVIS, MS)
AIR MAJOR (AIRS/AFS) STATE MASTER (Mississippi compliance, permits, activity tracking ) - ENSITE-144000006, AIR MAJOR, ENSITE-07300006, AIR PROGRAM, ENSITE-MS0001601, National Pollutant Discharge Elimination System Permit CRITERIA AND HAZARDOUS AIR POLLUTANT INVENTORY (Inventory of air pollution sources) National Pollutant Discharge Elimination System NON-MAJOR (Tracking pollutant discharge elimination systems) - permit Business SIC classification: PRODUCTS OF PETROLEUM AND COAL Business NAICS classification: ALL OTHER PETROLEUM AND COAL PRODUCTS MANUFACTURING.
FRANCES RAYBURN, POULTRY (393 HAROLD TUCKER ROAD in PURVIS, MS)
STATE MASTER (Mississippi compliance, permits, activity tracking ) - ENSITE-MSU030010, WASTEWATER FACILITY National Pollutant Discharge Elimination System NON-MAJOR (Tracking pollutant discharge elimination systems) - permit Business SIC classification: BROILER, FRYER, AND ROASTER CHICKENS Alternative names: FORREST
MMC MATERIALS INC, PURVIS 30702 (BROWN STREET in PURVIS, MS)
STATE MASTER (Mississippi compliance, permits, activity tracking ) - ENSITE-MSG110029, NPDES STORMWATER PERMIT National Pollutant Discharge Elimination System NON-MAJOR (Tracking pollutant discharge elimination systems) - permit Business SIC classification: READY-MIXED CONCRETE Alternative names: LAMAR COUNTY, MISSISSIPPI MATERIALS COMPANY
WOODS DEVELOPMENT CORPORATION, THE WOODS SUBDIVISION, PHASE TWO (108 BAYBERRY LOOP SOUTH in PURVIS, MS)
STATE MASTER (Mississippi compliance, permits, activity tracking ) - ENSITE-MS0053511, National Pollutant Discharge Elimination System Permit National Pollutant Discharge Elimination System NON-MAJOR (Tracking pollutant discharge elimination systems) - permit Business SIC classification: LAND SUBDIVIDERS AND DEVELOPERS, EXCEPT CEMETERIES Alternative names: LAMAR COUNTY, WOODS DEVELOPMENT CORPORATION THE WOODS SUBDIVISION PHASE II, THE WOODS PHASE II, WOODS THE PHASE II 40 LOTS
WYATT SIMMONS, POULTRY (280 A B SIMMONS ROAD in PURVIS, MS)
STATE MASTER (Mississippi compliance, permits, activity tracking ) - ENSITE-03500098, AIR PROGRAM, ENSITE-MSG150016, LIVE STOCK WASTE CONTROL National Pollutant Discharge Elimination System NON-MAJOR (Tracking pollutant discharge elimination systems) - permit Business SIC classification: BROILER, FRYER, AND ROASTER CHICKENS Alternative names: FORREST
JEFFERSON-TODD EDUCATIONAL CENTER (MARTIN LUTHER KING DRIVE in PURVIS, MS)
(National Center for Education Statistics) - STATE ID-3700020 Organizations: LAMAR COUNTY SCHOOL DISTRICT (SCHOOL DISTRICT)
JEFFERSON/TODD ALTERNATIVE PROGRAM (MARTIN LUTHER KING DRIVE in PURVIS, MS)
(National Center for Education Statistics) - STATE ID-3700092 Organizations: LAMAR COUNTY SCHOOL DISTRICT (SCHOOL DISTRICT)
AMOCO PRODUCTION CO (QUITMAN BAYOU FIELD in PINE RIDGE, MS)
(Integrated Compliance Information System) - ICIS-04-1988-0089, FORMAL ENFORCEMENT ACTION
WETLANDS (SECTION 26, TOWNSHIP 2N, RANGE 13W. JC BURT RD in PURVIS, MS)
(Integrated Compliance Information System) - ICIS-04-1999-0560, FORMAL ENFORCEMENT ACTION, ICIS-04-1999-0300,
BIG BAY LAKE DAM COLLAPSE (RURAL LAMAR COUNTY in PURVIS, MS)
SUPERFUND (Superfund database)
Housing units lacking complete plumbing facilities: 1.0% Housing units lacking complete kitchen facilities: 2.6%
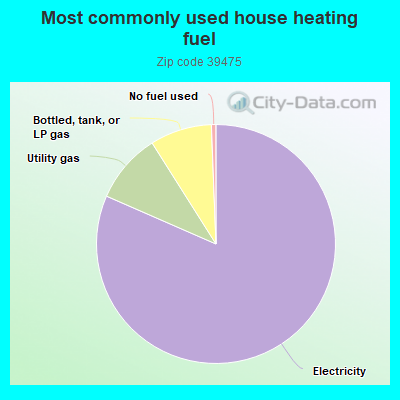
81.0%Electricity
9.4%Utility gas
8.3%Bottled, tank, or LP gas
0.6%No fuel used
Population in 1990: 4,493. Population change in the 1990s: +5,046 (+112.3%).
Place of birth for U.S.-born residents:
This state: 10,433
Northeast: 126
Midwest: 349
South: 2,703
West: 358
57% of the 39475 zip code residents lived in the same house 5 years ago. Out of people who lived in different houses, 41% lived in this county. Out of people who lived in different counties, 50% lived in Mississippi.
91% of the 39475 zip code residents lived in the same house 1 year ago. Out of people who lived in different houses, 37% moved from this county. Out of people who lived in different houses, 23% moved from different county within same state. Out of people who lived in different houses, 40% moved from different state. Out of people who lived in different houses, 1% moved from abroad.
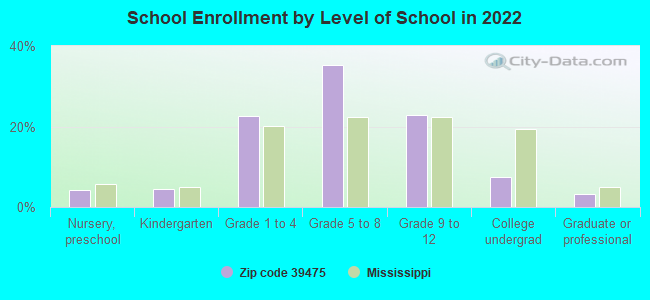
Private vs. public school enrollment:
Students in private schools in grades 1 to 8 (elementary and middle school): 571
Here:
28.4%
Mississippi:
16.1%
Students in private schools in grades 9 to 12 (high school): 31
Here:
4.1%
Mississippi:
14.6%
Students in private undergraduate colleges: 32
Here:
12.7%
Mississippi:
12.8%
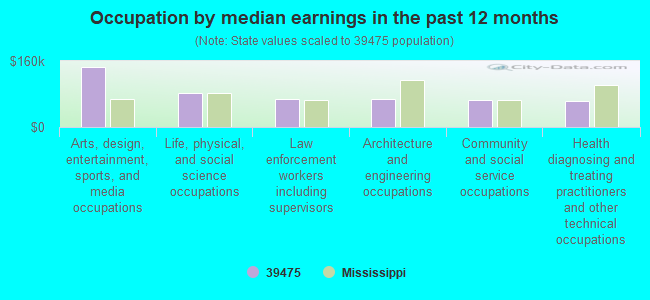
Occupation by median earnings in the past 12 months ($)
145,588Arts, design, entertainment, sports, and media occupations
83,248Life, physical, and social science occupations
69,014Law enforcement workers including supervisors
68,418Architecture and engineering occupations
66,525Community and social service occupations
63,771Health diagnosing and treating practitioners and other technical occupations
Companies with federal contracts located in this zip code:
VECTOR MACHINE AND MANUFACTURI (111 BATES AVE in PURVIS, MS; small business)
$23,280 with Defense Logistics Agency for Surgical Dressing Materials. Signed on 2004-11-02. Completion date: 2004-11-20.
First baptist church of purvis, mi (PO BOX 246 in PURVIS, MS; small business)
$15,600 with Public Buildings Service for Lease or Rental of Facilities -- Office Buildings. Signed on 2005-10-08. Completion date: 2006-09-30.
HAGENSON FORESTRY CONSULTANTS (641 LOOKOUT TOWER RD in PURVIS, MS; small business)
$3,376 with Army for Personal Services Contracts. Signed on 2002-09-23. Completion date: 2002-11-07.
Top industries in this zip code by the number of employees in 2005:
Construction: Commercial and Institutional Building Construction (50-99 employees: 1 establishment, 10-19 employees: 2 establishments, 5-9 employees: 2 establishments, 1-4 employees: 1 establishment)
2002 - 2018 National Fire Incident Reporting System (NFIRS) incidents
Based on the data from the years 2002 - 2018 the average number of fires per year is 175. The highest number of fire incidents - 309 took place in 2006, and the least - 105 in 2002. The data has a growing trend.
When looking into fire subcategories, the most incidents belonged to: Outside Fires (57.8%), and Structure Fires (30.3%).
Fire incident types reported to NFIRS in Zip Code 39475
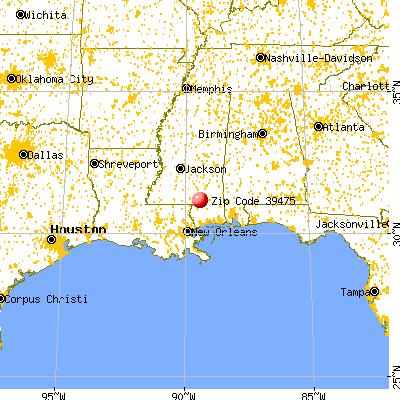


 Nearest zip codes: 39455, 39401, 39402, 39406, 39482, 39465.
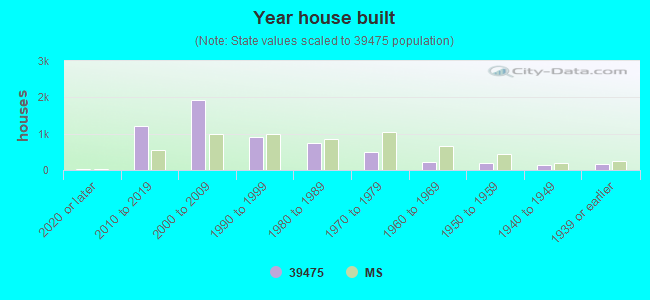


 Based on the data from the years 2002 - 2018 the average number of fires per year is 175. The highest number of fire incidents - 309 took place in 2006, and the least - 105 in 2002. The data has a growing trend.
 When looking into fire subcategories, the most incidents belonged to: Outside Fires (57.8%), and Structure Fires (30.3%).