Estimated zip code population in 2022: 12,132 Zip code population in 2010: 12,355 Zip code population in 2000: 11,779
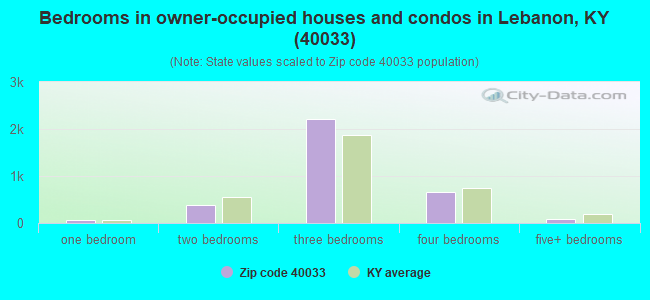
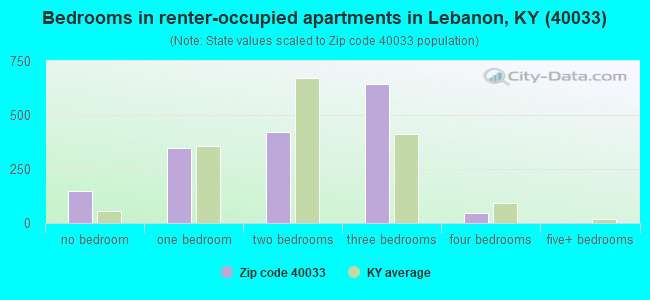
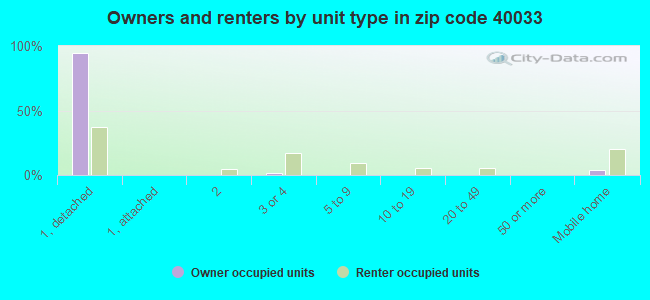
Houses and condos: 5,292 Renter-occupied apartments: 1,639
% of renters here:
33%
State:
31%
March 2022 cost of living index in zip code 40033: 82.1 (low, U.S. average is 100)
Land area: 143.4 sq. mi. Water area: 1.7 sq. mi.
Population density: 85 people per square mile
(very low).
OSM Map
General Map
Google Map
MSN Map
OSM Map
General Map
Google Map
MSN Map
OSM Map
General Map
Google Map
MSN Map
OSM Map
General Map
Google Map
MSN Map
Please wait while loading the map...
Real estate property taxes paid for housing units in 2022:
This zip code:
0.8% ($1,234)
Kentucky:
0.7% ($1,456)
Median real estate property taxes paid for housing units with mortgages in 2022: $1,317 (0.7%) Median real estate property taxes paid for housing units with no mortgage in 2022: $1,135 (0.8%)
Business Search- 14 Million verified businesses
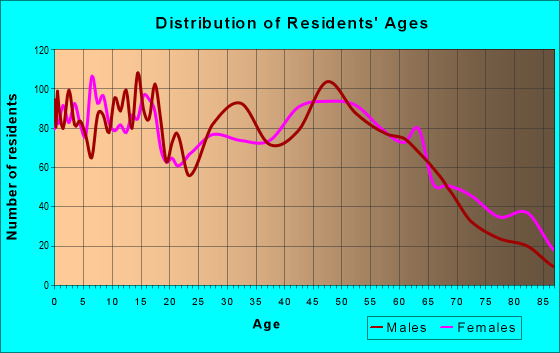
Males: 5,764
(47.5%)
Females: 6,368
(52.5%)
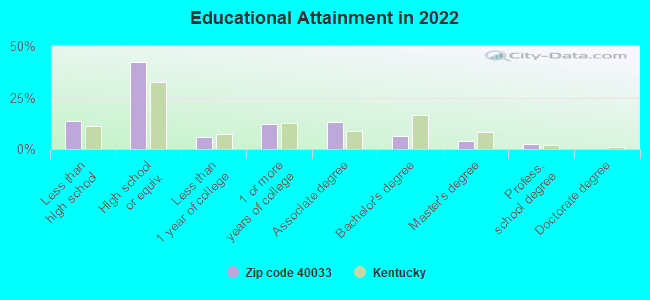
For population 25 years and over in 40033:
High school or higher: 84.7%
Bachelor's degree or higher: 12.5%
Graduate or professional degree: 6.2%
Unemployed: 6.1%
Mean travel time to work (commute): 17.6 minutes
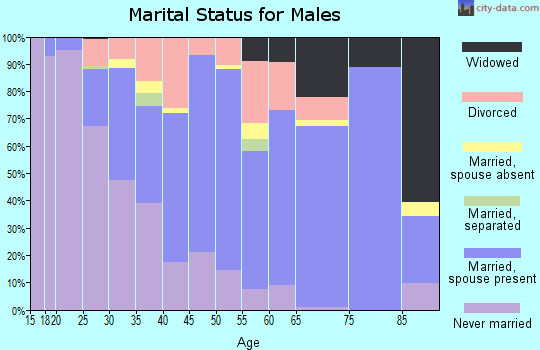
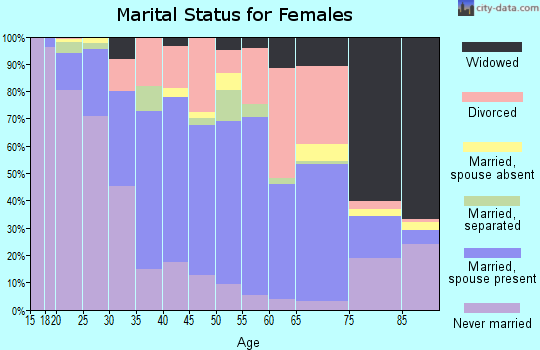
For population 15 years and over in 40033:
Never married: 30.3%
Now married: 45.7%
Separated: 1.1%
Widowed: 6.2%
Divorced: 16.6%
Zip code 40033 compared to state average:
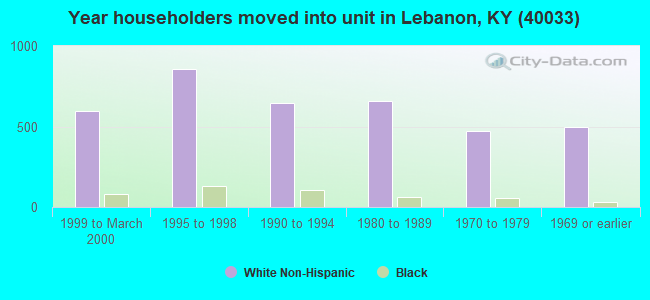
Length of stay since moving in significantly above state average.
Percentage of population with a bachelor's degree or higher significantly below state average.
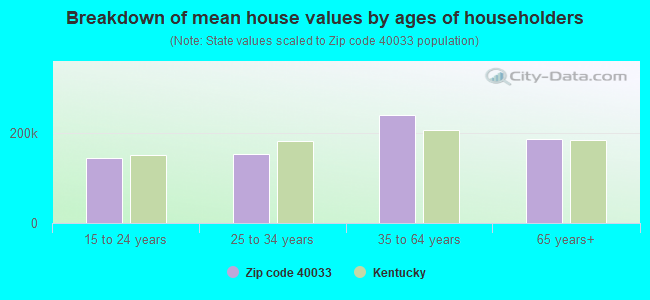
Estimated median house/condo value in 2022: $161,698
40033:
$161,698
Kentucky:
$196,300
According to our research of Kentucky and other state lists, there were 35 registered sex offenders living in 40033 zip code as of April 24, 2024. The ratio of all residents to sex offenders in zip code 40033 is 376 to 1. The ratio of registered sex offenders to all residents in this zip code is near the state average.
Median resident age:
This zip code:
38.1 years
Kentucky median age:
39.4 years
Average household size:
This zip code:
2.3 people
Kentucky:
2.4 people
Averages for the 2020 tax year for zip code 40033, filed in 2021:
Average Adjusted Gross Income (AGI) in 2020: $50,664 (Individual Income Tax Returns)
Here:
$50,664
State:
$61,342
Salary/wage: $41,138 (reported on 84.3% of returns)
Here:
$41,138
State:
$50,827
(% of AGI for various income ranges: 1156.3% for AGIs below $25k, 3406.0% for AGIs $25k-50k, 6115.6% for AGIs $50k-75k, 9297.9% for AGIs $75k-100k, 15727.6% for AGIs $100k-200k, 50280.0% for AGIs over 200k)
Taxable interest for individuals: $1,337 (reported on 24.3% of returns)
This zip code:
$1,337
Kentucky:
$1,441
(% of AGI for various income ranges: 17.3% for AGIs below $25k, 22.3% for AGIs $25k-50k, 63.1% for AGIs $50k-75k, 70.0% for AGIs $75k-100k, 134.2% for AGIs $100k-200k, 780.0% for AGIs over 200k)
Ordinary dividends: $4,808 (reported on 12.7% of returns)
Here:
$4,808
State:
$7,388
(% of AGI for various income ranges: 15.8% for AGIs below $25k, 28.4% for AGIs $25k-50k, 65.8% for AGIs $50k-75k, 118.2% for AGIs $75k-100k, 359.4% for AGIs $100k-200k, 2920.0% for AGIs over 200k)
Net capital gain/loss in AGI: +$12,110 (reported on 12.7% of returns)
Here:
+$12,110
State:
+$19,475
(% of AGI for various income ranges: 21.5% for AGIs below $25k, 42.5% for AGIs $25k-50k, 114.6% for AGIs $50k-75k, 223.6% for AGIs $75k-100k, 608.5% for AGIs $100k-200k, 14666.7% for AGIs over 200k)
Profit/loss from business: +$9,345 (reported on 13.2% of returns)
Here:
+$9,345
State:
+$11,386
(% of AGI for various income ranges: 83.3% for AGIs below $25k, 87.7% for AGIs $25k-50k, 150.5% for AGIs $50k-75k, 310.3% for AGIs $75k-100k, 656.7% for AGIs $100k-200k, 1550.0% for AGIs over 200k)
Taxable individual retirement arrangement distribution: $14,660 (reported on 7.4% of returns)
40033:
$14,660
Kentucky:
$18,941
(% of AGI for various income ranges: 33.4% for AGIs below $25k, 69.2% for AGIs $25k-50k, 181.5% for AGIs $50k-75k, 278.8% for AGIs $75k-100k, 827.9% for AGIs $100k-200k)
Total itemized deductions: $26,407 (reported on 2.6% of returns)
Here:
$26,407
State:
$32,473
(% of AGI for various income ranges: 43.2% for AGIs $25k-50k, 113.6% for AGIs $50k-75k, 152.4% for AGIs $75k-100k, 369.4% for AGIs $100k-200k, 3343.3% for AGIs over 200k)
Charity contributions: $8,927 (reported on 1.9% of returns)
Here:
$8,927
State:
$13,472
(% of AGI for various income ranges: 34.4% for AGIs $50k-75k, 89.7% for AGIs $100k-200k, 1610.0% for AGIs over 200k)
Taxes paid: $6,600 (reported on 2.6% of returns)
40033:
$6,600
State:
$7,830
(% of AGI for various income ranges: 6.9% for AGIs $25k-50k, 22.7% for AGIs $50k-75k, 50.6% for AGIs $75k-100k, 107.3% for AGIs $100k-200k, 813.3% for AGIs over 200k)
Earned income credit: $2,305 (reported on 20.6% of returns)
Here:
$2,305
State:
$2,336
(% of AGI for various income ranges: 112.5% for AGIs below $25k, 70.2% for AGIs $25k-50k)
Percentage of individuals using paid preparers for their 2020 taxes: 95.4%
Here:
95%
State:
94%
(% for various income ranges: 94.8% for AGIs below $25k, 95.7% for AGIs $25k-50k, 96.2% for AGIs $50k-75k, 95.9% for AGIs $75k-100k, 96.4% for AGIs $100k-200k, 90.0% for AGIs over 200k)
Averages for the 2012 tax year for zip code 40033, filed in 2013:
Average Adjusted Gross Income (AGI) in 2012: $40,578 (Individual Income Tax Returns)
Here:
$40,578
State:
$50,814
Salary/wage: $34,947 (reported on 86.3% of returns)
Here:
$34,947
State:
$42,723
(% of AGI for various income ranges: 79.0% for AGIs below $25k, 80.3% for AGIs $25k-50k, 77.9% for AGIs $50k-75k, 79.0% for AGIs $75k-100k, 75.2% for AGIs $100k-200k, 38.2% for AGIs over 200k)
Taxable interest for individuals: $1,633 (reported on 29.9% of returns)
This zip code:
$1,633
Kentucky:
$1,381
(% of AGI for various income ranges: 2.0% for AGIs below $25k, 1.1% for AGIs $25k-50k, 1.0% for AGIs $50k-75k, 0.8% for AGIs $75k-100k, 1.3% for AGIs $100k-200k, 1.0% for AGIs over 200k)
Ordinary dividends: $3,577 (reported on 13.7% of returns)
Here:
$3,577
State:
$6,239
(% of AGI for various income ranges: 1.5% for AGIs below $25k, 0.8% for AGIs $25k-50k, 0.5% for AGIs $50k-75k, 0.8% for AGIs $75k-100k, 1.1% for AGIs $100k-200k, 3.8% for AGIs over 200k)
Net capital gain/loss in AGI: +$5,937 (reported on 14.3% of returns)
Here:
+$5,937
State:
+$11,336
(% of AGI for various income ranges: 1.3% for AGIs below $25k, 1.0% for AGIs $25k-50k, 1.2% for AGIs $50k-75k, 2.0% for AGIs $75k-100k, 2.6% for AGIs $100k-200k, 6.7% for AGIs over 200k)
Profit/loss from business: +$10,800 (reported on 13.5% of returns)
Here:
+$10,800
State:
+$10,862
(% of AGI for various income ranges: 7.2% for AGIs below $25k, 2.6% for AGIs $25k-50k, 1.7% for AGIs $50k-75k, 2.0% for AGIs $75k-100k, 1.9% for AGIs $100k-200k, 9.8% for AGIs over 200k)
Taxable individual retirement arrangement distribution: $10,789 (reported on 6.8% of returns)
40033:
$10,789
Kentucky:
$14,296
(% of AGI for various income ranges: 1.9% for AGIs below $25k, 1.4% for AGIs $25k-50k, 1.5% for AGIs $50k-75k, 1.6% for AGIs $75k-100k, 4.0% for AGIs $100k-200k)
Total itemized deductions: $17,000 (20% of AGI, reported on 20.5% of returns)
Here:
$17,000
State:
$21,160
Here:
20.2% of AGI
State:
20.0% of AGI
(% of AGI for various income ranges: 5.3% for AGIs below $25k, 6.5% for AGIs $25k-50k, 7.4% for AGIs $50k-75k, 10.6% for AGIs $75k-100k, 11.8% for AGIs $100k-200k, 11.5% for AGIs over 200k)
Charity contributions: $2,975 (reported on 16.6% of returns)
Here:
$2,975
State:
$4,303
(% of AGI for various income ranges: 0.5% for AGIs below $25k, 0.8% for AGIs $25k-50k, 1.0% for AGIs $50k-75k, 1.1% for AGIs $75k-100k, 1.8% for AGIs $100k-200k, 2.7% for AGIs over 200k)
Taxes paid: $6,862 (reported on 20.3% of returns)
40033:
$6,862
State:
$8,496
(% of AGI for various income ranges: 0.9% for AGIs below $25k, 1.7% for AGIs $25k-50k, 2.4% for AGIs $50k-75k, 4.5% for AGIs $75k-100k, 5.8% for AGIs $100k-200k, 7.1% for AGIs over 200k)
Earned income credit: $2,377 (reported on 25.0% of returns)
Here:
$2,377
State:
$2,273
(% of AGI for various income ranges: 8.3% for AGIs below $25k, 1.3% for AGIs $25k-50k)
Percentage of individuals using paid preparers for their 2012 taxes: 74.0%
Here:
74%
State:
60%
(% for various income ranges: 70.3% for AGIs below $25k, 75.9% for AGIs $25k-50k, 78.5% for AGIs $50k-75k, 77.5% for AGIs $75k-100k, 78.6% for AGIs $100k-200k, 83.3% for AGIs over 200k)
Averages for the 2004 tax year for zip code 40033, filed in 2005:
Average Adjusted Gross Income (AGI) in 2004: $35,517 (Individual Income Tax Returns)
Here:
$35,517
State:
$41,540
Salary/wage: $31,188 (reported on 86.4% of returns)
Here:
$31,188
State:
$36,432
(% of AGI for various income ranges: 109.0% for AGIs below $10k, 80.0% for AGIs $10k-25k, 86.1% for AGIs $25k-50k, 83.3% for AGIs $50k-75k, 83.2% for AGIs $75k-100k, 47.1% for AGIs over 100k)
Taxable interest for individuals: $1,908 (reported on 41.2% of returns)
This zip code:
$1,908
Kentucky:
$1,571
(% of AGI for various income ranges: 9.6% for AGIs below $10k, 3.7% for AGIs $10k-25k, 1.7% for AGIs $25k-50k, 1.4% for AGIs $50k-75k, 1.4% for AGIs $75k-100k, 2.3% for AGIs over 100k)
Taxable dividends: $2,192 (reported on 17.2% of returns)
Here:
$2,192
State:
$3,453
(% of AGI for various income ranges: 2.2% for AGIs below $10k, 0.7% for AGIs $10k-25k, 0.5% for AGIs $25k-50k, 0.7% for AGIs $50k-75k, 0.6% for AGIs $75k-100k, 2.4% for AGIs over 100k)
Net capital gain/loss: +$7,361 (reported on 17.2% of returns)
Here:
+$7,361
State:
+$9,663
(% of AGI for various income ranges: 5.8% for AGIs below $10k, 0.9% for AGIs $10k-25k, 0.8% for AGIs $25k-50k, 2.4% for AGIs $50k-75k, 2.8% for AGIs $75k-100k, 9.5% for AGIs over 100k)
Profit/loss from business: +$9,676 (reported on 13.6% of returns)
Here:
+$9,676
State:
+$9,233
(% of AGI for various income ranges: 12.3% for AGIs below $10k, 4.5% for AGIs $10k-25k, 2.3% for AGIs $25k-50k, 2.2% for AGIs $50k-75k, 1.7% for AGIs $75k-100k, 6.5% for AGIs over 100k)
IRA payment deduction: $3,726 (reported on 2.2% of returns)
40033:
$3,726
Kentucky:
$2,955
(% of AGI for various income ranges: 0.1% for AGIs $10k-25k, 0.3% for AGIs $25k-50k, 0.3% for AGIs $50k-75k, 0.3% for AGIs $75k-100k, 0.1% for AGIs over 100k)
Self-employed pension: $11,765 (reported on 0.7% of returns)
Here:
$11,765
Kentucky:
$14,996
Total itemized deductions: $14,858 (20% of AGI, reported on 23.1% of returns)
Here:
$14,858
State:
$17,474
Here:
19.5% of AGI
State:
21.0% of AGI
(% of AGI for various income ranges: 10.4% for AGIs below $10k, 6.0% for AGIs $10k-25k, 7.8% for AGIs $25k-50k, 10.1% for AGIs $50k-75k, 13.4% for AGIs $75k-100k, 11.3% for AGIs over 100k)
Charity contributions deductions: $2,825 (4% of AGI, reported on 19.4% of returns)
Here:
$2,825
State:
$3,494
Here:
3.6% of AGI
State:
4.0% of AGI
(% of AGI for various income ranges: 0.5% for AGIs below $10k, 0.7% for AGIs $10k-25k, 0.8% for AGIs $25k-50k, 1.5% for AGIs $50k-75k, 1.9% for AGIs $75k-100k, 2.8% for AGIs over 100k)
Total tax: $4,755 (reported on 70.6% of returns)
40033:
$4,755
State:
$6,162
(% of AGI for various income ranges: 2.9% for AGIs below $10k, 3.8% for AGIs $10k-25k, 6.1% for AGIs $25k-50k, 8.0% for AGIs $50k-75k, 9.7% for AGIs $75k-100k, 18.4% for AGIs over 100k)
Earned income credit: $1,642 (reported on 21.9% of returns)
Here:
$1,642
State:
$1,723
Percentage of individuals using paid preparers for their 2004 taxes: 78.0%
Here:
78%
State:
66%
(% for various income ranges: 73.9% for AGIs below $10k, 80.2% for AGIs $10k-25k, 78.1% for AGIs $25k-50k, 78.0% for AGIs $50k-75k, 79.9% for AGIs $75k-100k, 83.8% for AGIs over 100k)
Household received Food Stamps/SNAP in the past 12 months: 1,134 Household did not receive Food Stamps/SNAP in the past 12 months: 3,916
Women who had a birth in the past 12 months: 135 (28 now married, 110 unmarried) Women who did not have a birth in the past 12 months: 2,734 (1,217 now married, 1,516 unmarried)
Housing units in zip code 40033 with a mortgage: 1,719 (123 second mortgage, 22 home equity loan, 63 both second mortgage and home equity loan) Houses without a mortgage: 35
Median monthly owner costs for units with a mortgage: $1,099 Median monthly owner costs for units without a mortgage: $429
Residents with income below the poverty level in 2022:
This zip code:
25.9%
Whole state:
16.5%
Residents with income below 50% of the poverty level in 2022:
This zip code:
17.8%
Whole state:
9.0%
Median number of rooms in houses and condos:
Here:
6.4
State:
6.4
Median number of rooms in apartments:
Here:
4.3
State:
4.4
Notable locations in this zip code not listed on our city pages
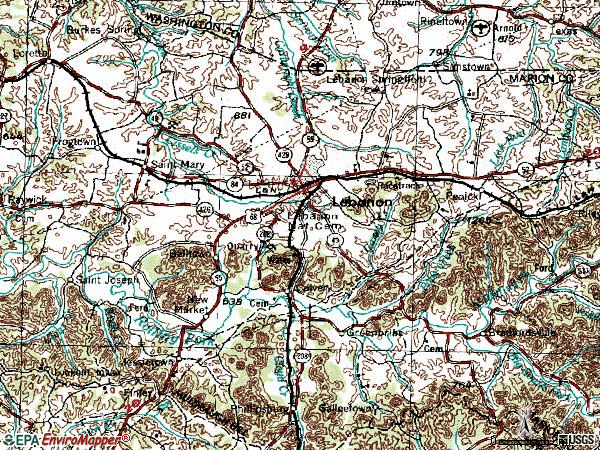
Notable locations in zip code 40033: Sugar Grove (A), Marion County Fire Department (B), Lebanon Fire Department (C), Lebanon Volunteer Fire Department (D), Cornucopia Institute (E), Marion County Emergency Medical Services (F). Display/hide their locations on the map
Churches in zip code 40033 include: Mays Chapel (A), Mission Church (B), Muldraugh Hill Church (C), Pleasant Run Church (D), Stewarts Creek Church (E), Bells Chapel (F), Bethel Union Church (G), Saint Ivos Church (H), Tucker Hill Church (I). Display/hide their locations on the map
Cemeteries: Lebanon National Cemetery (1), Holy Name of Mary Cemetery (2), Saint Charles Cemetery (3), Ryder Cemetery (4), Saint Agustines Cemetery (5), Saint Ivos Cemetery (6), Tatum Cemetery (7). Display/hide their locations on the map
Streams, rivers, and creeks: Milk and Mush Creek (A), Arbuckle Creek (B), Big South Fork (C), Brewster Branch (D), Cissels Creek (E), Caney Creek (F), Cabin Branch (G), Stewarts Creek (H), Buckhorn Creek (I). Display/hide their locations on the map
In group quarters: 380 (-1 institutionalized population)
Size of family households: 1,420 2-persons, 691 3-persons, 477 4-persons, 227 5-persons, 15 6-persons, 139 7-or-more-persons
Size of nonfamily households: 1,894 1-person, 171 2-persons, 13 3-persons
1,747 married couples with children.
993 single-parent households (221 men, 772 women).
95.8% of residents of 40033 zip code speak English at home.
3.1% of residents speak Spanish at home (62% very well, 1% well, 14% not well, 22% not at all).
0.6% of residents speak other Indo-European language at home (73% very well, 27% not well).
0.5% of residents speak Asian or Pacific Island language at home (54% very well, 46% well).
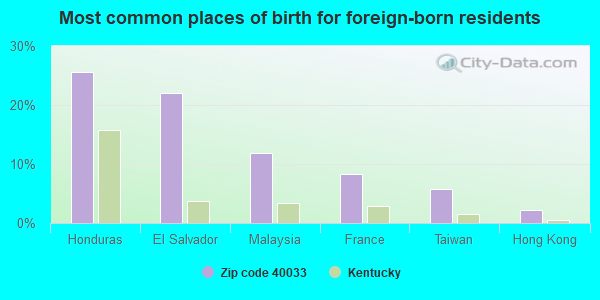
Foreign born population: 349 (2.9%) (40.7% of them are naturalized citizens)
This zip code:
2.9%
Whole state:
4.0%
26%Honduras
22%El Salvador
12%Malaysia
8%France
6%Taiwan
2%Hong Kong
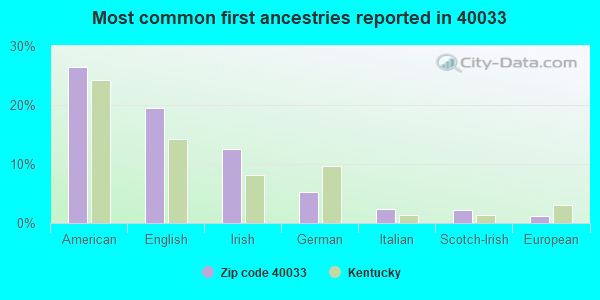
26%American
19%English
13%Irish
5%German
2%Italian
2%Scotch-Irish
1%European
Year of entry for the foreign-born population
1942010 or later
1952000 to 2009
101990 to 1999
53Before 1990
Major facilities with environmental interests located in this zip code:
AIR MINOR (AIRS/AFS) CRITERIA AND HAZARDOUS AIR POLLUTANT INVENTORY (Inventory of air pollution sources) National Pollutant Discharge Elimination System NON-MAJOR (Tracking pollutant discharge elimination systems) - permit TRI REPORTER (Tracking of toxic chemicals releasing facilities) Business SIC classification: CRUSHED AND BROKEN LIMESTONE; ASPHALT PAVING MIXTURES AND BLOCKS Business NAICS classification: CRUSHED AND BROKEN LIMESTONE MINING AND QUARRYING.; ASPHALT PAVING MIXTURE AND BLOCK MANUFACTURING. Organizations: NALLY & HAYDON SURFACING INC (CONTACT/OWNER)
Alternative names: NALLY & HAYDEN SURFACING, NALLY & HAYDON SURFACING INC
ANGELL MANUFACTURING CO (810 WEST MAIN ST in LEBANON, KY)
COMPLIANCE ACTIVITY (Tracking inspections of insecticide, fungicide, and rodenticide, and toxic substances) CRITERIA AND HAZARDOUS AIR POLLUTANT INVENTORY (Inventory of air pollution sources) National Pollutant Discharge Elimination System NON-MAJOR (Tracking pollutant discharge elimination systems) - permit HAZARDOUS WASTE BIENNIAL REPORTER (Resource Conservation and Recovery Act (tracking hazardous waste)) Large Quantity Generators, more that 1000 kg of hazardous waste/month (Resource Conservation and Recovery Act (tracking hazardous waste)) - notification TRI REPORTER (Tracking of toxic chemicals releasing facilities) Business SIC classification: COMMERCIAL PRINTING; METAL STAMPINGS Business NAICS classification: OTHER COMMERCIAL PRINTING. Organizations: WILLIAM TATUM (CONTACT/OWNER)
MORTON CUSTOM PLASTICS (655 INDUSTRIAL DR. in LEBANON, KY)
CRITERIA AND HAZARDOUS AIR POLLUTANT INVENTORY (Inventory of air pollution sources) National Pollutant Discharge Elimination System NON-MAJOR (Tracking pollutant discharge elimination systems) - permit HAZARDOUS WASTE BIENNIAL REPORTER (Resource Conservation and Recovery Act (tracking hazardous waste)) (Resource Conservation and Recovery Act (tracking hazardous waste)) TRI REPORTER (Tracking of toxic chemicals releasing facilities) Business SIC classification: CUSTOM COMPOUNDING OF PURCHASED PLASTICS RESINS; PLASTICS PRODUCTS Business NAICS classification: CUSTOM COMPOUNDING OF PURCHASED RESINS. Organizations: WORTHINGTON CUSTOM PLASTICS (CONTACT/OWNER)
, MORTON INDUSTRIAL GROUP (CONTACT/OWNER)
Alternative names: WORTHINGTON CUSTOM PLASTICS
MARION COUNTY HIGH SCHOOL (735 E MAIN STREET in LEBANON, KY)
COMPLIANCE ACTIVITY (Tracking inspections of insecticide, fungicide, and rodenticide, and toxic substances) (National Center for Education Statistics) - STATE ID-075375515
LEBANON OAK FLOORING (215 TAYLOR AVENUE in LEBANON, KY)
AIR MINOR (AIRS/AFS) COMPLIANCE ACTIVITY (Tracking inspections of insecticide, fungicide, and rodenticide, and toxic substances) CRITERIA AND HAZARDOUS AIR POLLUTANT INVENTORY (Inventory of air pollution sources) National Pollutant Discharge Elimination System NON-MAJOR (Tracking pollutant discharge elimination systems) - permit Business SIC classification: HARDWOOD DIMENSION AND FLOORING MILLS Organizations: LEBANON OAK FLOORING CO (CONTACT/OWNER)
Alternative names: LEBANON OAK FLOOR CO
AMERICAN WOOD FIBERS OF KY (390 WAREHOUSE ROAD in LEBANON, KY)
AIR MINOR (AIRS/AFS) CRITERIA AND HAZARDOUS AIR POLLUTANT INVENTORY (Inventory of air pollution sources) National Pollutant Discharge Elimination System NON-MAJOR (Tracking pollutant discharge elimination systems) - permit Business SIC classification: SAWMILLS AND PLANING MILLS, GENERAL; WOOD PRODUCTS Alternative names: AMERICAN WOOD PRODUCTS
CALVARY ELEMENTARY SCHOOL (3345 HWY 208 in LEBANON, KY)
(National Center for Education Statistics) - STATE ID-075375020 Organizations: MARION COUNTY (SCHOOL DISTRICT)
LEBANON MIDDLE SCHOOL (200 CORPORATE DRIVE in LEBANON, KY)
(National Center for Education Statistics) - STATE ID-075375220 Organizations: MARION COUNTY (SCHOOL DISTRICT)
LEBANON ELEMENTARY SCHOOL (420 W MAIN ST in LEBANON, KY)
(National Center for Education Statistics) - STATE ID-075375210 Organizations: MARION COUNTY (SCHOOL DISTRICT)
MONTEBELLO PACKAGING INC (650 INDUSTRIAL DR in LEBANON, KY)
AIR SYNTHETIC MINOR (AIRS/AFS) CRITERIA AND HAZARDOUS AIR POLLUTANT INVENTORY (Inventory of air pollution sources) HAZARDOUS WASTE BIENNIAL REPORTER (Resource Conservation and Recovery Act (tracking hazardous waste)) Large Quantity Generators, more that 1000 kg of hazardous waste/month (Resource Conservation and Recovery Act (tracking hazardous waste)) Business SIC classification: FABRICATED METAL PRODUCTS Business NAICS classification: ALL OTHER MISCELLANEOUS FABRICATED METAL PRODUCT MANUFACTURING. Organizations: GREAT PACIFIC ENTERPRISES (U.S.) INC (CONTACT/OWNER)
LITTLE BOCO (WEST MULBERRY STREET in LEBANON, KY)
(Resource Conservation and Recovery Act (tracking hazardous waste)) Organizations: BALL BROTHERS OIL COMPANY, INC. (CONTACT/OWNER)
MARION COUNTY MAINTENANCE GARAGE (HIGHWAY 208 in LEBANON, KY)
(Resource Conservation and Recovery Act (tracking hazardous waste)) Organizations: MARION COUNTY FISCAL COURT (CONTACT/OWNER)
LANHAM BROS (161 LANHAM LN in LEBANON, KY)
CRITERIA AND HAZARDOUS AIR POLLUTANT INVENTORY (Inventory of air pollution sources) National Pollutant Discharge Elimination System NON-MAJOR (Tracking pollutant discharge elimination systems) - permit Business SIC classification: READY-MIXED CONCRETE
Housing units lacking complete plumbing facilities: 0.5% Housing units lacking complete kitchen facilities: 4.4%
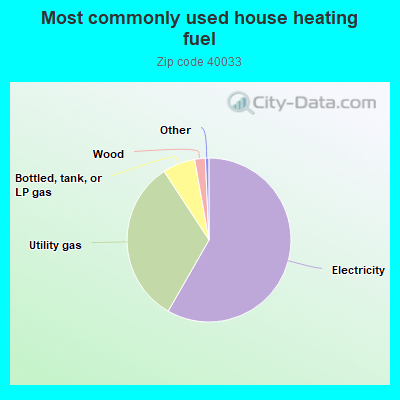
58.3%Electricity
32.5%Utility gas
6.4%Bottled, tank, or LP gas
2.1%Wood
Population in 1990: 10,672. Population change in the 1990s: +1,107 (+10.4%).
Place of birth for U.S.-born residents:
This state: 9,832
Northeast: 142
Midwest: 779
South: 393
West: 460
61% of the 40033 zip code residents lived in the same house 5 years ago. Out of people who lived in different houses, 59% lived in this county. Out of people who lived in different counties, 50% lived in Kentucky.
89% of the 40033 zip code residents lived in the same house 1 year ago. Out of people who lived in different houses, 46% moved from this county. Out of people who lived in different houses, 44% moved from different county within same state. Out of people who lived in different houses, 7% moved from different state. Out of people who lived in different houses, 2% moved from abroad.
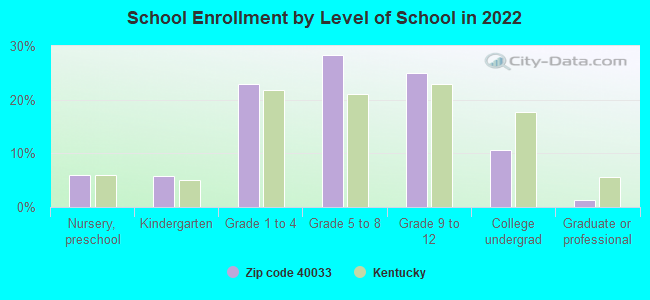
Private vs. public school enrollment:
Students in private schools in grades 1 to 8 (elementary and middle school): 179
Here:
12.3%
Kentucky:
17.2%
Students in private schools in grades 9 to 12 (high school): 55
Here:
7.8%
Kentucky:
15.2%
Students in private undergraduate colleges: 44
Here:
14.8%
Kentucky:
19.6%
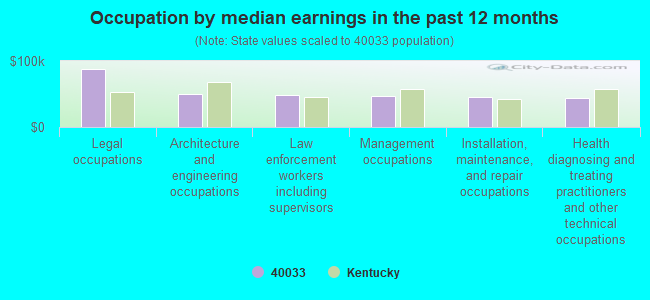
Occupation by median earnings in the past 12 months ($)
88,009Legal occupations
49,245Architecture and engineering occupations
49,104Law enforcement workers including supervisors
47,581Management occupations
45,942Installation, maintenance, and repair occupations
44,154Health diagnosing and treating practitioners and other technical occupations
Companies with federal contracts located in this zip code:
BELL, JOHN (135 MONTGOMERY CT in LEBANON, KY; small business)
$19,989 with Army for Dental Instruments, Equipment, and Supplies. Signed on 2004-09-17. Completion date: 2004-09-30.
Top industries in this zip code by the number of employees in 2005:
Administrative and Support and Waste Management and Remediation Services: Temporary Help Services (250-499 employees: 1 establishment, 20-49 employees: 1 establishment)
Educational Services: Elementary and Secondary Schools (100-249: 1, 20-49: 1)
Health Care and Social Assistance: Other Individual and Family Services (100-249: 1)
People in group quarters in 2010:
258 people in local jails and other municipal confinement facilities
127 people in nursing facilities/skilled-nursing facilities
11 people in group homes intended for adults
2 people in other noninstitutional facilities
People in group quarters in 2000:
688 people in state prisons
189 people in local jails and other confinement facilities (including police lockups)
122 people in nursing homes
8 people in homes for the mentally retarded
6 people in other noninstitutional group quarters
3 people in religious group quarters
Fatal accident statistics in 2014:
Fatal accident count: 2
Vehicles involved in fatal accidents: 3
Fatal accidents caused by drunken drivers: 0
Fatalities: 2
Persons involved in fatal accidents: 3
Pedestrians involved in fatal accidents: 0
Fatal accident statistics in 2013:
Fatal accident count: 2
Vehicles involved in fatal accidents: 3
Fatal accidents caused by drunken drivers: 0
Fatalities: 2
Persons involved in fatal accidents: 6
Pedestrians involved in fatal accidents: 0
2003 - 2018 National Fire Incident Reporting System (NFIRS) incidents
Based on the data from the years 2003 - 2018 the average number of fire incidents per year is 9. The highest number of reported fire incidents - 39 took place in 2014, and the least - 3 in 2003. The data has a rising trend.
When looking into fire subcategories, the most incidents belonged to: Structure Fires (52.9%), and Outside Fires (22.5%).
Fire incident types reported to NFIRS in Zip Code 40033


 Nearest zip codes: 40063, 40009, 40328, 42758, 40069, 42733.


 Based on the data from the years 2003 - 2018 the average number of fire incidents per year is 9. The highest number of reported fire incidents - 39 took place in 2014, and the least - 3 in 2003. The data has a rising trend.
 When looking into fire subcategories, the most incidents belonged to: Structure Fires (52.9%), and Outside Fires (22.5%).