Estimated zip code population in 2022: 20,812 Zip code population in 2010: 16,708 Zip code population in 2000: 11,000
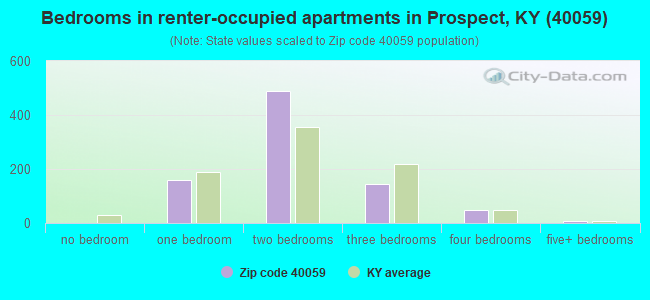
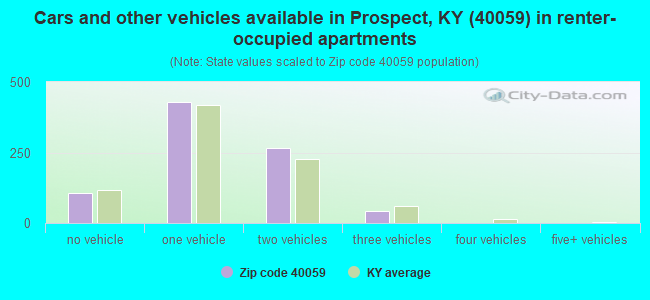
Houses and condos: 8,661 Renter-occupied apartments: 840
% of renters here:
10%
State:
31%
March 2022 cost of living index in zip code 40059: 92.1 (less than average, U.S. average is 100)
Land area: 25.9 sq. mi. Water area: 4.3 sq. mi.
Population density: 803 people per square mile
(low).
OSM Map
General Map
Google Map
MSN Map
OSM Map
General Map
Google Map
MSN Map
OSM Map
General Map
Google Map
MSN Map
OSM Map
General Map
Google Map
MSN Map
Please wait while loading the map...
Real estate property taxes paid for housing units in 2022:
This zip code:
0.8% ($4,820)
Kentucky:
0.7% ($1,456)
Median real estate property taxes paid for housing units with mortgages in 2022: $4,996 (0.8%) Median real estate property taxes paid for housing units with no mortgage in 2022: $4,509 (0.9%)
Business Search- 14 Million verified businesses
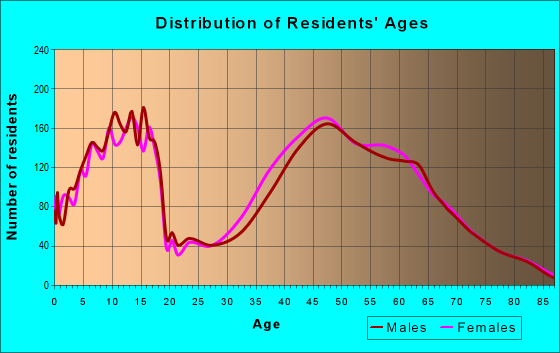
Males: 10,217
(49.1%)
Females: 10,594
(50.9%)
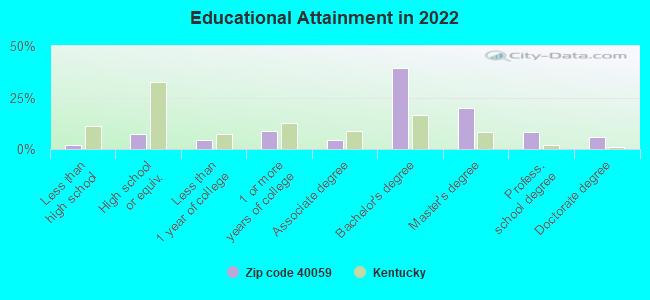
For population 25 years and over in 40059:
High school or higher: 101.7%
Bachelor's degree or higher: 75.8%
Graduate or professional degree: 35.3%
Unemployed: 4.1%
Mean travel time to work (commute): 28.0 minutes
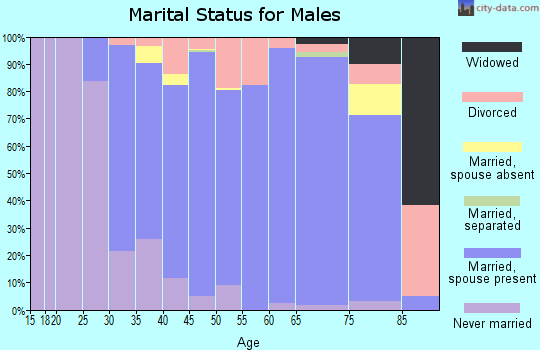
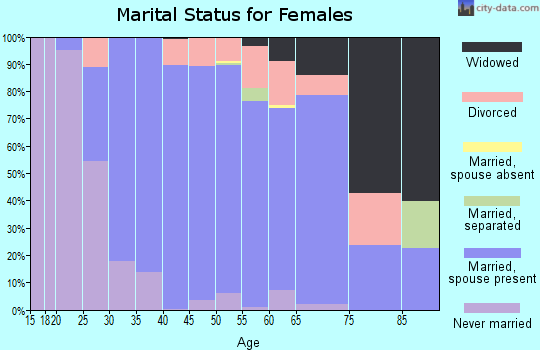
For population 15 years and over in 40059:
Never married: 19.1%
Now married: 68.0%
Separated: 0.7%
Widowed: 4.5%
Divorced: 7.7%
Zip code 40059 compared to state average:
Median household income significantly above state average.
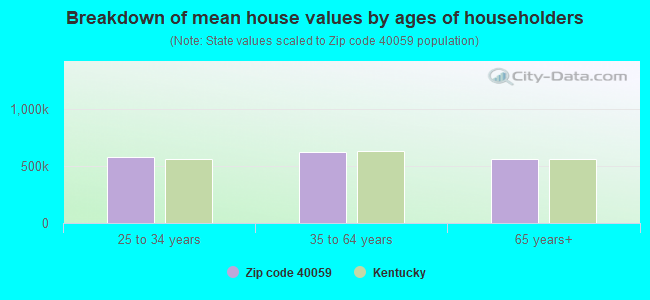
Median house value significantly above state average.
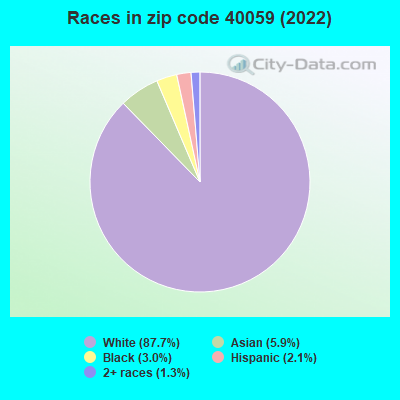
Black race population percentage below state average.
Hispanic race population percentage below state average.
Median age significantly above state average.
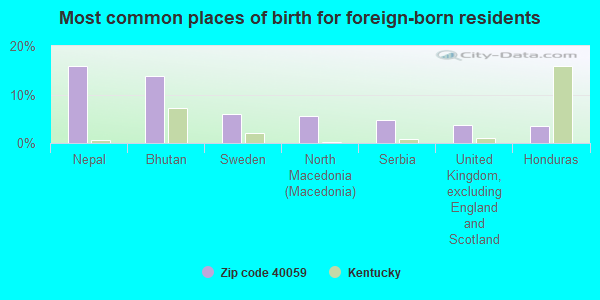
Foreign-born population percentage above state average.
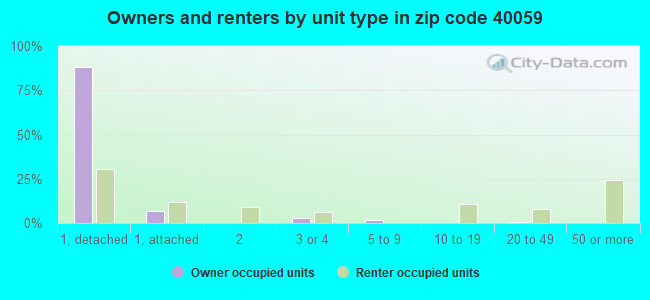
Renting percentage significantly below state average.
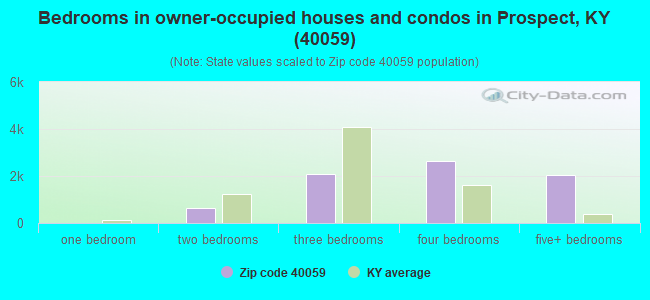
Number of rooms per house significantly above state average.
House age below state average.
Percentage of population with a bachelor's degree or higher significantly above state average.
Estimated median house/condo value in 2022: $567,163
40059:
$567,163
Kentucky:
$196,300
According to our research of Kentucky and other state lists, there were 3 registered sex offenders living in 40059 zip code as of April 25, 2024. The ratio of all residents to sex offenders in zip code 40059 is 6,293 to 1. The ratio of registered sex offenders to all residents in this zip code is much lower than the state average.
Median resident age:
This zip code:
47.5 years
Kentucky median age:
39.4 years
Average household size:
This zip code:
2.5 people
Kentucky:
2.4 people
Averages for the 2020 tax year for zip code 40059, filed in 2021:
Average Adjusted Gross Income (AGI) in 2020: $219,960 (Individual Income Tax Returns)
Here:
$219,960
State:
$61,342
Salary/wage: $160,819 (reported on 78.5% of returns)
Here:
$160,819
State:
$50,827
(% of AGI for various income ranges: 1165.0% for AGIs below $25k, 3560.0% for AGIs $25k-50k, 6128.3% for AGIs $50k-75k, 8851.7% for AGIs $75k-100k, 19745.2% for AGIs $100k-200k, 124861.7% for AGIs over 200k)
Taxable interest for individuals: $3,462 (reported on 51.5% of returns)
This zip code:
$3,462
Kentucky:
$1,441
(% of AGI for various income ranges: 24.1% for AGIs below $25k, 69.9% for AGIs $25k-50k, 102.7% for AGIs $50k-75k, 134.9% for AGIs $75k-100k, 234.9% for AGIs $100k-200k, 1779.7% for AGIs over 200k)
Ordinary dividends: $19,669 (reported on 48.1% of returns)
Here:
$19,669
State:
$7,388
(% of AGI for various income ranges: 96.8% for AGIs below $25k, 271.6% for AGIs $25k-50k, 411.7% for AGIs $50k-75k, 533.9% for AGIs $75k-100k, 1102.1% for AGIs $100k-200k, 9951.9% for AGIs over 200k)
Net capital gain/loss in AGI: +$67,255 (reported on 44.6% of returns)
Here:
+$67,255
State:
+$19,475
(% of AGI for various income ranges: 46.7% for AGIs below $25k, 191.0% for AGIs $25k-50k, 304.4% for AGIs $50k-75k, 452.4% for AGIs $75k-100k, 1381.3% for AGIs $100k-200k, 36800.0% for AGIs over 200k)
Profit/loss from business: +$33,058 (reported on 21.3% of returns)
Here:
+$33,058
State:
+$11,386
(% of AGI for various income ranges: 110.5% for AGIs below $25k, 326.6% for AGIs $25k-50k, 426.5% for AGIs $50k-75k, 646.8% for AGIs $75k-100k, 1129.8% for AGIs $100k-200k, 6623.2% for AGIs over 200k)
Taxable individual retirement arrangement distribution: $34,285 (reported on 16.1% of returns)
40059:
$34,285
Kentucky:
$18,941
(% of AGI for various income ranges: 79.7% for AGIs below $25k, 259.9% for AGIs $25k-50k, 670.8% for AGIs $50k-75k, 1110.0% for AGIs $75k-100k, 1849.0% for AGIs $100k-200k, 3311.3% for AGIs over 200k)
Self-employed (Keogh) retirement plans: $33,586 (reported on 2.8% of returns)
40059:
$33,586
Kentucky:
$23,933
(% of AGI for various income ranges: 95.1% for AGIs $100k-200k, 1124.5% for AGIs over 200k)
Total itemized deductions: $45,043 (reported on 25.8% of returns)
Here:
$45,043
State:
$32,473
(% of AGI for various income ranges: 160.4% for AGIs below $25k, 323.9% for AGIs $25k-50k, 750.4% for AGIs $50k-75k, 1299.3% for AGIs $75k-100k, 1997.5% for AGIs $100k-200k, 10799.1% for AGIs over 200k)
Charity contributions: $20,250 (reported on 23.1% of returns)
Here:
$20,250
State:
$13,472
(% of AGI for various income ranges: 9.8% for AGIs below $25k, 31.2% for AGIs $25k-50k, 106.5% for AGIs $50k-75k, 219.0% for AGIs $75k-100k, 427.6% for AGIs $100k-200k, 5315.7% for AGIs over 200k)
Taxes paid: $9,307 (reported on 25.8% of returns)
40059:
$9,307
State:
$7,830
(% of AGI for various income ranges: 30.0% for AGIs below $25k, 71.6% for AGIs $25k-50k, 195.8% for AGIs $50k-75k, 430.5% for AGIs $75k-100k, 589.4% for AGIs $100k-200k, 1877.2% for AGIs over 200k)
Earned income credit: $1,587 (reported on 4.0% of returns)
Here:
$1,587
State:
$2,336
(% of AGI for various income ranges: 34.5% for AGIs below $25k, 30.0% for AGIs $25k-50k)
Percentage of individuals using paid preparers for their 2020 taxes: 92.8%
Here:
93%
State:
94%
(% for various income ranges: 90.1% for AGIs below $25k, 92.4% for AGIs $25k-50k, 92.8% for AGIs $50k-75k, 92.1% for AGIs $75k-100k, 93.6% for AGIs $100k-200k, 94.6% for AGIs over 200k)
Averages for the 2012 tax year for zip code 40059, filed in 2013:
Average Adjusted Gross Income (AGI) in 2012: $177,555 (Individual Income Tax Returns)
Here:
$177,555
State:
$50,814
Salary/wage: $127,488 (reported on 81.6% of returns)
Here:
$127,488
State:
$42,723
(% of AGI for various income ranges: 73.1% for AGIs below $25k, 63.9% for AGIs $25k-50k, 59.9% for AGIs $50k-75k, 58.1% for AGIs $75k-100k, 68.4% for AGIs $100k-200k, 55.5% for AGIs over 200k)
Taxable interest for individuals: $2,782 (reported on 55.5% of returns)
This zip code:
$2,782
Kentucky:
$1,381
(% of AGI for various income ranges: 2.4% for AGIs below $25k, 1.7% for AGIs $25k-50k, 1.6% for AGIs $50k-75k, 1.3% for AGIs $75k-100k, 0.8% for AGIs $100k-200k, 0.8% for AGIs over 200k)
Ordinary dividends: $28,594 (reported on 49.6% of returns)
Here:
$28,594
State:
$6,239
(% of AGI for various income ranges: 6.6% for AGIs below $25k, 4.2% for AGIs $25k-50k, 5.5% for AGIs $50k-75k, 3.2% for AGIs $75k-100k, 3.2% for AGIs $100k-200k, 9.8% for AGIs over 200k)
Net capital gain/loss in AGI: +$32,722 (reported on 43.2% of returns)
Here:
+$32,722
State:
+$11,336
(% of AGI for various income ranges: 1.0% for AGIs below $25k, 0.8% for AGIs $25k-50k, 2.0% for AGIs $50k-75k, 1.4% for AGIs $75k-100k, 2.0% for AGIs $100k-200k, 10.5% for AGIs over 200k)
Profit/loss from business: +$36,050 (reported on 21.5% of returns)
Here:
+$36,050
State:
+$10,862
(% of AGI for various income ranges: 7.6% for AGIs below $25k, 5.3% for AGIs $25k-50k, 4.7% for AGIs $50k-75k, 3.2% for AGIs $75k-100k, 4.6% for AGIs $100k-200k, 4.3% for AGIs over 200k)
Taxable individual retirement arrangement distribution: $34,810 (reported on 16.3% of returns)
40059:
$34,810
Kentucky:
$14,296
(% of AGI for various income ranges: 4.2% for AGIs below $25k, 4.5% for AGIs $25k-50k, 5.4% for AGIs $50k-75k, 6.8% for AGIs $75k-100k, 5.1% for AGIs $100k-200k, 2.3% for AGIs over 200k)
Self-employment retirement plans: $27,752 (reported on 3.1% of returns)
40059:
$27,752
Kentucky:
$20,768
Total itemized deductions: $41,923 (16% of AGI, reported on 64.8% of returns)
Here:
$41,923
State:
$21,160
Here:
16.2% of AGI
State:
20.0% of AGI
(% of AGI for various income ranges: 22.1% for AGIs below $25k, 21.1% for AGIs $25k-50k, 22.6% for AGIs $50k-75k, 18.5% for AGIs $75k-100k, 19.1% for AGIs $100k-200k, 13.5% for AGIs over 200k)
Charity contributions: $7,645 (reported on 59.3% of returns)
Here:
$7,645
State:
$4,303
(% of AGI for various income ranges: 1.9% for AGIs below $25k, 2.2% for AGIs $25k-50k, 2.7% for AGIs $50k-75k, 2.5% for AGIs $75k-100k, 2.6% for AGIs $100k-200k, 2.6% for AGIs over 200k)
Taxes paid: $20,791 (reported on 64.7% of returns)
40059:
$20,791
State:
$8,496
(% of AGI for various income ranges: 4.8% for AGIs below $25k, 5.4% for AGIs $25k-50k, 7.0% for AGIs $50k-75k, 7.4% for AGIs $75k-100k, 8.6% for AGIs $100k-200k, 7.5% for AGIs over 200k)
Earned income credit: $1,676 (reported on 4.6% of returns)
Here:
$1,676
State:
$2,273
(% of AGI for various income ranges: 2.4% for AGIs below $25k, 0.6% for AGIs $25k-50k)
Percentage of individuals using paid preparers for their 2012 taxes: 62.1%
Here:
62%
State:
60%
(% for various income ranges: 51.7% for AGIs below $25k, 54.4% for AGIs $25k-50k, 62.9% for AGIs $50k-75k, 62.3% for AGIs $75k-100k, 61.3% for AGIs $100k-200k, 77.4% for AGIs over 200k)
Averages for the 2004 tax year for zip code 40059, filed in 2005:
Average Adjusted Gross Income (AGI) in 2004: $136,242 (Individual Income Tax Returns)
Here:
$136,242
State:
$41,540
Salary/wage: $109,637 (reported on 80.4% of returns)
Here:
$109,637
State:
$36,432
(% of AGI for various income ranges: 66.4% for AGIs $10k-25k, 63.0% for AGIs $25k-50k, 67.7% for AGIs $50k-75k, 68.9% for AGIs $75k-100k, 62.7% for AGIs over 100k)
Taxable interest for individuals: $3,160 (reported on 68.7% of returns)
This zip code:
$3,160
Kentucky:
$1,571
(% of AGI for various income ranges: 4.0% for AGIs $10k-25k, 3.3% for AGIs $25k-50k, 2.3% for AGIs $50k-75k, 1.9% for AGIs $75k-100k, 1.3% for AGIs over 100k)
Taxable dividends: $8,308 (reported on 57.6% of returns)
Here:
$8,308
State:
$3,453
(% of AGI for various income ranges: 5.6% for AGIs $10k-25k, 4.8% for AGIs $25k-50k, 3.3% for AGIs $50k-75k, 3.1% for AGIs $75k-100k, 3.3% for AGIs over 100k)
Net capital gain/loss: +$22,154 (reported on 51.0% of returns)
Here:
+$22,154
State:
+$9,663
(% of AGI for various income ranges: 3.1% for AGIs $10k-25k, 2.6% for AGIs $25k-50k, 1.5% for AGIs $50k-75k, 1.9% for AGIs $75k-100k, 9.2% for AGIs over 100k)
Profit/loss from business: +$33,574 (reported on 21.1% of returns)
Here:
+$33,574
State:
+$9,233
(% of AGI for various income ranges: 6.0% for AGIs $10k-25k, 5.8% for AGIs $25k-50k, 5.5% for AGIs $50k-75k, 4.7% for AGIs $75k-100k, 5.2% for AGIs over 100k)
IRA payment deduction: $3,791 (reported on 3.6% of returns)
40059:
$3,791
Kentucky:
$2,955
(% of AGI for various income ranges: 0.6% for AGIs $10k-25k, 0.4% for AGIs $25k-50k, 0.3% for AGIs $50k-75k, 0.3% for AGIs $75k-100k, 0.1% for AGIs over 100k)
Self-employed pension: $21,919 (reported on 3.9% of returns)
Here:
$21,919
Kentucky:
$14,996
(% of AGI for various income ranges: 0.4% for AGIs $50k-75k, 0.4% for AGIs $75k-100k, 0.7% for AGIs over 100k)
Total itemized deductions: $34,652 (17% of AGI, reported on 65.9% of returns)
Here:
$34,652
State:
$17,474
Here:
17.4% of AGI
State:
21.0% of AGI
(% of AGI for various income ranges: 24.9% for AGIs $10k-25k, 25.6% for AGIs $25k-50k, 25.7% for AGIs $50k-75k, 23.2% for AGIs $75k-100k, 15.1% for AGIs over 100k)
Charity contributions deductions: $6,369 (3% of AGI, reported on 62.6% of returns)
Here:
$6,369
State:
$3,494
Here:
3.1% of AGI
State:
4.0% of AGI
(% of AGI for various income ranges: 2.4% for AGIs $10k-25k, 3.1% for AGIs $25k-50k, 3.4% for AGIs $50k-75k, 3.4% for AGIs $75k-100k, 2.8% for AGIs over 100k)
Total tax: $32,235 (reported on 83.5% of returns)
40059:
$32,235
State:
$6,162
(% of AGI for various income ranges: 5.2% for AGIs $10k-25k, 7.1% for AGIs $25k-50k, 9.0% for AGIs $50k-75k, 9.9% for AGIs $75k-100k, 21.4% for AGIs over 100k)
Earned income credit: $1,376 (reported on 3.4% of returns)
Here:
$1,376
State:
$1,723
Percentage of individuals using paid preparers for their 2004 taxes: 64.7%
Here:
65%
State:
66%
(% for various income ranges: 58.9% for AGIs below $10k, 60.6% for AGIs $10k-25k, 61.8% for AGIs $25k-50k, 67.1% for AGIs $50k-75k, 63.1% for AGIs $75k-100k, 69.2% for AGIs over 100k)
Likely homosexual households (counted as self-reported same-sex unmarried-partner households)
Lesbian couples: 0.1% of all households
Gay men: 0.0% of all households
Household received Food Stamps/SNAP in the past 12 months: 94 Household did not receive Food Stamps/SNAP in the past 12 months: 8,238
Women who had a birth in the past 12 months: 292 (261 now married, 26 unmarried) Women who did not have a birth in the past 12 months: 3,611 (2,191 now married, 1,432 unmarried)
Housing units in zip code 40059 with a mortgage: 4,884 (738 second mortgage, 70 home equity loan, 615 both second mortgage and home equity loan) Houses without a mortgage: 239
Median monthly owner costs for units with a mortgage: $2,807 Median monthly owner costs for units without a mortgage: $916
Residents with income below the poverty level in 2022:
This zip code:
2.2%
Whole state:
16.5%
Residents with income below 50% of the poverty level in 2022:
This zip code:
1.4%
Whole state:
9.0%
Median number of rooms in houses and condos:
Here:
10.0
State:
6.4
Median number of rooms in apartments:
Here:
4.8
State:
4.4
Notable locations in this zip code not listed on our city pages
Streams, rivers, and creeks: Wolf Pen Branch (A), Sinking Fork (B), Pond Creek (C), Little Huckleberry Creek (D), Hite Creek (E), Harrods Creek (F). Display/hide their locations on the map
In group quarters: 100 (-1 institutionalized population)
Size of family households: 3,046 2-persons, 1,499 3-persons, 1,269 4-persons, 570 5-persons, 68 6-persons, 34 7-or-more-persons
Size of nonfamily households: 1,622 1-person, 229 2-persons
4,104 married couples with children.
632 single-parent households (234 men, 398 women).
92.4% of residents of 40059 zip code speak English at home.
0.6% of residents speak Spanish at home (93% very well, 7% well).
4.2% of residents speak other Indo-European language at home (91% very well, 8% well, 1% not at all).
2.5% of residents speak Asian or Pacific Island language at home (71% very well, 16% well, 6% not well, 7% not at all).
0.2% of residents speak other language at home (100% very well).
Foreign born population: 1,874 (9.0%) (81.5% of them are naturalized citizens)
This zip code:
9.0%
Whole state:
4.0%
16%Nepal
14%Bhutan
6%Sweden
6%North Macedonia (Macedonia)
5%Serbia
4%United Kingdom, excluding England and Scotland
4%Honduras
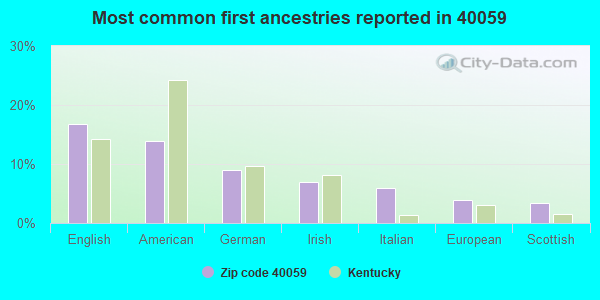
17%English
14%American
9%German
7%Irish
6%Italian
4%European
3%Scottish
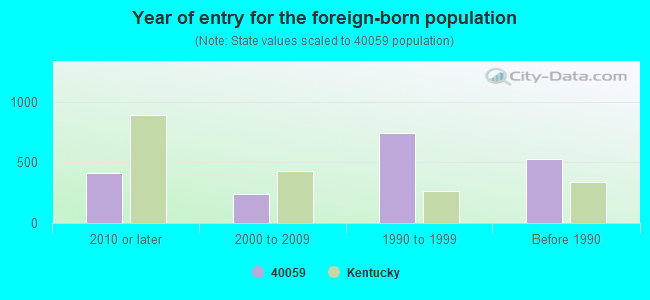
Year of entry for the foreign-born population
4102010 or later
2412000 to 2009
7391990 to 1999
530Before 1990
Major facilities with environmental interests located in this zip code:
LOUISVILLE WATER COMPANY (7400 UPPER RIVER ROAD in PROSPECT, KY)
National Pollutant Discharge Elimination System NON-MAJOR (Tracking pollutant discharge elimination systems) - permit Conditionally Exempt Small Quantity Generators, less than 100 kg/month of hazardous waste (Resource Conservation and Recovery Act (tracking hazardous waste)) - notification Business SIC classification: WATER SUPPLY Organizations: LOUISVILLE WATER CO PAYNE WTP (CONTACT/OWNER)
, METRO LOUISVILLE (CONTACT/OWNER)
Alternative names: LOUISVILLE WATER CO PAYNE WTP
B E PAYNE WTP (7400 UPPER ROAD in LOUISVILLE, KY)
National Pollutant Discharge Elimination System NON-MAJOR (Tracking pollutant discharge elimination systems) - permit Business SIC classification: WATER SUPPLY
BENMAR OFFICE BUILDING (13001 W HWY 42 in PROSPECT, KY)
National Pollutant Discharge Elimination System NON-MAJOR (Tracking pollutant discharge elimination systems) - permit Business SIC classification: GENERAL CONTRACTORS-INDUSTRIAL BUILDINGS AND WAREHOUSES
COLLINS RESIDENCE (5111 CHERRY VALLEY RD in PROSPECT, KY)
National Pollutant Discharge Elimination System NON-MAJOR (Tracking pollutant discharge elimination systems) - permit Business SIC classification: OPERATORS OF DWELLINGS OTHER THAN APARTMENT BUILDINGS
COVERED BRIDGE STP (12722 HIGH MEADOWS PIKE in PROSPECT, KY)
National Pollutant Discharge Elimination System NON-MAJOR (Tracking pollutant discharge elimination systems) - permit Business SIC classification: LAND SUBDIVIDERS AND DEVELOPERS, EXCEPT CEMETERIES
MSD HUNTING CREEK SOUTH STP (OFF MONTERO & 6500 DEEP CREEK in PROSPECT, KY)
National Pollutant Discharge Elimination System NON-MAJOR (Tracking pollutant discharge elimination systems) - permit Business SIC classification: SEWERAGE SYSTEMS
MSD NORTH HUNTING CREEK STP (HAPPY HOLLOW RD US HWY 42 in PROSPECT, KY)
National Pollutant Discharge Elimination System NON-MAJOR (Tracking pollutant discharge elimination systems) - permit Business SIC classification: SEWERAGE SYSTEMS
MSD TIMBERLAKE STP (TIMBER RIDGE DR HWY 42 in PROSPECT, KY)
National Pollutant Discharge Elimination System NON-MAJOR (Tracking pollutant discharge elimination systems) - permit Business SIC classification: SEWERAGE SYSTEMS
NORTON COMMONS SECTION B (FEATHERBELL BLVD in LOUISVILLE, KY)
National Pollutant Discharge Elimination System NON-MAJOR (Tracking pollutant discharge elimination systems) - permit Business SIC classification: HIGHWAY AND STREET CONSTRUCTION, EXCEPT ELEVATED HIGHWAYS
NORTON COMMONS SUBD SEC B PH 4 (FEATHERBELL BLVD in LOUISVILLE, KY)
National Pollutant Discharge Elimination System NON-MAJOR (Tracking pollutant discharge elimination systems) - permit Business SIC classification: HIGHWAY AND STREET CONSTRUCTION, EXCEPT ELEVATED HIGHWAYS
OHM, INC. DBA ONE HOUR MARTINIZING (9549 HIGHWAY 42 in PROSPECT, KY)
(Resource Conservation and Recovery Act (tracking hazardous waste))
PARAMONT ESTATES SUBD (11720 PARAMOUNT WAY in PROSPECT, KY)
National Pollutant Discharge Elimination System NON-MAJOR (Tracking pollutant discharge elimination systems) - permit Business SIC classification: LAND SUBDIVIDERS AND DEVELOPERS, EXCEPT CEMETERIES
FONTAINE RESIDENCE (8200 WOLF PEN BRANCH RD in PROSPECT, KY)
National Pollutant Discharge Elimination System NON-MAJOR (Tracking pollutant discharge elimination systems) - permit Business SIC classification: OPERATORS OF DWELLINGS OTHER THAN APARTMENT BUILDINGS
Housing units lacking complete plumbing facilities: 0.2% Housing units lacking complete kitchen facilities: 0.5%
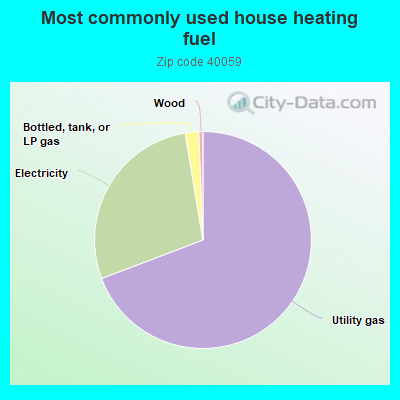
68.6%Utility gas
27.9%Electricity
2.0%Bottled, tank, or LP gas
0.6%Wood
Population in 1990: 7,454. Population change in the 1990s: +3,546 (+47.6%).
Place of birth for U.S.-born residents:
This state: 10,194
Northeast: 1,733
Midwest: 3,974
South: 2,349
West: 748
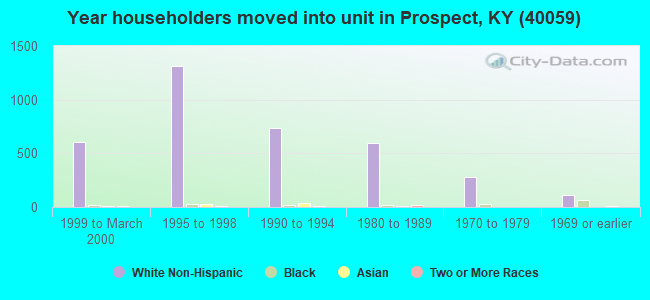
49% of the 40059 zip code residents lived in the same house 5 years ago. Out of people who lived in different houses, 43% lived in this county. Out of people who lived in different counties, 50% lived in Kentucky.
90% of the 40059 zip code residents lived in the same house 1 year ago. Out of people who lived in different houses, 41% moved from this county. Out of people who lived in different houses, 14% moved from different county within same state. Out of people who lived in different houses, 45% moved from different state. Out of people who lived in different houses, 4% moved from abroad.
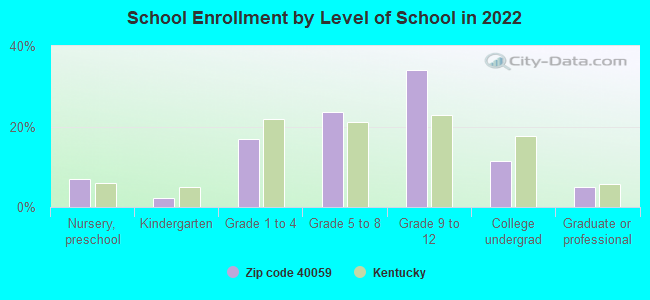
Private vs. public school enrollment:
Students in private schools in grades 1 to 8 (elementary and middle school): 514
Here:
24.5%
Kentucky:
17.2%
Students in private schools in grades 9 to 12 (high school): 835
Here:
46.3%
Kentucky:
15.2%
Students in private undergraduate colleges: 124
Here:
21.1%
Kentucky:
19.6%
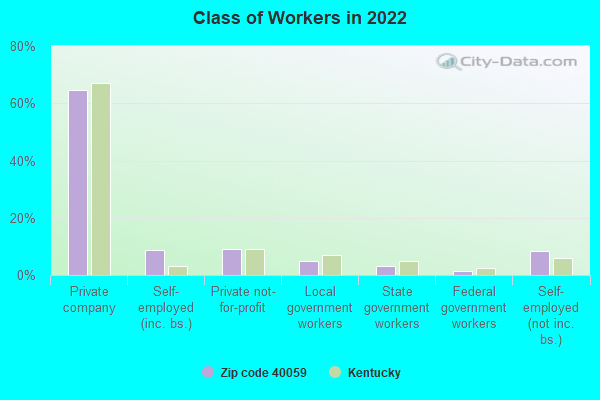
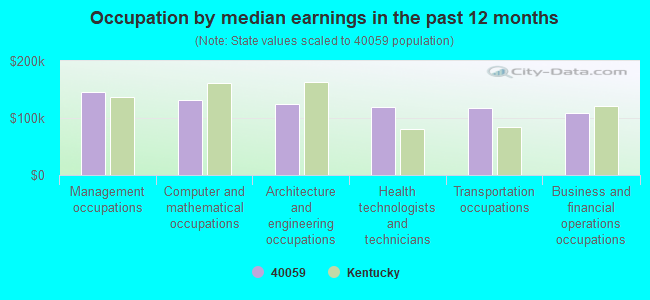
Occupation by median earnings in the past 12 months ($)
146,257Management occupations
131,309Computer and mathematical occupations
125,157Architecture and engineering occupations
118,787Health technologists and technicians
116,878Transportation occupations
109,402Business and financial operations occupations
Companies with federal contracts located in this zip code (PROSPECT, KY):
MARSH CREEK, LLC (13306 W HWY 42, STE 800; small business)
$1,743,499 with Army for Construction of Structures and Facilities -- Other Non-Building Facilities. Signed on 2006-02-09. Completion date: 2007-02-09.
ADVANCED GLOBAL COMMUNICATIONS (13314 W HIGHWAY 42; small business) : $318,023 in 4 contractsfrom 2000 to 2003
$194,060 with U.S. Army Corps of Engineers - civil program financing only for ADP Components. Signed on 2000-03-30. Completion date: 2000-05-22.
$44,620 with U.S. Army Corps of Engineers - civil program financing only for ADP Facility Operation and Maintenance Services. Signed on 2000-02-16. Completion date: 1999-12-15.
$40,517 with U.S. Army Corps of Engineers - civil program financing only for Cable, Cord, and Wire Assemblies: Communications Equipment. Signed on 2000-12-04. Completion date: 2000-12-15.
$38,826 with U.S. Army Corps of Engineers - civil program financing only for Telephone and/or Communications Services (includes Telegraph, Telex, and Cablevision Services). Signed on 2003-07-24. Completion date: 2003-08-08.
GLOBAL DATA COMMUNICATIONS INC (7923 A MONTERO DR; small business)
$39,480 with Army for Communications Security Equipment and Components. Taking place in VA. Signed on 2002-02-19. Completion date: 2002-01-31.
PEAK PERFORMANCE FITNESS EQUIP (9523 US HIGHWAY 42; small business) : $35,073 in 5 contractsfrom 2002 to 2006
Contracts for Athletic and Sporting Equipment, Recreational and Gymnastic Equipment by Army Signed by year:2000: $0; 2001: $0; 2002: $8,890; 2003: $0; 2004: $9,990; 2005: $0; 2006: $16,193.
Biggest contracts:
$9,990 with Army for Athletic and Sporting Equipment. Signed on 2004-01-27. Completion date: 2004-02-18.
$8,890 with Army for Recreational and Gymnastic Equipment. Signed on 2002-08-13. Completion date: 2002-09-30.
$6,599 with Army for Athletic and Sporting Equipment. Signed on 2006-04-26. Completion date: 2006-05-12.
$6,599, same as above.Signed on 2006-01-30. Completion date: 2006-02-10.
Top industries in this zip code by the number of employees in 2005:
2002 - 2018 National Fire Incident Reporting System (NFIRS) incidents
Based on the data from the years 2002 - 2018 the average number of fire incidents per year is 34. The highest number of fires - 63 took place in 2004, and the least - 18 in 2011. The data has an increasing trend.
When looking into fire subcategories, the most incidents belonged to: Structure Fires (45.6%), and Outside Fires (37.1%).
Fire incident types reported to NFIRS in Zip Code 40059


 Nearest zip codes: 40241, 40025, 40242, 40222, 40026, 47130.
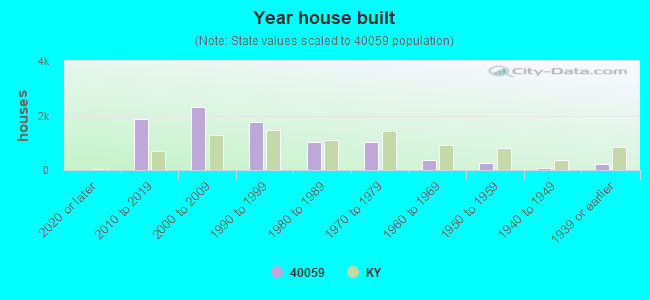


 Based on the data from the years 2002 - 2018 the average number of fire incidents per year is 34. The highest number of fires - 63 took place in 2004, and the least - 18 in 2011. The data has an increasing trend.
 When looking into fire subcategories, the most incidents belonged to: Structure Fires (45.6%), and Outside Fires (37.1%).