Estimated zip code population in 2022: 27,544 Zip code population in 2010: 26,465 Zip code population in 2000: 24,117
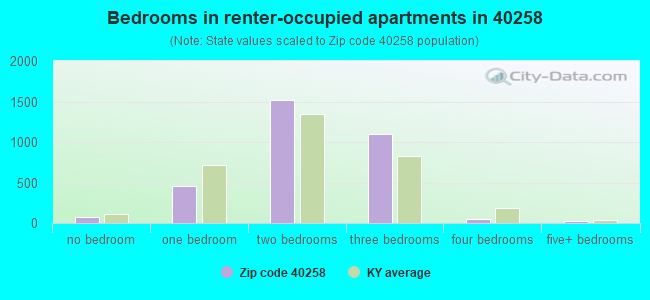
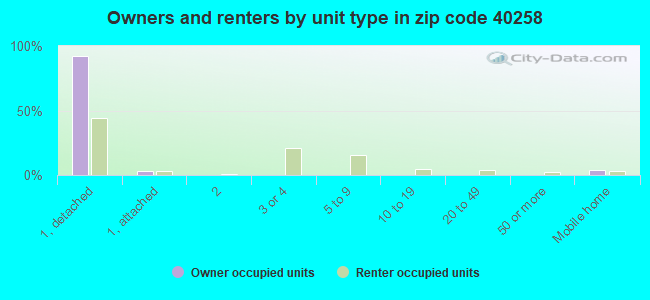
Houses and condos: 11,632 Renter-occupied apartments: 3,257
% of renters here:
30%
State:
31%
March 2022 cost of living index in zip code 40258: 87.8 (less than average, U.S. average is 100)
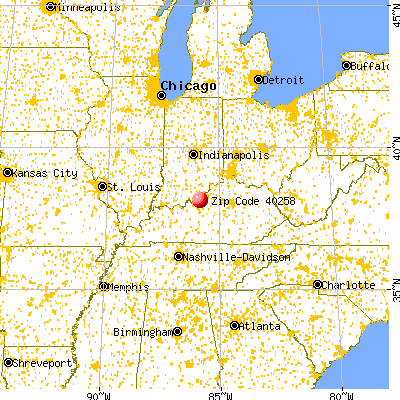
Land area: 11.7 sq. mi. Water area: 1.5 sq. mi.
Population density: 2,358 people per square mile
(low).
OSM Map
General Map
Google Map
MSN Map
OSM Map
General Map
Google Map
MSN Map
OSM Map
General Map
Google Map
MSN Map
OSM Map
General Map
Google Map
MSN Map
Please wait while loading the map...
Real estate property taxes paid for housing units in 2022:
This zip code:
0.8% ($1,370)
Kentucky:
0.7% ($1,456)
Median real estate property taxes paid for housing units with mortgages in 2022: $1,396 (0.8%) Median real estate property taxes paid for housing units with no mortgage in 2022: $1,308 (0.8%)
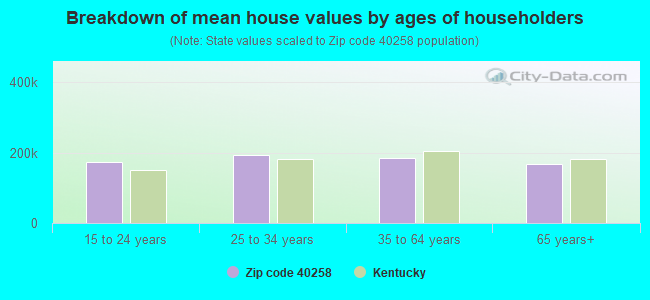
Estimated median house/condo value in 2022: $175,006
40258:
$175,006
Kentucky:
$196,300
According to our research of Kentucky and other state lists, there were 54 registered sex offenders living in 40258 zip code as of April 17, 2024. The ratio of all residents to sex offenders in zip code 40258 is 515 to 1. The ratio of registered sex offenders to all residents in this zip code is near the state average.
Median resident age:
This zip code:
37.9 years
Kentucky median age:
39.4 years
Average household size:
This zip code:
2.5 people
Kentucky:
2.4 people
Averages for the 2020 tax year for zip code 40258, filed in 2021:
Average Adjusted Gross Income (AGI) in 2020: $45,187 (Individual Income Tax Returns)
Here:
$45,187
State:
$61,342
Salary/wage: $40,987 (reported on 86.1% of returns)
Here:
$40,987
State:
$50,827
(% of AGI for various income ranges: 1140.1% for AGIs below $25k, 3508.5% for AGIs $25k-50k, 6335.3% for AGIs $50k-75k, 9089.5% for AGIs $75k-100k, 15065.3% for AGIs $100k-200k)
Taxable interest for individuals: $609 (reported on 15.7% of returns)
This zip code:
$609
Kentucky:
$1,441
(% of AGI for various income ranges: 6.2% for AGIs below $25k, 10.0% for AGIs $25k-50k, 17.6% for AGIs $50k-75k, 15.1% for AGIs $75k-100k, 34.4% for AGIs $100k-200k)
Ordinary dividends: $1,825 (reported on 7.6% of returns)
Here:
$1,825
State:
$7,388
(% of AGI for various income ranges: 6.4% for AGIs below $25k, 12.7% for AGIs $25k-50k, 31.1% for AGIs $50k-75k, 30.8% for AGIs $75k-100k, 48.6% for AGIs $100k-200k)
Net capital gain/loss in AGI: +$4,918 (reported on 6.1% of returns)
Here:
+$4,918
State:
+$19,475
(% of AGI for various income ranges: 4.8% for AGIs below $25k, 10.5% for AGIs $25k-50k, 25.1% for AGIs $50k-75k, 35.6% for AGIs $75k-100k, 247.6% for AGIs $100k-200k)
Profit/loss from business: +$4,534 (reported on 11.6% of returns)
Here:
+$4,534
State:
+$11,386
(% of AGI for various income ranges: 55.1% for AGIs below $25k, 16.6% for AGIs $25k-50k, 66.5% for AGIs $50k-75k, 117.6% for AGIs $75k-100k, 325.6% for AGIs $100k-200k)
Taxable individual retirement arrangement distribution: $12,837 (reported on 6.4% of returns)
40258:
$12,837
Kentucky:
$18,941
(% of AGI for various income ranges: 35.7% for AGIs below $25k, 61.3% for AGIs $25k-50k, 138.4% for AGIs $50k-75k, 168.4% for AGIs $75k-100k, 524.9% for AGIs $100k-200k)
Total itemized deductions: $23,127 (reported on 3.6% of returns)
Here:
$23,127
State:
$32,473
(% of AGI for various income ranges: 17.5% for AGIs below $25k, 57.4% for AGIs $25k-50k, 176.1% for AGIs $50k-75k, 263.2% for AGIs $75k-100k, 442.0% for AGIs $100k-200k)
Charity contributions: $6,733 (reported on 2.7% of returns)
Here:
$6,733
State:
$13,472
(% of AGI for various income ranges: 8.8% for AGIs $25k-50k, 34.2% for AGIs $50k-75k, 59.2% for AGIs $75k-100k, 144.6% for AGIs $100k-200k)
Taxes paid: $6,588 (reported on 3.6% of returns)
40258:
$6,588
State:
$7,830
(% of AGI for various income ranges: 2.2% for AGIs below $25k, 10.5% for AGIs $25k-50k, 53.9% for AGIs $50k-75k, 90.9% for AGIs $75k-100k, 142.7% for AGIs $100k-200k)
Earned income credit: $2,241 (reported on 21.0% of returns)
Here:
$2,241
State:
$2,336
(% of AGI for various income ranges: 101.9% for AGIs below $25k, 68.2% for AGIs $25k-50k, 0.7% for AGIs $50k-75k)
Percentage of individuals using paid preparers for their 2020 taxes: 94.9%
Here:
95%
State:
94%
(% for various income ranges: 94.1% for AGIs below $25k, 95.2% for AGIs $25k-50k, 95.5% for AGIs $50k-75k, 95.7% for AGIs $75k-100k, 95.2% for AGIs $100k-200k, 100.0% for AGIs over 200k)
Averages for the 2012 tax year for zip code 40258, filed in 2013:
Average Adjusted Gross Income (AGI) in 2012: $39,875 (Individual Income Tax Returns)
Here:
$39,875
State:
$50,814
Salary/wage: $36,809 (reported on 86.7% of returns)
Here:
$36,809
State:
$42,723
(% of AGI for various income ranges: 74.0% for AGIs below $25k, 81.2% for AGIs $25k-50k, 80.3% for AGIs $50k-75k, 82.3% for AGIs $75k-100k, 82.8% for AGIs $100k-200k, 55.3% for AGIs over 200k)
Taxable interest for individuals: $883 (reported on 20.0% of returns)
This zip code:
$883
Kentucky:
$1,381
(% of AGI for various income ranges: 0.7% for AGIs below $25k, 0.4% for AGIs $25k-50k, 0.4% for AGIs $50k-75k, 0.4% for AGIs $75k-100k, 0.5% for AGIs $100k-200k)
Ordinary dividends: $1,731 (reported on 10.4% of returns)
Here:
$1,731
State:
$6,239
(% of AGI for various income ranges: 0.6% for AGIs below $25k, 0.4% for AGIs $25k-50k, 0.3% for AGIs $50k-75k, 0.4% for AGIs $75k-100k, 0.8% for AGIs $100k-200k)
Net capital gain/loss in AGI: +$1,815 (reported on 6.3% of returns)
Here:
+$1,815
State:
+$11,336
(% of AGI for various income ranges: 0.1% for AGIs $25k-50k, 0.5% for AGIs $50k-75k, 0.1% for AGIs $75k-100k, 0.7% for AGIs $100k-200k)
Profit/loss from business: +$6,258 (reported on 9.8% of returns)
Here:
+$6,258
State:
+$10,862
(% of AGI for various income ranges: 5.3% for AGIs below $25k, 1.1% for AGIs $25k-50k, 1.0% for AGIs $50k-75k, 0.9% for AGIs $75k-100k, 0.8% for AGIs $100k-200k)
Taxable individual retirement arrangement distribution: $9,575 (reported on 8.3% of returns)
40258:
$9,575
Kentucky:
$14,296
(% of AGI for various income ranges: 2.6% for AGIs below $25k, 1.8% for AGIs $25k-50k, 1.9% for AGIs $50k-75k, 1.9% for AGIs $75k-100k, 2.3% for AGIs $100k-200k)
Total itemized deductions: $15,804 (24% of AGI, reported on 30.1% of returns)
Here:
$15,804
State:
$21,160
Here:
23.6% of AGI
State:
20.0% of AGI
(% of AGI for various income ranges: 6.3% for AGIs below $25k, 10.4% for AGIs $25k-50k, 12.8% for AGIs $50k-75k, 13.8% for AGIs $75k-100k, 15.5% for AGIs $100k-200k, 12.7% for AGIs over 200k)
Charity contributions: $2,332 (reported on 24.3% of returns)
Here:
$2,332
State:
$4,303
(% of AGI for various income ranges: 0.6% for AGIs below $25k, 1.1% for AGIs $25k-50k, 1.6% for AGIs $50k-75k, 1.6% for AGIs $75k-100k, 2.0% for AGIs $100k-200k, 2.2% for AGIs over 200k)
Taxes paid: $5,867 (reported on 30.1% of returns)
40258:
$5,867
State:
$8,496
(% of AGI for various income ranges: 1.1% for AGIs below $25k, 3.0% for AGIs $25k-50k, 4.6% for AGIs $50k-75k, 5.9% for AGIs $75k-100k, 7.3% for AGIs $100k-200k, 6.9% for AGIs over 200k)
Earned income credit: $2,222 (reported on 22.3% of returns)
Here:
$2,222
State:
$2,273
(% of AGI for various income ranges: 7.0% for AGIs below $25k, 1.2% for AGIs $25k-50k)
Percentage of individuals using paid preparers for their 2012 taxes: 51.1%
Here:
51%
State:
60%
(% for various income ranges: 47.9% for AGIs below $25k, 50.4% for AGIs $25k-50k, 54.7% for AGIs $50k-75k, 57.1% for AGIs $75k-100k, 59.7% for AGIs $100k-200k, 66.7% for AGIs over 200k)
Averages for the 2004 tax year for zip code 40258, filed in 2005:
Average Adjusted Gross Income (AGI) in 2004: $35,665 (Individual Income Tax Returns)
Here:
$35,665
State:
$41,540
Salary/wage: $33,430 (reported on 87.6% of returns)
Here:
$33,430
State:
$36,432
(% of AGI for various income ranges: 82.0% for AGIs below $10k, 75.4% for AGIs $10k-25k, 81.9% for AGIs $25k-50k, 85.6% for AGIs $50k-75k, 85.9% for AGIs $75k-100k, 75.0% for AGIs over 100k)
Taxable interest for individuals: $1,043 (reported on 35.2% of returns)
This zip code:
$1,043
Kentucky:
$1,571
(% of AGI for various income ranges: 2.6% for AGIs below $10k, 2.1% for AGIs $10k-25k, 1.0% for AGIs $25k-50k, 0.6% for AGIs $50k-75k, 0.6% for AGIs $75k-100k, 1.3% for AGIs over 100k)
Taxable dividends: $1,081 (reported on 14.3% of returns)
Here:
$1,081
State:
$3,453
(% of AGI for various income ranges: 1.1% for AGIs below $10k, 0.5% for AGIs $10k-25k, 0.4% for AGIs $25k-50k, 0.3% for AGIs $50k-75k, 0.3% for AGIs $75k-100k, 1.2% for AGIs over 100k)
Net capital gain/loss: +$2,516 (reported on 9.1% of returns)
Here:
+$2,516
State:
+$9,663
(% of AGI for various income ranges: -1.0% for AGIs below $10k, 0.2% for AGIs $10k-25k, 0.2% for AGIs $25k-50k, 0.3% for AGIs $50k-75k, 0.8% for AGIs $75k-100k, 3.7% for AGIs over 100k)
Profit/loss from business: +$5,718 (reported on 9.7% of returns)
Here:
+$5,718
State:
+$9,233
(% of AGI for various income ranges: 5.9% for AGIs below $10k, 2.9% for AGIs $10k-25k, 1.5% for AGIs $25k-50k, 1.2% for AGIs $50k-75k, 1.3% for AGIs $75k-100k, 0.3% for AGIs over 100k)
IRA payment deduction: $2,471 (reported on 1.6% of returns)
40258:
$2,471
Kentucky:
$2,955
(% of AGI for various income ranges: 0.2% for AGIs $10k-25k, 0.1% for AGIs $25k-50k, 0.1% for AGIs $50k-75k, 0.1% for AGIs $75k-100k)
Total itemized deductions: $13,764 (24% of AGI, reported on 35.5% of returns)
Here:
$13,764
State:
$17,474
Here:
24.3% of AGI
State:
21.0% of AGI
(% of AGI for various income ranges: 8.5% for AGIs below $10k, 7.8% for AGIs $10k-25k, 12.8% for AGIs $25k-50k, 15.3% for AGIs $50k-75k, 16.3% for AGIs $75k-100k, 17.1% for AGIs over 100k)
Charity contributions deductions: $1,834 (3% of AGI, reported on 31.6% of returns)
Here:
$1,834
State:
$3,494
Here:
3.1% of AGI
State:
4.0% of AGI
(% of AGI for various income ranges: 0.6% for AGIs below $10k, 0.9% for AGIs $10k-25k, 1.5% for AGIs $25k-50k, 1.7% for AGIs $50k-75k, 1.9% for AGIs $75k-100k, 2.7% for AGIs over 100k)
Total tax: $3,626 (reported on 75.8% of returns)
40258:
$3,626
State:
$6,162
(% of AGI for various income ranges: 2.0% for AGIs below $10k, 3.7% for AGIs $10k-25k, 6.5% for AGIs $25k-50k, 8.1% for AGIs $50k-75k, 9.9% for AGIs $75k-100k, 13.8% for AGIs over 100k)
Earned income credit: $1,727 (reported on 18.0% of returns)
Here:
$1,727
State:
$1,723
Percentage of individuals using paid preparers for their 2004 taxes: 61.0%
Here:
61%
State:
66%
(% for various income ranges: 52.6% for AGIs below $10k, 63.2% for AGIs $10k-25k, 62.6% for AGIs $25k-50k, 61.8% for AGIs $50k-75k, 62.0% for AGIs $75k-100k, 65.8% for AGIs over 100k)
Likely homosexual households (counted as self-reported same-sex unmarried-partner households)
Lesbian couples: 0.4% of all households
Gay men: 0.0% of all households
Household received Food Stamps/SNAP in the past 12 months: 1,175 Household did not receive Food Stamps/SNAP in the past 12 months: 9,660
Women who had a birth in the past 12 months: 367 (95 now married, 280 unmarried) Women who did not have a birth in the past 12 months: 6,094 (2,432 now married, 3,654 unmarried)
Housing units in zip code 40258 with a mortgage: 4,927 (419 second mortgage, 312 both second mortgage and home equity loan) Houses without a mortgage: 75
Median monthly owner costs for units with a mortgage: $1,215 Median monthly owner costs for units without a mortgage: $507
Residents with income below the poverty level in 2022:
This zip code:
15.4%
Whole state:
16.5%
Residents with income below 50% of the poverty level in 2022:
This zip code:
8.2%
Whole state:
9.0%
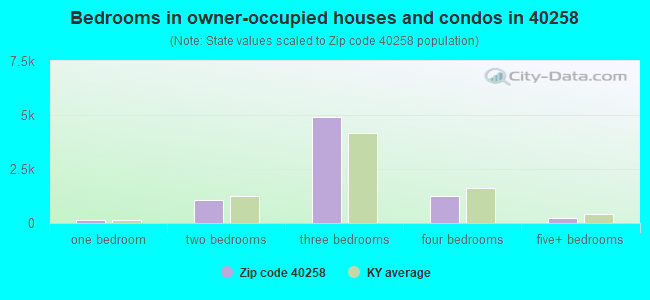
Median number of rooms in houses and condos:
Here:
5.8
State:
6.4
Median number of rooms in apartments:
Here:
4.7
State:
4.4
Notable locations in this zip code not listed on our city pages
Notable locations in zip code 40258: Pleasure Ridge Park Fire Department Station 3 (A), Pleasure Ridge Park Fire Department Station 1 (B), Pleasure Ridge Park Fire Department Training Facility (C), Pleasure Ridge Park Fire Department Headquarters (D). Display/hide their locations on the map
Churches in zip code 40258 include: Greenwood Church (A), Lighthouse of Prayer Church (B), Saint Polycarp Catholic Church (C), Saint Paul Church (D), Saint Clement Church (E), Rutledge Road Baptist Church (F), Ridgewood Baptist Church (G), Restoration of the Primitive Christian Church (H), Open Door Baptist Church (I). Display/hide their locations on the map
Tourist attractions (not listed on the city page) : Big Dixie Bingo (Amusement & Theme Parks; 8019 Dixie Highway), Charity Hall Bingo (Amusement & Theme Parks; 5001 Stephan Drive), Have Music Will Travel (Arcades & Amusements; 7206 Durst Dr).
In group quarters: 1 (-1 institutionalized population)
Size of family households: 2,899 2-persons, 2,116 3-persons, 1,184 4-persons, 679 5-persons, 301 6-persons, 111 7-or-more-persons
Size of nonfamily households: 3,065 1-person, 476 2-persons, 17 3-persons
2,881 married couples with children.
2,371 single-parent households (407 men, 1,964 women).
91.0% of residents of 40258 zip code speak English at home.
4.9% of residents speak Spanish at home (36% very well, 23% well, 26% not well, 14% not at all).
0.3% of residents speak other Indo-European language at home (100% very well).
1.1% of residents speak Asian or Pacific Island language at home (70% very well, 23% well, 6% not at all).
3.0% of residents speak other language at home (30% very well, 54% well, 15% not well).
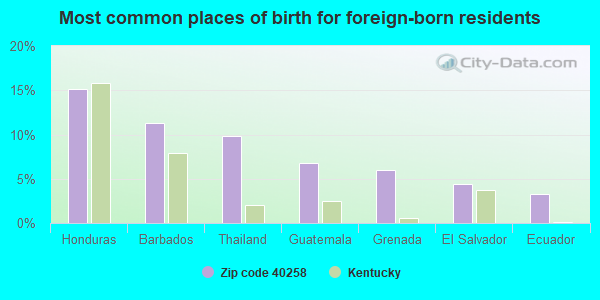
Foreign born population: 1,844 (6.7%) (30.3% of them are naturalized citizens)
This zip code:
6.7%
Whole state:
4.0%
15%Honduras
11%Barbados
10%Thailand
7%Guatemala
6%Grenada
4%El Salvador
3%Ecuador
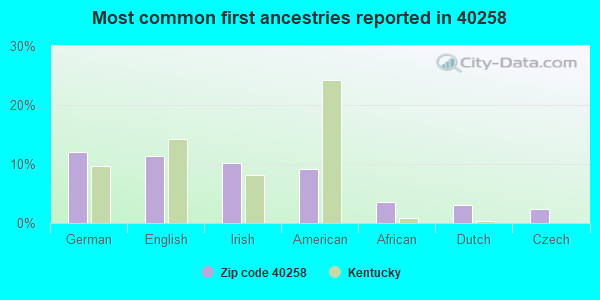
12%German
11%English
10%Irish
9%American
4%African
3%Dutch
2%Czech
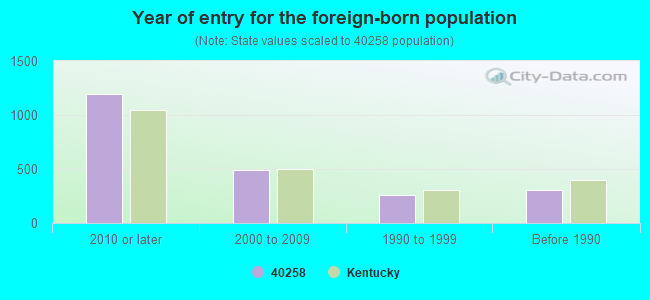
Year of entry for the foreign-born population
1,1912010 or later
4952000 to 2009
2611990 to 1999
304Before 1990
Major facilities with environmental interests located in this zip code:
NOVEON, INC. (7701 TRADEPORT DR in LOUISVILLE, KY)
HAZARDOUS WASTE BIENNIAL REPORTER (Resource Conservation and Recovery Act (tracking hazardous waste)) - ICIS-, ENFORCEMENT/COMPLIANCE ACTIVITY Large Quantity Generators, more that 1000 kg of hazardous waste/month (Resource Conservation and Recovery Act (tracking hazardous waste)) - notification - ICIS-, ENFORCEMENT/COMPLIANCE ACTIVITY Organizations: NOVEON INC (CONTACT/OPERATOR)
Alternative names: NOVEON INC (USCO WAREHOUSE)
MARATHON PETROLEUM CO LLC LOUISVILLE CANE RUN TERMINA (8600 CANE RUN ROAD in LOUISVILLE, KY)
AIR MINOR (AIRS/AFS) OIL CONTROL (Facility Response Plan for oil discharge) National Pollutant Discharge Elimination System NON-MAJOR (Tracking pollutant discharge elimination systems) - permit Conditionally Exempt Small Quantity Generators, less than 100 kg/month of hazardous waste (Resource Conservation and Recovery Act (tracking hazardous waste)) - notification (Resource Conservation and Recovery Act (tracking hazardous waste)) TRI REPORTER (Tracking of toxic chemicals releasing facilities) Business SIC classification: ASPHALT PAVING MIXTURES AND BLOCKS; PETROLEUM BULK STATIONS AND TERMINALS Business NAICS classification: ASPHALT PAVING MIXTURE AND BLOCK MANUFACTURING. Organizations: MARATHON-ASHLAND PETROLEUM, LL (CONTACT/GENERAL)
, MARATHON OIL COMPANY (CONTACT/OWNER)
, LOUISVILLE KY ASPHALT TERMINAL (CONTACT/OWNER)
Alternative names: LOUISVILLE ASPHALT TERMINAL , LOUISVILLE KENTUCKY ASPHALT TERMINAL, MARATHON ASHLAND PETROLEUM LLC, MARATHON ASPHALT, MARATHON OIL COMPANY, MARATHON OIL CO.LOUISVILLE CANE RUN
PLEASURE RIDGE PARK HIGH SCHOOL (5901 GREENWOOD ROAD in LOUISVILLE, KY)
(National Center for Education Statistics) - STATE ID-056275075 (Resource Conservation and Recovery Act (tracking hazardous waste)) Organizations: JEFFERSON CO. BOARD OF EDUCATION (CONTACT/OWNER)
, JEFFERSON COUNTY (SCHOOL DISTRICT)
ALGOOD FOOD CO (7401 TRADE PORT DR in LOUISVILLE, KY)
AIR MINOR (AIRS/AFS) National Pollutant Discharge Elimination System NON-MAJOR (Tracking pollutant discharge elimination systems) - permit Conditionally Exempt Small Quantity Generators, less than 100 kg/month of hazardous waste (Resource Conservation and Recovery Act (tracking hazardous waste)) Business SIC classification: FOOD PREPARATIONS Business NAICS classification: ROASTED NUTS AND PEANUT BUTTER MANUFACTURING. Organizations: ALGOOD FOOD COMPANY (CONTACT/OPERATOR)
, CECIL C. BARNETT (CONTACT/OWNER)
CONWAY MIDDLE SCHOOL (6300 TERRY ROAD in LOUISVILLE, KY)
(National Center for Education Statistics) - STATE ID-056275164 Organizations: JEFFERSON COUNTY (SCHOOL DISTRICT)
BOHN FIBERGLASS INDUSTRIES INC (7100 DISTRIBUTION DRIVE in LOUISVILLE, KY)
AIR SYNTHETIC MINOR (AIRS/AFS) COMPLIANCE ACTIVITY (Tracking inspections of insecticide, fungicide, and rodenticide, and toxic substances) CRITERIA AND HAZARDOUS AIR POLLUTANT INVENTORY (Inventory of air pollution sources) National Pollutant Discharge Elimination System NON-MAJOR (Tracking pollutant discharge elimination systems) - permit TRI REPORTER (Tracking of toxic chemicals releasing facilities) Business SIC classification: HOUSEHOLD FURNITURE; PLASTICS PRODUCTS
LIVINGSTON HEALTCARE SERVICES INCORPORATED (8001 CANE RUN ROAD in LOUISVILLE, KY)
(Integrated Compliance Information System) - ICIS-04-2002-2017, FORMAL ENFORCEMENT ACTION Business SIC classification: LOCAL TRUCKING WITH STORAGE; GENERAL WAREHOUSING AND STORAGE
ALLIED READY MIX CO INC (7510 CANE RUN RD in LOUISVILLE, KY)
COMPLIANCE ACTIVITY (Tracking inspections of insecticide, fungicide, and rodenticide, and toxic substances) National Pollutant Discharge Elimination System NON-MAJOR (Tracking pollutant discharge elimination systems) - permit Business SIC classification: READY-MIXED CONCRETE Alternative names: ALLIED READY MIX, INC. - PLANT 5
ANSON INDUSTRIES LLC (7601 PORT ROAD in LOUISVILLE, KY)
AIR SYNTHETIC MINOR (AIRS/AFS) (Resource Conservation and Recovery Act (tracking hazardous waste)) Business SIC classification: SPECIAL DIES AND TOOLS, DIE SETS, JIGS AND FIXTURES, AND INDUSTRIAL MOLDS Business NAICS classification: ALL OTHER MISCELLANEOUS FABRICATED METAL PRODUCT MANUFACTURING.; SPECIAL DIE AND TOOL, DIE SET, JIG, AND FIXTURE MANUFACTURING. Organizations: JOHN & PAMELA ANSON (CONTACT/OWNER)
, JOHN ANSON (CONTACT/OWNER)
ANSON INDUSTRIES, LLC (7611 PORT RD in LOUISVILLE, KY)
(Resource Conservation and Recovery Act (tracking hazardous waste)) Business NAICS classification: ALL OTHER MISCELLANEOUS FABRICATED METAL PRODUCT MANUFACTURING.; SPECIAL DIE AND TOOL, DIE SET, JIG, AND FIXTURE MANUFACTURING. Organizations: N/A (CONTACT/OPERATOR)
, JOHN R. ANSON (CONTACT/OWNER)
Alternative names: ANSON STAMPING CO
MEAN'S BARBER SHOP (2929 WILSON AVENUE in LOUISVILLE, KY)
(Resource Conservation and Recovery Act (tracking hazardous waste)) Organizations: GESSANE MEANS (CONTACT/OWNER)
BP OIL COMPANY (5115 GREENWOOD RD in LOUISVILLE, KY)
(Resource Conservation and Recovery Act (tracking hazardous waste)) Organizations: KIEL BROS. OIL COMPANY (CONTACT/OWNER)
BP OIL COMPANY (7733 DIXIE HWY in LOUISVILLE, KY)
(Resource Conservation and Recovery Act (tracking hazardous waste)) Organizations: KIEL BROS. OIL COMPANY (CONTACT/OWNER)
Housing units lacking complete plumbing facilities: 0.3% Housing units lacking complete kitchen facilities: 3.0%
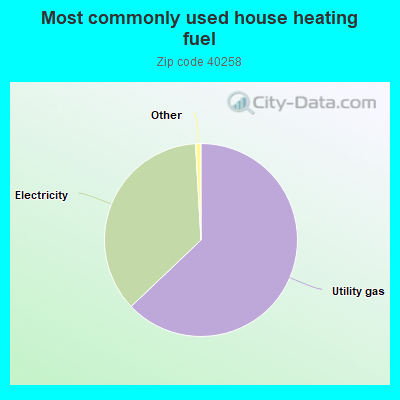
62.9%Utility gas
36.2%Electricity
Population in 1990: 24,515.
Place of birth for U.S.-born residents:
This state: 21,130
Northeast: 276
Midwest: 1,746
South: 1,621
West: 359
60% of the 40258 zip code residents lived in the same house 5 years ago. Out of people who lived in different houses, 84% lived in this county. Out of people who lived in different counties, 50% lived in Kentucky.
92% of the 40258 zip code residents lived in the same house 1 year ago. Out of people who lived in different houses, 77% moved from this county. Out of people who lived in different houses, 2% moved from different county within same state. Out of people who lived in different houses, 12% moved from different state. Out of people who lived in different houses, 8% moved from abroad.
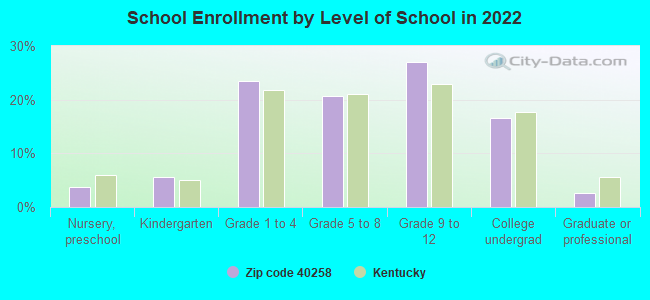
Private vs. public school enrollment:
Students in private schools in grades 1 to 8 (elementary and middle school): 441
Here:
14.9%
Kentucky:
17.2%
Students in private schools in grades 9 to 12 (high school): 354
Here:
19.5%
Kentucky:
15.2%
Students in private undergraduate colleges: 267
Here:
23.8%
Kentucky:
19.6%
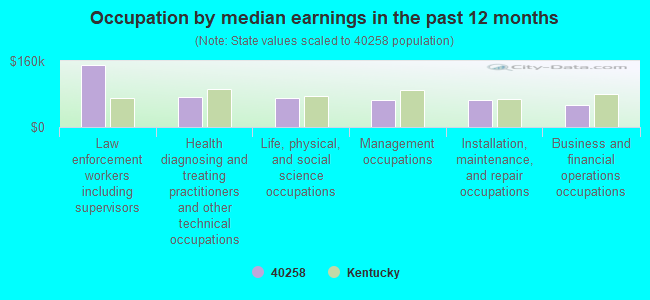
Occupation by median earnings in the past 12 months ($)
149,450Law enforcement workers including supervisors
71,613Health diagnosing and treating practitioners and other technical occupations
70,539Life, physical, and social science occupations
66,481Management occupations
64,470Installation, maintenance, and repair occupations
53,408Business and financial operations occupations
Companies with federal contracts located in this zip code:
SCOTT INDUSTRIES OF KENTUCKY L (6701 CANE RUN RD in LOUISVILLE, KY; small business) : $52,307 in 3 contractsfrom 2005 to 2006
$29,940 with Army for Plastics Fabricated Materials. Signed on 2005-07-25. Completion date: 2005-10-03.
$22,367 with Army for Plastics Fabricated Materials. Taking place in IN. Signed on 2006-02-23. Completion date: 2006-05-30.
$0, same as above.Signed on 2006-02-23. Completion date: 2006-05-30.
Top industries in this zip code by the number of employees in 2005:
Administrative and Support and Waste Management and Remediation Services: Temporary Help Services (250-499 employees: 1 establishment, 100-249 employees: 3 establishments, 50-99 employees: 1 establishment)
2006 - 2018 National Fire Incident Reporting System (NFIRS) incidents
According to the data from the years 2006 - 2018 the average number of fire incidents per year is 78. The highest number of reported fire incidents - 154 took place in 2011, and the least - 3 in 2008. The data has a decreasing trend.
When looking into fire subcategories, the most reports belonged to: Outside Fires (44.5%), and Structure Fires (36.3%).
Fire incident types reported to NFIRS in Zip Code 40258


 Nearest zip codes: 40216, 40272, 40214, 47117, 40215, 40211.


 According to the data from the years 2006 - 2018 the average number of fire incidents per year is 78. The highest number of reported fire incidents - 154 took place in 2011, and the least - 3 in 2008. The data has a decreasing trend.
 When looking into fire subcategories, the most reports belonged to: Outside Fires (44.5%), and Structure Fires (36.3%).