Estimated zip code population in 2022: 7,139 Zip code population in 2010: 7,080 Zip code population in 2000: 6,869
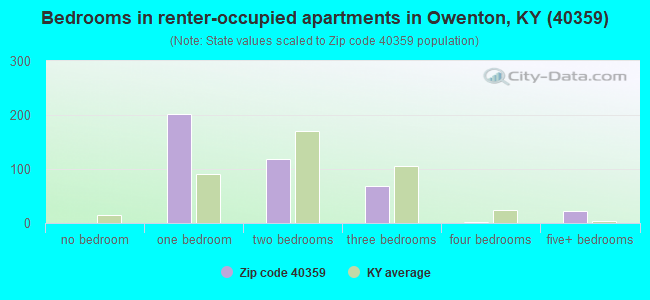
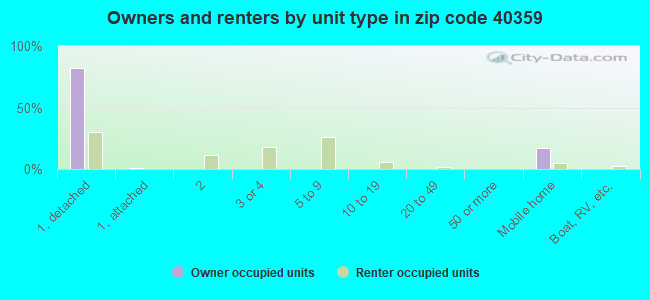
Houses and condos: 3,362 Renter-occupied apartments: 398
% of renters here:
15%
State:
31%
March 2022 cost of living index in zip code 40359: 81.0 (low, U.S. average is 100)
Land area: 228.7 sq. mi. Water area: 1.8 sq. mi.
Population density: 31 people per square mile
(very low).
OSM Map
General Map
Google Map
MSN Map
OSM Map
General Map
Google Map
MSN Map
OSM Map
General Map
Google Map
MSN Map
OSM Map
General Map
Google Map
MSN Map
Please wait while loading the map...
Real estate property taxes paid for housing units in 2022:
This zip code:
0.6% ($1,065)
Kentucky:
0.7% ($1,456)
Median real estate property taxes paid for housing units with mortgages in 2022: $1,246 (0.7%) Median real estate property taxes paid for housing units with no mortgage in 2022: $924 (0.7%)
Business Search- 14 Million verified businesses
Males: 3,510
(49.2%)
Females: 3,629
(50.8%)
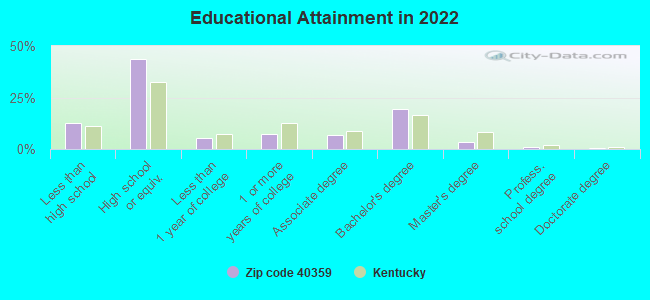
For population 25 years and over in 40359:
High school or higher: 86.6%
Bachelor's degree or higher: 24.0%
Graduate or professional degree: 4.8%
Unemployed: 4.3%
Mean travel time to work (commute): 35.7 minutes
For population 15 years and over in 40359:
Never married: 24.9%
Now married: 54.9%
Separated: 1.1%
Widowed: 6.7%
Divorced: 12.4%
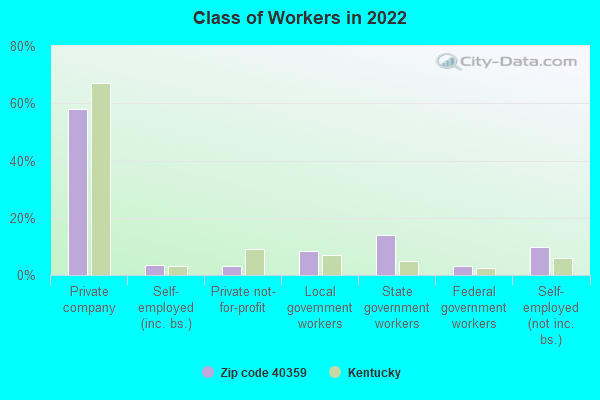
Zip code 40359 compared to state average:
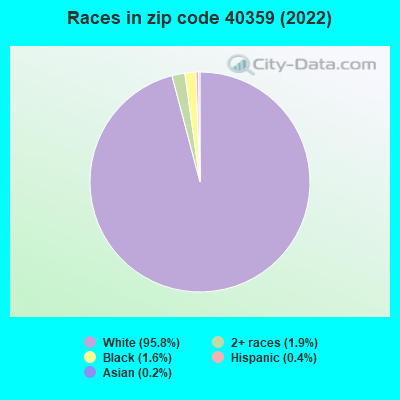
Black race population percentage significantly below state average.
Hispanic race population percentage significantly below state average.
Foreign-born population percentage significantly below state average.
Renting percentage below state average.
Length of stay since moving in above state average.
Averages for the 2020 tax year for zip code 40359, filed in 2021:
Average Adjusted Gross Income (AGI) in 2020: $51,263 (Individual Income Tax Returns)
Here:
$51,263
State:
$61,342
Salary/wage: $45,002 (reported on 81.8% of returns)
Here:
$45,002
State:
$50,827
(% of AGI for various income ranges: 1106.2% for AGIs below $25k, 3433.6% for AGIs $25k-50k, 5837.6% for AGIs $50k-75k, 9058.6% for AGIs $75k-100k, 15725.0% for AGIs $100k-200k, 46705.0% for AGIs over 200k)
Taxable interest for individuals: $1,009 (reported on 26.1% of returns)
This zip code:
$1,009
Kentucky:
$1,441
(% of AGI for various income ranges: 19.4% for AGIs below $25k, 13.2% for AGIs $25k-50k, 59.1% for AGIs $50k-75k, 43.6% for AGIs $75k-100k, 119.5% for AGIs $100k-200k, 115.0% for AGIs over 200k)
Ordinary dividends: $2,615 (reported on 8.9% of returns)
Here:
$2,615
State:
$7,388
(% of AGI for various income ranges: 6.8% for AGIs below $25k, 6.1% for AGIs $25k-50k, 38.8% for AGIs $50k-75k, 18.6% for AGIs $75k-100k, 101.0% for AGIs $100k-200k, 1200.0% for AGIs over 200k)
Net capital gain/loss in AGI: +$8,577 (reported on 8.6% of returns)
Here:
+$8,577
State:
+$19,475
(% of AGI for various income ranges: 14.7% for AGIs below $25k, 23.0% for AGIs $25k-50k, 23.0% for AGIs $50k-75k, 79.1% for AGIs $75k-100k, 296.0% for AGIs $100k-200k, 5585.0% for AGIs over 200k)
Profit/loss from business: +$6,198 (reported on 16.2% of returns)
Here:
+$6,198
State:
+$11,386
(% of AGI for various income ranges: 120.0% for AGIs below $25k, 104.7% for AGIs $25k-50k, 59.4% for AGIs $50k-75k, 234.1% for AGIs $75k-100k, 331.5% for AGIs $100k-200k)
Taxable individual retirement arrangement distribution: $20,289 (reported on 5.9% of returns)
40359:
$20,289
Kentucky:
$18,941
(% of AGI for various income ranges: 34.2% for AGIs below $25k, 72.0% for AGIs $25k-50k, 152.7% for AGIs $50k-75k, 141.8% for AGIs $75k-100k, 1042.0% for AGIs $100k-200k)
Total itemized deductions: $31,067 (reported on 3.0% of returns)
Here:
$31,067
State:
$32,473
(% of AGI for various income ranges: 267.3% for AGIs $50k-75k, 957.0% for AGIs $100k-200k)
Charity contributions: $12,188 (reported on 2.6% of returns)
Here:
$12,188
State:
$13,472
(% of AGI for various income ranges: 70.6% for AGIs $50k-75k, 371.0% for AGIs $100k-200k)
Taxes paid: $7,711 (reported on 3.0% of returns)
40359:
$7,711
State:
$7,830
(% of AGI for various income ranges: 60.6% for AGIs $50k-75k, 247.0% for AGIs $100k-200k)
Earned income credit: $2,433 (reported on 21.8% of returns)
Here:
$2,433
State:
$2,336
(% of AGI for various income ranges: 126.2% for AGIs below $25k, 88.5% for AGIs $25k-50k)
Percentage of individuals using paid preparers for their 2020 taxes: 95.0%
Here:
95%
State:
94%
(% for various income ranges: 94.5% for AGIs below $25k, 96.3% for AGIs $25k-50k, 95.5% for AGIs $50k-75k, 93.3% for AGIs $75k-100k, 94.1% for AGIs $100k-200k, 100.0% for AGIs over 200k)
Averages for the 2012 tax year for zip code 40359, filed in 2013:
Average Adjusted Gross Income (AGI) in 2012: $41,307 (Individual Income Tax Returns)
Here:
$41,307
State:
$50,814
Salary/wage: $37,659 (reported on 81.8% of returns)
Here:
$37,659
State:
$42,723
(% of AGI for various income ranges: 70.1% for AGIs below $25k, 79.0% for AGIs $25k-50k, 77.1% for AGIs $50k-75k, 76.5% for AGIs $75k-100k, 68.6% for AGIs $100k-200k)
Taxable interest for individuals: $1,026 (reported on 30.0% of returns)
This zip code:
$1,026
Kentucky:
$1,381
(% of AGI for various income ranges: 1.4% for AGIs below $25k, 0.8% for AGIs $25k-50k, 0.3% for AGIs $50k-75k, 0.8% for AGIs $75k-100k, 0.7% for AGIs $100k-200k)
Ordinary dividends: $1,604 (reported on 9.6% of returns)
Here:
$1,604
State:
$6,239
(% of AGI for various income ranges: 0.6% for AGIs below $25k, 0.2% for AGIs $25k-50k, 0.2% for AGIs $50k-75k, 0.2% for AGIs $75k-100k, 0.7% for AGIs $100k-200k)
Net capital gain/loss in AGI: +$4,138 (reported on 13.9% of returns)
Here:
+$4,138
State:
+$11,336
(% of AGI for various income ranges: 1.3% for AGIs below $25k, 1.4% for AGIs $25k-50k, 1.0% for AGIs $50k-75k, 0.4% for AGIs $75k-100k, 2.5% for AGIs $100k-200k)
Profit/loss from business: +$6,260 (reported on 18.6% of returns)
Here:
+$6,260
State:
+$10,862
(% of AGI for various income ranges: 10.3% for AGIs below $25k, 1.8% for AGIs $25k-50k, 2.1% for AGIs $50k-75k, 1.4% for AGIs $75k-100k, 1.5% for AGIs $100k-200k)
Taxable individual retirement arrangement distribution: $15,567 (reported on 6.4% of returns)
40359:
$15,567
Kentucky:
$14,296
(% of AGI for various income ranges: 2.4% for AGIs below $25k, 1.5% for AGIs $25k-50k, 1.0% for AGIs $50k-75k, 2.1% for AGIs $75k-100k, 5.1% for AGIs $100k-200k)
Total itemized deductions: $17,048 (23% of AGI, reported on 24.6% of returns)
Here:
$17,048
State:
$21,160
Here:
22.8% of AGI
State:
20.0% of AGI
(% of AGI for various income ranges: 7.1% for AGIs below $25k, 7.2% for AGIs $25k-50k, 9.7% for AGIs $50k-75k, 12.5% for AGIs $75k-100k, 13.4% for AGIs $100k-200k)
Charity contributions: $3,376 (reported on 19.6% of returns)
Here:
$3,376
State:
$4,303
(% of AGI for various income ranges: 0.9% for AGIs below $25k, 1.0% for AGIs $25k-50k, 1.2% for AGIs $50k-75k, 2.0% for AGIs $75k-100k, 2.7% for AGIs $100k-200k)
Taxes paid: $5,874 (reported on 24.6% of returns)
40359:
$5,874
State:
$8,496
(% of AGI for various income ranges: 1.1% for AGIs below $25k, 1.8% for AGIs $25k-50k, 3.0% for AGIs $50k-75k, 4.8% for AGIs $75k-100k, 6.0% for AGIs $100k-200k)
Earned income credit: $2,323 (reported on 24.6% of returns)
Here:
$2,323
State:
$2,273
(% of AGI for various income ranges: 8.0% for AGIs below $25k, 1.5% for AGIs $25k-50k)
Percentage of individuals using paid preparers for their 2012 taxes: 77.5%
Here:
78%
State:
60%
(% for various income ranges: 75.0% for AGIs below $25k, 78.4% for AGIs $25k-50k, 79.1% for AGIs $50k-75k, 83.3% for AGIs $75k-100k, 78.9% for AGIs $100k-200k)
Averages for the 2004 tax year for zip code 40359, filed in 2005:
Average Adjusted Gross Income (AGI) in 2004: $34,100 (Individual Income Tax Returns)
Here:
$34,100
State:
$41,540
Salary/wage: $32,337 (reported on 83.9% of returns)
Here:
$32,337
State:
$36,432
(% of AGI for various income ranges: 102.8% for AGIs below $10k, 77.4% for AGIs $10k-25k, 81.5% for AGIs $25k-50k, 84.1% for AGIs $50k-75k, 81.6% for AGIs $75k-100k, 66.0% for AGIs over 100k)
Taxable interest for individuals: $1,423 (reported on 37.6% of returns)
This zip code:
$1,423
Kentucky:
$1,571
(% of AGI for various income ranges: 6.5% for AGIs below $10k, 2.9% for AGIs $10k-25k, 1.1% for AGIs $25k-50k, 1.0% for AGIs $50k-75k, 1.0% for AGIs $75k-100k, 1.8% for AGIs over 100k)
Taxable dividends: $1,414 (reported on 11.2% of returns)
Here:
$1,414
State:
$3,453
(% of AGI for various income ranges: 1.0% for AGIs below $10k, 0.3% for AGIs $10k-25k, 0.3% for AGIs $25k-50k, 0.2% for AGIs $50k-75k, 0.5% for AGIs $75k-100k, 1.2% for AGIs over 100k)
Net capital gain/loss: +$10,326 (reported on 9.8% of returns)
Here:
+$10,326
State:
+$9,663
(% of AGI for various income ranges: -0.6% for AGIs below $10k, 0.8% for AGIs $10k-25k, 0.8% for AGIs $25k-50k, 1.5% for AGIs $50k-75k, 2.9% for AGIs $75k-100k, 11.4% for AGIs over 100k)
Profit/loss from business: +$6,090 (reported on 18.1% of returns)
Here:
+$6,090
State:
+$9,233
(% of AGI for various income ranges: 11.1% for AGIs below $10k, 6.1% for AGIs $10k-25k, 3.3% for AGIs $25k-50k, 0.5% for AGIs $50k-75k, 0.5% for AGIs $75k-100k, 6.1% for AGIs over 100k)
IRA payment deduction: $2,444 (reported on 1.2% of returns)
40359:
$2,444
Kentucky:
$2,955
Total itemized deductions: $14,495 (24% of AGI, reported on 26.4% of returns)
Here:
$14,495
State:
$17,474
Here:
23.6% of AGI
State:
21.0% of AGI
(% of AGI for various income ranges: 14.9% for AGIs below $10k, 6.8% for AGIs $10k-25k, 9.6% for AGIs $25k-50k, 11.4% for AGIs $50k-75k, 13.3% for AGIs $75k-100k, 14.9% for AGIs over 100k)
Charity contributions deductions: $3,085 (5% of AGI, reported on 20.3% of returns)
Here:
$3,085
State:
$3,494
Here:
4.7% of AGI
State:
4.0% of AGI
(% of AGI for various income ranges: 1.1% for AGIs below $10k, 0.7% for AGIs $10k-25k, 1.3% for AGIs $25k-50k, 1.8% for AGIs $50k-75k, 2.4% for AGIs $75k-100k, 3.4% for AGIs over 100k)
Total tax: $4,037 (reported on 71.7% of returns)
40359:
$4,037
State:
$6,162
(% of AGI for various income ranges: 3.7% for AGIs below $10k, 4.1% for AGIs $10k-25k, 6.6% for AGIs $25k-50k, 8.5% for AGIs $50k-75k, 10.1% for AGIs $75k-100k, 14.8% for AGIs over 100k)
Earned income credit: $1,780 (reported on 21.3% of returns)
Here:
$1,780
State:
$1,723
Percentage of individuals using paid preparers for their 2004 taxes: 77.5%
Here:
78%
State:
66%
(% for various income ranges: 71.3% for AGIs below $10k, 79.7% for AGIs $10k-25k, 80.7% for AGIs $25k-50k, 80.6% for AGIs $50k-75k, 74.3% for AGIs $75k-100k, 71.3% for AGIs over 100k)
Likely homosexual households (counted as self-reported same-sex unmarried-partner households)
Lesbian couples: 0.2% of all households
Gay men: 0.0% of all households
Household received Food Stamps/SNAP in the past 12 months: 338 Household did not receive Food Stamps/SNAP in the past 12 months: 2,319
Women who had a birth in the past 12 months: 78 (18 now married, 61 unmarried) Women who did not have a birth in the past 12 months: 1,443 (883 now married, 565 unmarried)
Housing units in zip code 40359 with a mortgage: 1,145 (126 second mortgage, 103 both second mortgage and home equity loan) Houses without a mortgage: 86
Median monthly owner costs for units with a mortgage: $1,286 Median monthly owner costs for units without a mortgage: $418
Residents with income below the poverty level in 2022:
This zip code:
14.1%
Whole state:
16.5%
Residents with income below 50% of the poverty level in 2022:
This zip code:
8.2%
Whole state:
9.0%
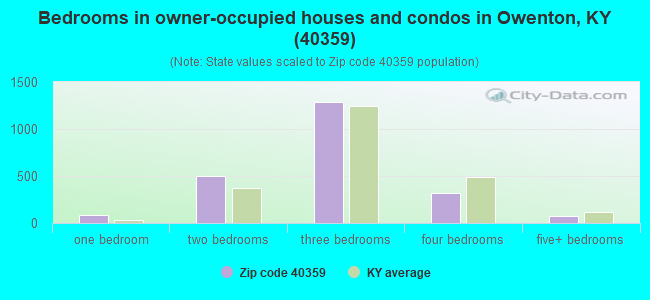
Median number of rooms in houses and condos:
Here:
6.1
State:
6.4
Median number of rooms in apartments:
Here:
4.1
State:
4.4
Notable locations in this zip code not listed on our city pages
Notable locations in zip code 40359: Owenton Volunteer Fire Department (A), Monterey Volunteer Fire Department (B), South Owen Volunteer Fire Department (C), Owen County Life Squad (D). Display/hide their locations on the map
Churches in zip code 40359 include: Greenup Fork Church (A), Locust Grove Church (B), Mount Carmel Church (C), Mount Hebron Baptist Church (D), Mount Zion Church (E), Musselshoals Church (F), Old Cedar Church (G), Pleasant Ridge Church (H), Richland Baptist Church (I). Display/hide their locations on the map
Cemeteries: Thomas Cemetery (1), Yancey Cemetery (2), Grugin Cemetery (3), Jones Cemetery (4), Lusby/Kemper Cemetery (5), Hancock Cemetery (6), Handcock Cemetery (7). Display/hide their locations on the map
Streams, rivers, and creeks: Sand Lick Branch (A), Balls Branch (B), Dickey Fork (C), Bowen Branch (D), Brammell Branch (E), Coxs Branch (F), Clay Lick Creek (G), Cedar Creek (H), Cave Spring Branch (I). Display/hide their locations on the map
1,213 married couples with children.
197 single-parent households (77 men, 120 women).
98.5% of residents of 40359 zip code speak English at home.
1.3% of residents speak Spanish at home (48% very well, 22% well, 29% not well).
0.2% of residents speak other Indo-European language at home (100% very well).
0.1% of residents speak other language at home (100% not well).
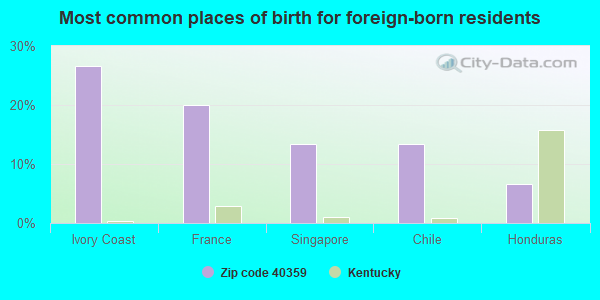
Foreign born population: 15 (0.2%) (87.6% of them are naturalized citizens)
This zip code:
0.2%
Whole state:
4.0%
27%Ivory Coast
20%France
13%Singapore
13%Chile
7%Honduras
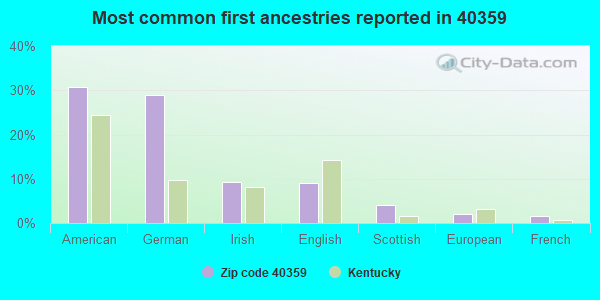
31%American
29%German
9%Irish
9%English
4%Scottish
2%European
2%French
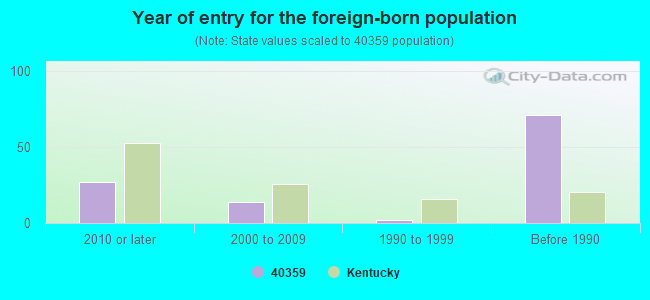
Year of entry for the foreign-born population
272010 or later
142000 to 2009
21990 to 1999
71Before 1990
Major facilities with environmental interests located in this zip code:
ACTARIS US GAS INCORPORATED (970 HIGHWAY 127 NORTH in OWENTON, KY)
AIR MAJOR (AIRS/AFS) AIR SYNTHETIC MINOR (AIRS/AFS) CRITERIA AND HAZARDOUS AIR POLLUTANT INVENTORY (Inventory of air pollution sources) National Pollutant Discharge Elimination System NON-MAJOR (Tracking pollutant discharge elimination systems) - permit Small Quantity Generators, between 100 kg and 1000 kg of hazardous waste/month (Resource Conservation and Recovery Act (tracking hazardous waste)) - notification TRI REPORTER (Tracking of toxic chemicals releasing facilities) Business SIC classification: FABRICATED METAL PRODUCTS; TOTALIZING FLUID METERS AND COUNTING DEVICES; MEASURING AND CONTROLLING DEVICES Business NAICS classification: TOTALIZING FLUID METER AND COUNTING DEVICE MANUFACTURING.; OTHER MEASURING AND CONTROLLING DEVICE MANUFACTURING.; ALL OTHER MISCELLANEOUS MANUFACTURING. Organizations: ACTARIS U.S. GAS INC. (CONTACT/OWNER)
Alternative names: ACTARIS U.S. GAS INC., SCHLUMBERGER INDUSTRIES, SCHLUMBERGER RESORCE MANAGEMENT SERV, SCHLUMBERGER RESOURCE MGT, SCHLUMBERGER RMS
BOWLING MIDDLE SCHOOL (1960 HWY 22 E in OWENTON, KY)
(National Center for Education Statistics) - STATE ID-094471078 Organizations: OWEN COUNTY (SCHOOL DISTRICT)
OWEN COUNTY ELEMENTARY SCHOOL (1945 HWY 22 E in OWENTON, KY)
(National Center for Education Statistics) - STATE ID-094471075
OWEN COUNTY HIGH SCHOOL (2043 HWY 22 E in OWENTON, KY)
(National Center for Education Statistics) - STATE ID-094471080
OWEN COUNTY PRIMARY ELEMENTARY SCHOOL (1925 HIGHWAY 22 EAST in OWENTON, KY)
(National Center for Education Statistics) - STATE ID-094471020
OWENTON WWTP (JCT ADAMS DR & CARTER DR in OWENTON, KY)
(Integrated Compliance Information System) - ICIS-04-1987-0020, FORMAL ENFORCEMENT ACTION Business SIC classification: SEWERAGE SYSTEMS
KYDOH ITEM NO. 6-356.00 (INTERSECTION OF 227 & 22 in OWENTON, KY)
(Resource Conservation and Recovery Act (tracking hazardous waste)) Organizations: N/A (CONTACT/OPERATOR)
, ASHLAND PTROLEUM CO. (CONTACT/OWNER)
, KYDOH DIV. OF ENVIRO. ANALYSIS (CONTACT/OWNER)
Alternative names: ASHLAND PETROLEUM CO. #460-000
CEDAR RIDGE MHP (7955-8275 HWY 22 E in OWENTON, KY)
National Pollutant Discharge Elimination System NON-MAJOR (Tracking pollutant discharge elimination systems) - permit Business SIC classification: OPERATORS OF RESIDENTIAL MOBILE HOME SITES
OWEN COUNTY COURTHOUSE (COURTHOUSE SQUARE in OWENTON, KY)
(Resource Conservation and Recovery Act (tracking hazardous waste)) Organizations: COUNTY OF OWEN (CONTACT/OWNER)
OWEN COUNTY RURAL ELECTRIC COOP. (RURAL ROUTE 5 in OWENTON, KY)
(Resource Conservation and Recovery Act (tracking hazardous waste))
OWEN ELECTRIC COOP INC HDQTRS (8205 HWY 127 N in OWENTON, KY)
National Pollutant Discharge Elimination System NON-MAJOR (Tracking pollutant discharge elimination systems) - permit Business SIC classification: ELECTRIC SERVICES Alternative names: OWEN ELECTRIC COOPERATIVE INC
FOREIGN AUTO SALVAGE INC (5655 HWY 22 EAST in SWEET OWEN, KY)
National Pollutant Discharge Elimination System NON-MAJOR (Tracking pollutant discharge elimination systems) - permit Business SIC classification: MOTOR VEHICLE PARTS, USED
KTC OWEN CO MAINT GAR SITE (HARRIS RIDGE RD in OWENTON, KY)
National Pollutant Discharge Elimination System NON-MAJOR (Tracking pollutant discharge elimination systems) - permit Business SIC classification: TERMINAL AND SERVICE FACILITIES FOR MOTOR VEHICLE PASSENGER TRANSPORTATION
Housing units lacking complete plumbing facilities: 4.9% Housing units lacking complete kitchen facilities: 6.2%
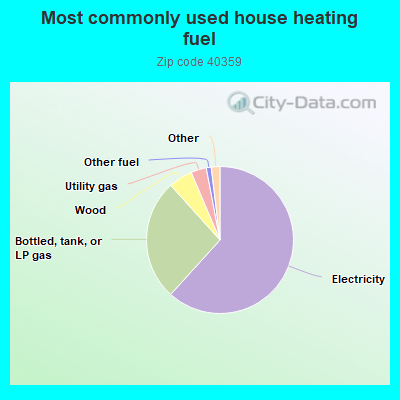
61.9%Electricity
26.7%Bottled, tank, or LP gas
5.3%Wood
3.4%Utility gas
1.1%Other fuel
0.9%Solar energy
0.8%No fuel used
Population in 1990: 6,326. Population change in the 1990s: +543 (+8.6%).
Place of birth for U.S.-born residents:
This state: 5,387
Northeast: 55
Midwest: 1,013
South: 402
West: 133
57% of the 40359 zip code residents lived in the same house 5 years ago. Out of people who lived in different houses, 54% lived in this county. Out of people who lived in different counties, 50% lived in Kentucky.
87% of the 40359 zip code residents lived in the same house 1 year ago. Out of people who lived in different houses, 38% moved from this county. Out of people who lived in different houses, 58% moved from different county within same state. Out of people who lived in different houses, 1% moved from different state.
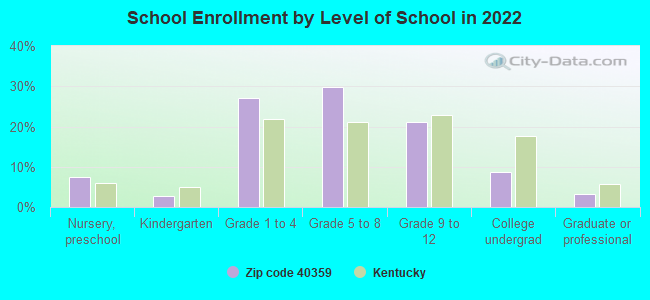
Private vs. public school enrollment:
Students in private schools in grades 1 to 8 (elementary and middle school): 93
Here:
12.0%
Kentucky:
17.2%
Students in private schools in grades 9 to 12 (high school): 61
Here:
21.3%
Kentucky:
15.2%
Students in private undergraduate colleges: 15
Here:
13.3%
Kentucky:
19.6%
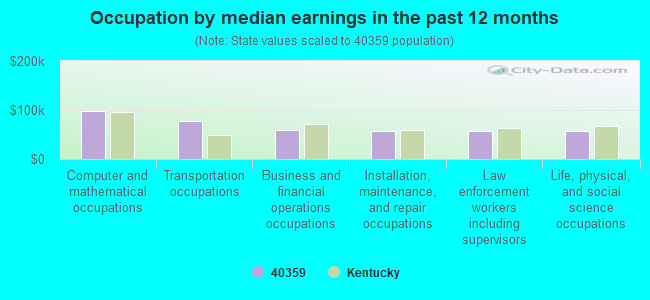
Occupation by median earnings in the past 12 months ($)
98,005Computer and mathematical occupations
77,757Transportation occupations
60,132Business and financial operations occupations
57,940Installation, maintenance, and repair occupations
57,706Law enforcement workers including supervisors
56,332Life, physical, and social science occupations
Top industries in this zip code by the number of employees in 2005:
Health Care and Social Assistance: General Medical and Surgical Hospitals (100-249 employees: 1 establishment)
Utilities: Electric Power Distribution (50-99: 1, 20-49: 1)
Health Care and Social Assistance: Nursing Care Facilities (50-99: 1)
Finance and Insurance: Commercial Banking (20-49: 2, 1-4: 1)
Other Services (except Public Administration): Religious Organizations (10-19: 1, 5-9: 1, 1-4: 8)
Health Care and Social Assistance: Residential Mental Retardation Facilities (20-49: 1)
People in group quarters in 2000:
101 people in nursing homes
9 people in hospitals/wards and hospices for chronically ill
9 people in other hospitals or wards for chronically ill
Fatal accident statistics in 2014:
Fatal accident count: 1
Vehicles involved in fatal accidents: 1
Fatal accidents caused by drunken drivers: 1
Fatalities: 1
Persons involved in fatal accidents: 2
Pedestrians involved in fatal accidents: 0
Fatal accident statistics in 2013:
Fatal accident count: 2
Vehicles involved in fatal accidents: 3
Fatal accidents caused by drunken drivers: 0
Fatalities: 3
Persons involved in fatal accidents: 6
Pedestrians involved in fatal accidents: 0
2002 - 2018 National Fire Incident Reporting System (NFIRS) incidents
Based on the data from the years 2002 - 2018 the average number of fires per year is 70. The highest number of reported fire incidents - 141 took place in 2011, and the least - 22 in 2009. The data has a rising trend.
When looking into fire subcategories, the most reports belonged to: Structure Fires (55.6%), and Outside Fires (29.1%).
Fire incident types reported to NFIRS in Zip Code 40359

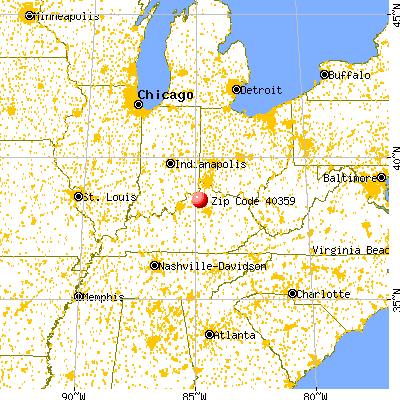


 Nearest zip codes: 41052, 41010, 40036, 40007, 40363, 41086.


 Based on the data from the years 2002 - 2018 the average number of fires per year is 70. The highest number of reported fire incidents - 141 took place in 2011, and the least - 22 in 2009. The data has a rising trend.
 When looking into fire subcategories, the most reports belonged to: Structure Fires (55.6%), and Outside Fires (29.1%).