Estimated zip code population in 2022: 844 Zip code population in 2010: 1,122 Zip code population in 2000: 762
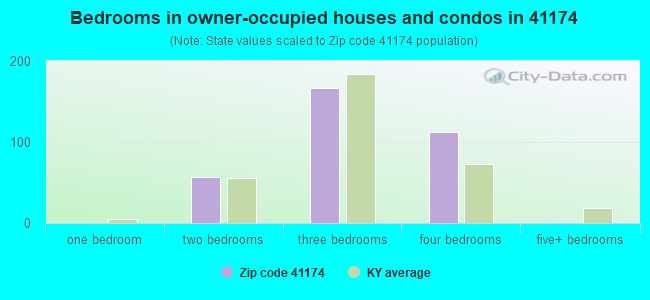
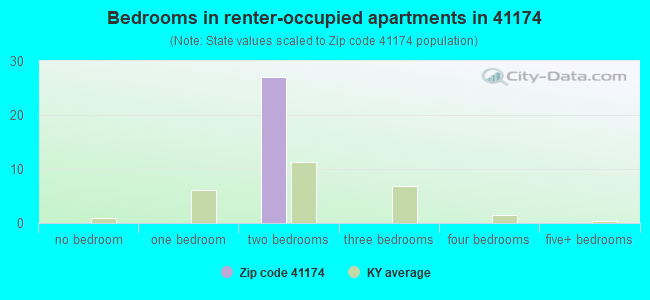
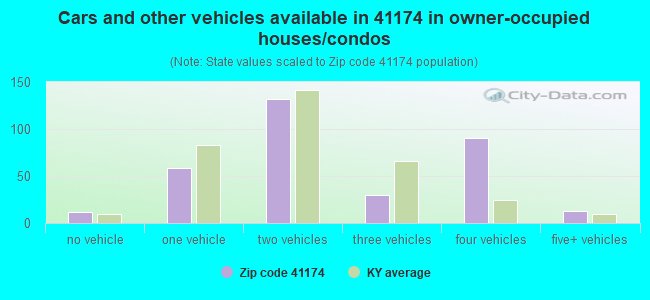
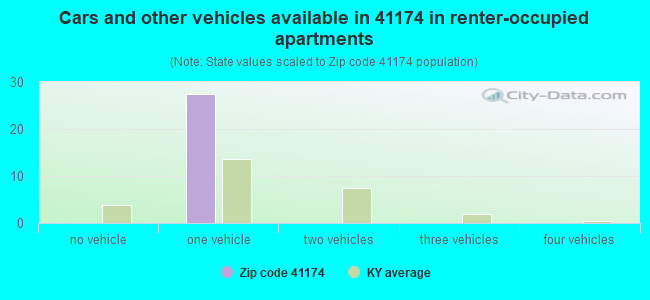
Houses and condos: 459 Renter-occupied apartments: 26
% of renters here:
7%
State:
31%
March 2022 cost of living index in zip code 41174: 78.5 (low, U.S. average is 100)
Land area: 10.1 sq. mi. Water area: 1.2 sq. mi.
Population density: 83 people per square mile
(very low).
OSM Map
General Map
Google Map
MSN Map
OSM Map
General Map
Google Map
MSN Map
OSM Map
General Map
Google Map
MSN Map
OSM Map
General Map
Google Map
MSN Map
Please wait while loading the map...
Real estate property taxes paid for housing units in 2022:
This zip code:
0.8% ($1,157)
Kentucky:
0.7% ($1,456)
Median real estate property taxes paid for housing units with mortgages in 2022: $1,401 (0.7%) Median real estate property taxes paid for housing units with no mortgage in 2022: $514 (0.5%)
Business Search- 14 Million verified businesses
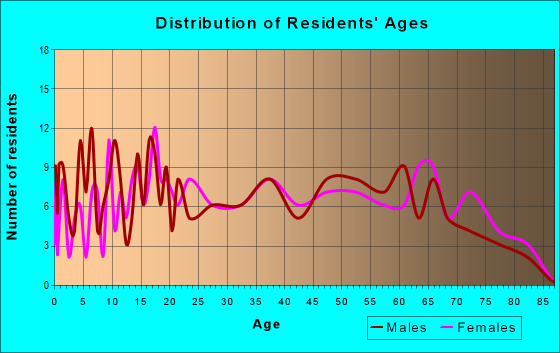
Males: 370
(43.9%)
Females: 474
(56.1%)
For population 25 years and over in 41174:
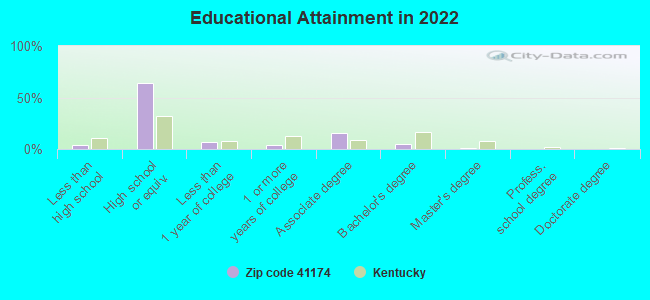
High school or higher: 95.6%
Bachelor's degree or higher: 5.6%
Graduate or professional degree: 0.6%
Unemployed: 8.2%
Mean travel time to work (commute): 24.8 minutes
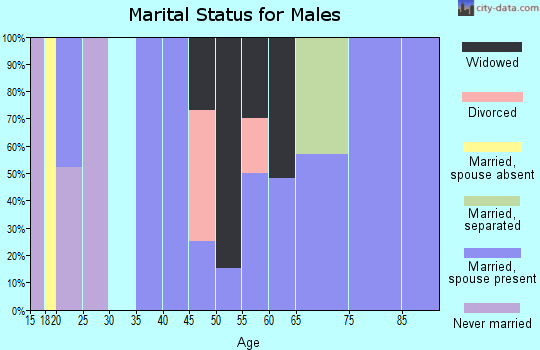
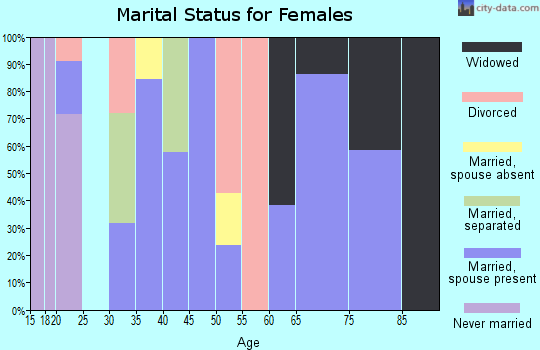
For population 15 years and over in 41174:
Never married: 12.5%
Now married: 76.1%
Separated: 3.0%
Widowed: 2.3%
Divorced: 6.1%
Zip code 41174 compared to state average:
Unemployed percentage above state average.
Black race population percentage significantly below state average.
Hispanic race population percentage significantly below state average.
Median age significantly above state average.
Foreign-born population percentage significantly below state average.
Renting percentage significantly below state average.
Length of stay since moving in significantly above state average.
Number of college students significantly below state average.
Percentage of population with a bachelor's degree or higher significantly below state average.
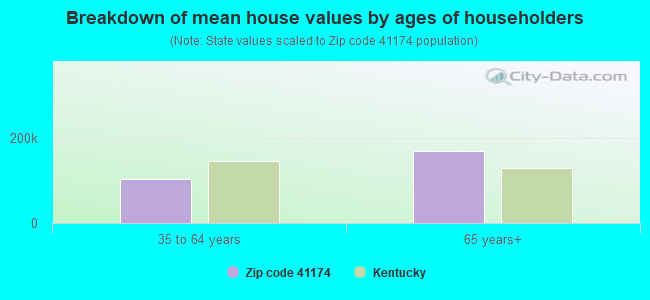
Estimated median house/condo value in 2022: $141,846
41174:
$141,846
Kentucky:
$196,300
According to our research of Kentucky and other state lists, there were 2 registered sex offenders living in 41174 zip code as of April 16, 2024. The ratio of all residents to sex offenders in zip code 41174 is 509 to 1. The ratio of registered sex offenders to all residents in this zip code is near the state average.
Median resident age:
This zip code:
49.3 years
Kentucky median age:
39.4 years
Average household size:
This zip code:
2.4 people
Kentucky:
2.4 people
Averages for the 2020 tax year for zip code 41174, filed in 2021:
Average Adjusted Gross Income (AGI) in 2020: $53,172 (Individual Income Tax Returns)
Here:
$53,172
State:
$61,342
Salary/wage: $42,618 (reported on 84.6% of returns)
Here:
$42,618
State:
$50,827
(% of AGI for various income ranges: 1196.0% for AGIs below $25k, 3091.2% for AGIs $25k-50k, 5860.0% for AGIs $50k-75k, 13385.0% for AGIs $75k-100k, 15960.0% for AGIs $100k-200k)
Taxable interest for individuals: $1,612 (reported on 20.5% of returns)
This zip code:
$1,612
Kentucky:
$1,441
(% of AGI for various income ranges: 16.2% for AGIs $25k-50k, 6.0% for AGIs $50k-75k, 376.7% for AGIs $100k-200k)
Profit/loss from business: +$2,340 (reported on 12.8% of returns)
Here:
+$2,340
State:
+$11,386
(% of AGI for various income ranges: 100.0% for AGIs below $25k, 34.0% for AGIs $50k-75k)
Taxable individual retirement arrangement distribution: $16,300 (reported on 5.1% of returns)
41174:
$16,300
Kentucky:
$18,941
(% of AGI for various income ranges: 326.0% for AGIs below $25k)
Earned income credit: $2,700 (reported on 20.5% of returns)
Here:
$2,700
State:
$2,336
(% of AGI for various income ranges: 139.0% for AGIs below $25k, 96.2% for AGIs $25k-50k)
Percentage of individuals using paid preparers for their 2020 taxes: 94.9%
Here:
95%
State:
94%
(% for various income ranges: 92.3% for AGIs below $25k, 100.0% for AGIs $25k-50k, 85.7% for AGIs $50k-75k, 100.0% for AGIs $75k-100k, 100.0% for AGIs $100k-200k)
Averages for the 2012 tax year for zip code 41174, filed in 2013:
Average Adjusted Gross Income (AGI) in 2012: $39,468 (Individual Income Tax Returns)
Here:
$39,468
State:
$50,814
Salary/wage: $36,118 (reported on 82.5% of returns)
Here:
$36,118
State:
$42,723
(% of AGI for various income ranges: 75.4% for AGIs below $25k, 69.6% for AGIs $25k-50k, 87.2% for AGIs $50k-75k, 77.6% for AGIs $75k-100k, 68.2% for AGIs $100k-200k)
Taxable interest for individuals: $400 (reported on 27.5% of returns)
This zip code:
$400
Kentucky:
$1,381
(% of AGI for various income ranges: 0.3% for AGIs below $25k, 0.7% for AGIs $25k-50k, 0.4% for AGIs $75k-100k)
Profit/loss from business: +$5,575 (reported on 10.0% of returns)
Here:
+$5,575
State:
+$10,862
Taxable individual retirement arrangement distribution: $8,550 (reported on 5.0% of returns)
41174:
$8,550
Kentucky:
$14,296
Total itemized deductions: $17,512 (24% of AGI, reported on 20.0% of returns)
Here:
$17,512
State:
$21,160
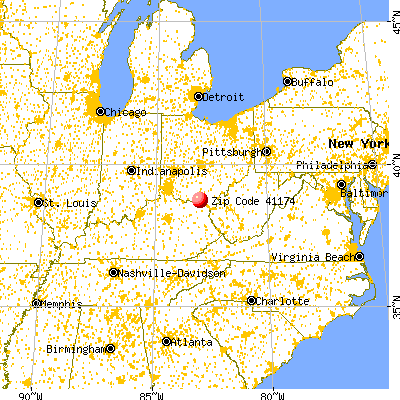
Here:
24.2% of AGI
State:
20.0% of AGI
Charity contributions: $3,367 (reported on 15.0% of returns)
Here:
$3,367
State:
$4,303
Taxes paid: $5,786 (reported on 17.5% of returns)
41174:
$5,786
State:
$8,496
Earned income credit: $2,778 (reported on 22.5% of returns)
Here:
$2,778
State:
$2,273
(% of AGI for various income ranges: 10.9% for AGIs below $25k)
Percentage of individuals using paid preparers for their 2012 taxes: 55.0%
Here:
55%
State:
60%
(% for various income ranges: 55.6% for AGIs below $25k, 50.0% for AGIs $25k-50k, 60.0% for AGIs $50k-75k, 100.0% for AGIs $75k-100k)
Averages for the 2004 tax year for zip code 41174, filed in 2005:
Average Adjusted Gross Income (AGI) in 2004: $32,737 (Individual Income Tax Returns)
Here:
$32,737
State:
$41,540
Salary/wage: $31,648 (reported on 83.7% of returns)
Here:
$31,648
State:
$36,432
(% of AGI for various income ranges: 99.1% for AGIs below $10k, 74.2% for AGIs $10k-25k, 74.2% for AGIs $25k-50k, 87.1% for AGIs $50k-75k, 88.5% for AGIs $75k-100k, 79.4% for AGIs over 100k)
Taxable interest for individuals: $528 (reported on 35.7% of returns)
This zip code:
$528
Kentucky:
$1,571
(% of AGI for various income ranges: 2.0% for AGIs below $10k, 1.4% for AGIs $10k-25k, 0.6% for AGIs $25k-50k, 0.4% for AGIs $50k-75k, 0.3% for AGIs $75k-100k)
Taxable dividends: $154 (reported on 7.4% of returns)
Here:
$154
State:
$3,453
Net capital gain/loss: +$533 (reported on 4.3% of returns)
Here:
+$533
State:
+$9,663
Profit/loss from business: +$3,959 (reported on 14.0% of returns)
Here:
+$3,959
State:
+$9,233
Total itemized deductions: $14,795 (25% of AGI, reported on 20.9% of returns)
Here:
$14,795
State:
$17,474
Here:
24.6% of AGI
State:
21.0% of AGI
Charity contributions deductions: $2,111 (3% of AGI, reported on 18.0% of returns)
Here:
$2,111
State:
$3,494
Here:
3.4% of AGI
State:
4.0% of AGI
Total tax: $3,408 (reported on 71.4% of returns)
41174:
$3,408
State:
$6,162
(% of AGI for various income ranges: 4.4% for AGIs below $10k, 3.5% for AGIs $10k-25k, 5.1% for AGIs $25k-50k, 7.5% for AGIs $50k-75k, 9.5% for AGIs $75k-100k, 15.5% for AGIs over 100k)
Earned income credit: $1,533 (reported on 26.3% of returns)
Here:
$1,533
State:
$1,723
Percentage of individuals using paid preparers for their 2004 taxes: 62.6%
Here:
63%
State:
66%
(% for various income ranges: 58.7% for AGIs below $10k, 56.4% for AGIs $10k-25k, 68.3% for AGIs $25k-50k, 62.5% for AGIs $50k-75k, 115.0% for AGIs $75k-100k)
Household received Food Stamps/SNAP in the past 12 months: 82 Household did not receive Food Stamps/SNAP in the past 12 months: 277
Women who did not have a birth in the past 12 months: 193 (121 now married, 73 unmarried)
Housing units in zip code 41174 with a mortgage: 134 Median monthly owner costs for units with a mortgage: $1,511 Median monthly owner costs for units without a mortgage: $352
Residents with income below the poverty level in 2022:
This zip code:
14.9%
Whole state:
16.5%
Residents with income below 50% of the poverty level in 2022:
This zip code:
10.8%
Whole state:
9.0%
Median number of rooms in houses and condos:
Here:
6.6
State:
6.4
Notable locations in this zip code not listed on our city pages
Notable locations in zip code 41174: Fire Brick Volunteer Fire Department (A), Firebrick Volunteer Fire Department (B). Display/hide their locations on the map
Size of family households: 163 2-persons, 53 3-persons, 43 4-persons, 22 5-persons
Size of nonfamily households: 76 1-person
84 married couples with children.
50 single-parent households (50 men).
100.1% of residents of 41174 zip code speak English at home.
Foreign born population: 0 (0.0%)
:
0.0%
Whole state:
4.0%
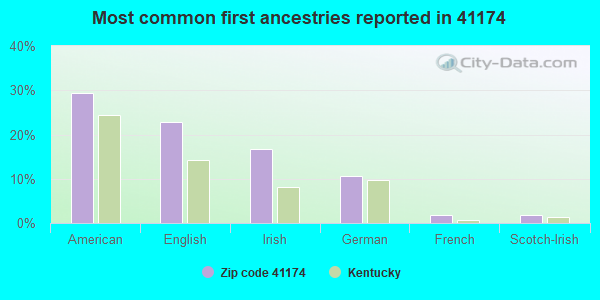
29%American
23%English
17%Irish
11%German
2%French
2%Scotch-Irish
Private high school in in this zip code not listed on the city page:
HARVEST CHRISTIAN ACADEMY (Students: 112, Location: 73 SCHOOLHOUSE RD, Grades: KG-12)
Facilities with environmental interests located in this zip code:
LARCHER TRANSFORMER SITE (ROUTE 1 in SOUTH PORTSMOUTH, KY)
SUPERFUND (Superfund database)
Housing units lacking complete plumbing facilities: 10.3% Housing units lacking complete kitchen facilities: 10.3%
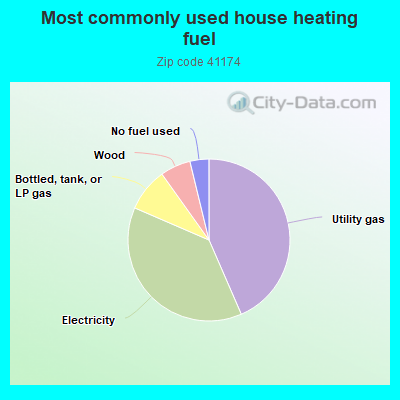
43.7%Utility gas
38.2%Electricity
8.7%Bottled, tank, or LP gas
6.1%Wood
3.8%No fuel used
Population in 1990: 813.
Place of birth for U.S.-born residents:
This state: 195
Midwest: 595
South: 41
West: 23
70% of the 41174 zip code residents lived in the same house 5 years ago. Out of people who lived in different houses, 58% lived in this county. Out of people who lived in different counties, 50% lived in Kentucky.
94% of the 41174 zip code residents lived in the same house 1 year ago. Out of people who lived in different houses, 74% moved from different state. Out of people who lived in different houses, 47% moved from abroad.
Private vs. public school enrollment:
Students in private schools in grades 1 to 8 (elementary and middle school):
Here:
0.0%
Kentucky:
17.2%
Students in private schools in grades 9 to 12 (high school):
Here:
0.0%
Kentucky:
15.2%
Students in private undergraduate colleges:
Here:
0.0%
Kentucky:
19.6%
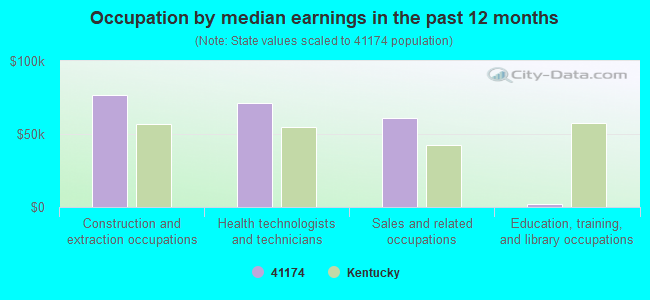
Occupation by median earnings in the past 12 months ($)
76,738Construction and extraction occupations
71,464Health technologists and technicians
60,942Sales and related occupations
2,370Education, training, and library occupations
Top industries in this zip code by the number of employees in 2005:
Educational Services: Elementary and Secondary Schools (10-19 employees: 1 establishment)
Finance and Insurance: Commercial Banking (5-9: 1)
Construction: Water and Sewer Line and Related Structures Construction (1-4: 1)
Fatal accident statistics in 2013:
Fatal accident count: 1
Vehicles involved in fatal accidents: 2
Fatal accidents caused by drunken drivers: 0
Fatalities: 1
Persons involved in fatal accidents: 2
Pedestrians involved in fatal accidents: 0
Fatal accident statistics in 2010:
Fatal accident count: 1
Vehicles involved in fatal accidents: 1
Fatal accidents caused by drunken drivers: 1
Fatalities: 1
Persons involved in fatal accidents: 1
Pedestrians involved in fatal accidents: 0
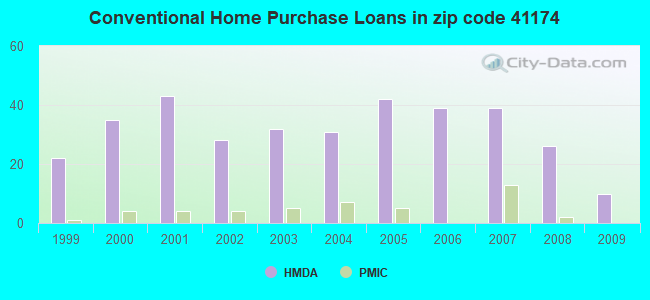
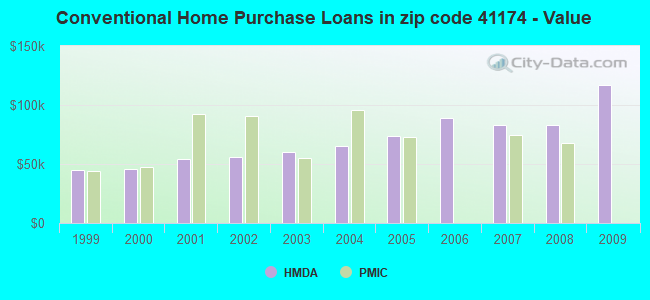
Home Mortgage Disclosure Act Aggregated Statistics For Year 2009 (Based on 2 partial tracts)
A) FHA, FSA/RHS & VA Home Purchase Loans
B) Conventional Home Purchase Loans
C) Refinancings
D) Home Improvement Loans
F) Non-occupant Loans on < 5 Family Dwellings (A B C & D)
G) Loans On Manufactured Home Dwelling (A B C & D)
Number
Average Value
Number
Average Value
Number
Average Value
Number
Average Value
Number
Average Value
Number
Average Value
LOANS ORIGINATED
4
$116,470
10
$117,051
40
$87,878
10
$10,015
2
$44,265
2
$44,710
APPLICATIONS APPROVED, NOT ACCEPTED
0
$0
3
$32,190
3
$50,077
0
$0
2
$31,295
0
$0
APPLICATIONS DENIED
1
$38,450
9
$102,237
29
$94,847
11
$19,510
2
$61,255
4
$35,098
APPLICATIONS WITHDRAWN
1
$62,590
2
$109,090
12
$88,749
0
$0
0
$0
1
$37,560
FILES CLOSED FOR INCOMPLETENESS
1
$48,290
0
$0
2
$153,355
0
$0
0
$0
0
$0
Aggregated Statistics For Year 2008 (Based on 2 partial tracts)
A) FHA, FSA/RHS & VA Home Purchase Loans
B) Conventional Home Purchase Loans
C) Refinancings
D) Home Improvement Loans
F) Non-occupant Loans on < 5 Family Dwellings (A B C & D)
G) Loans On Manufactured Home Dwelling (A B C & D)
Number
Average Value
Number
Average Value
Number
Average Value
Number
Average Value
Number
Average Value
Number
Average Value
LOANS ORIGINATED
8
$80,366
26
$82,885
41
$85,778
17
$13,939
6
$64,085
3
$41,430
APPLICATIONS APPROVED, NOT ACCEPTED
1
$46,500
2
$116,245
9
$88,626
0
$0
0
$0
2
$44,265
APPLICATIONS DENIED
1
$47,390
19
$77,701
32
$88,274
14
$18,842
4
$45,605
9
$54,248
APPLICATIONS WITHDRAWN
0
$0
2
$72,430
13
$80,547
1
$62,590
2
$71,535
3
$48,583
FILES CLOSED FOR INCOMPLETENESS
0
$0
0
$0
2
$139,050
1
$9,840
0
$0
0
$0
Aggregated Statistics For Year 2007 (Based on 2 partial tracts)
A) FHA, FSA/RHS & VA Home Purchase Loans
B) Conventional Home Purchase Loans
C) Refinancings
D) Home Improvement Loans
F) Non-occupant Loans on < 5 Family Dwellings (A B C & D)
G) Loans On Manufactured Home Dwelling (A B C & D)
Number
Average Value
Number
Average Value
Number
Average Value
Number
Average Value
Number
Average Value
Number
Average Value
LOANS ORIGINATED
8
$85,844
39
$82,839
44
$72,816
15
$14,367
6
$47,095
4
$53,428
APPLICATIONS APPROVED, NOT ACCEPTED
0
$0
5
$67,244
12
$66,991
1
$100,150
0
$0
2
$33,980
APPLICATIONS DENIED
1
$35,770
20
$43,905
41
$96,879
12
$23,697
4
$89,868
9
$39,941
APPLICATIONS WITHDRAWN
0
$0
3
$44,113
9
$79,583
0
$0
0
$0
2
$25,930
FILES CLOSED FOR INCOMPLETENESS
0
$0
3
$42,027
3
$75,113
1
$3,580
0
$0
0
$0
Aggregated Statistics For Year 2006 (Based on 2 partial tracts)
A) FHA, FSA/RHS & VA Home Purchase Loans
B) Conventional Home Purchase Loans
C) Refinancings
D) Home Improvement Loans
F) Non-occupant Loans on < 5 Family Dwellings (A B C & D)
G) Loans On Manufactured Home Dwelling (A B C & D)
Number
Average Value
Number
Average Value
Number
Average Value
Number
Average Value
Number
Average Value
Number
Average Value
LOANS ORIGINATED
5
$89,420
39
$88,663
40
$79,226
15
$24,024
4
$52,982
6
$67,960
APPLICATIONS APPROVED, NOT ACCEPTED
0
$0
6
$56,037
10
$52,668
2
$24,145
0
$0
3
$46,500
APPLICATIONS DENIED
2
$71,985
21
$52,630
47
$86,680
27
$25,567
5
$44,532
15
$34,814
APPLICATIONS WITHDRAWN
1
$26,830
5
$48,466
18
$97,567
1
$8,940
3
$65,277
1
$51,860
FILES CLOSED FOR INCOMPLETENESS
0
$0
0
$0
8
$85,731
0
$0
0
$0
0
$0
Aggregated Statistics For Year 2005 (Based on 2 partial tracts)
A) FHA, FSA/RHS & VA Home Purchase Loans
B) Conventional Home Purchase Loans
C) Refinancings
D) Home Improvement Loans
F) Non-occupant Loans on < 5 Family Dwellings (A B C & D)
G) Loans On Manufactured Home Dwelling (A B C & D)
Number
Average Value
Number
Average Value
Number
Average Value
Number
Average Value
Number
Average Value
Number
Average Value
LOANS ORIGINATED
5
$77,438
42
$73,324
47
$83,104
18
$21,958
5
$37,378
6
$56,037
APPLICATIONS APPROVED, NOT ACCEPTED
1
$12,520
8
$61,252
8
$117,922
2
$35,770
1
$57,230
4
$59,465
APPLICATIONS DENIED
2
$51,865
34
$58,991
48
$79,733
19
$25,979
3
$40,240
15
$45,068
APPLICATIONS WITHDRAWN
0
$0
3
$84,650
21
$96,659
6
$53,950
3
$78,390
0
$0
FILES CLOSED FOR INCOMPLETENESS
0
$0
1
$33,980
4
$87,632
2
$51,865
0
$0
0
$0
Aggregated Statistics For Year 2004 (Based on 2 partial tracts)
A) FHA, FSA/RHS & VA Home Purchase Loans
B) Conventional Home Purchase Loans
C) Refinancings
D) Home Improvement Loans
E) Loans on Dwellings For 5+ Families
F) Non-occupant Loans on < 5 Family Dwellings (A B C & D)
G) Loans On Manufactured Home Dwelling (A B C & D)
Number
Average Value
Number
Average Value
Number
Average Value
Number
Average Value
Number
Average Value
Number
Average Value
Number
Average Value
LOANS ORIGINATED
4
$77,125
31
$65,219
75
$76,353
13
$65,139
2
$99,255
4
$33,755
6
$42,027
APPLICATIONS APPROVED, NOT ACCEPTED
0
$0
6
$69,598
19
$83,349
2
$62,595
0
$0
0
$0
5
$71,178
APPLICATIONS DENIED
1
$97,470
15
$58,063
65
$73,366
15
$33,264
0
$0
3
$92,400
8
$48,622
APPLICATIONS WITHDRAWN
1
$79,580
3
$54,247
33
$90,179
2
$85,845
0
$0
1
$90,310
0
$0
FILES CLOSED FOR INCOMPLETENESS
0
$0
1
$109,090
6
$114,905
2
$57,675
0
$0
1
$29,510
0
$0
Aggregated Statistics For Year 2003 (Based on 2 partial tracts)
A) FHA, FSA/RHS & VA Home Purchase Loans
B) Conventional Home Purchase Loans
C) Refinancings
D) Home Improvement Loans
F) Non-occupant Loans on < 5 Family Dwellings (A B C & D)
Number
Average Value
Number
Average Value
Number
Average Value
Number
Average Value
Number
Average Value
LOANS ORIGINATED
5
$88,526
32
$60,387
106
$71,831
13
$15,889
3
$28,317
APPLICATIONS APPROVED, NOT ACCEPTED
0
$0
4
$51,418
21
$79,584
2
$23,250
1
$95,680
APPLICATIONS DENIED
0
$0
15
$62,355
61
$60,967
8
$45,604
2
$55,440
APPLICATIONS WITHDRAWN
0
$0
4
$31,968
28
$60,359
0
$0
0
$0
FILES CLOSED FOR INCOMPLETENESS
0
$0
3
$45,903
5
$51,328
0
$0
0
$0
Aggregated Statistics For Year 2002 (Based on 2 partial tracts)
A) FHA, FSA/RHS & VA Home Purchase Loans
B) Conventional Home Purchase Loans
C) Refinancings
D) Home Improvement Loans
F) Non-occupant Loans on < 5 Family Dwellings (A B C & D)
Number
Average Value
Number
Average Value
Number
Average Value
Number
Average Value
Number
Average Value
LOANS ORIGINATED
8
$63,600
28
$55,568
73
$63,782
18
$9,687
4
$25,932
APPLICATIONS APPROVED, NOT ACCEPTED
2
$42,920
4
$50,075
17
$77,217
0
$0
0
$0
APPLICATIONS DENIED
0
$0
22
$45,157
53
$56,335
13
$7,292
2
$14,305
APPLICATIONS WITHDRAWN
0
$0
5
$40,238
48
$62,203
7
$10,986
0
$0
FILES CLOSED FOR INCOMPLETENESS
0
$0
2
$23,250
6
$62,892
0
$0
0
$0
Aggregated Statistics For Year 2001 (Based on 2 partial tracts)
A) FHA, FSA/RHS & VA Home Purchase Loans
B) Conventional Home Purchase Loans
C) Refinancings
D) Home Improvement Loans
F) Non-occupant Loans on < 5 Family Dwellings (A B C & D)
Number
Average Value
Number
Average Value
Number
Average Value
Number
Average Value
Number
Average Value
LOANS ORIGINATED
5
$73,860
43
$54,317
62
$57,488
9
$9,339
1
$117,140
APPLICATIONS APPROVED, NOT ACCEPTED
0
$0
7
$41,517
13
$63,007
2
$30,405
0
$0
APPLICATIONS DENIED
0
$0
38
$46,522
42
$59,762
12
$7,228
0
$0
APPLICATIONS WITHDRAWN
1
$76,010
4
$73,100
24
$55,738
4
$6,930
1
$100,150
FILES CLOSED FOR INCOMPLETENESS
0
$0
0
$0
5
$76,544
0
$0
0
$0
Aggregated Statistics For Year 2000 (Based on 2 partial tracts)
A) FHA, FSA/RHS & VA Home Purchase Loans
B) Conventional Home Purchase Loans
C) Refinancings
D) Home Improvement Loans
F) Non-occupant Loans on < 5 Family Dwellings (A B C & D)
Number
Average Value
Number
Average Value
Number
Average Value
Number
Average Value
Number
Average Value
LOANS ORIGINATED
4
$51,418
35
$46,013
38
$47,769
11
$22,924
8
$22,131
APPLICATIONS APPROVED, NOT ACCEPTED
1
$67,060
16
$39,457
7
$52,374
4
$21,908
2
$27,720
APPLICATIONS DENIED
0
$0
33
$32,950
39
$51,382
10
$19,225
4
$19,225
APPLICATIONS WITHDRAWN
1
$59,910
3
$40,837
30
$60,031
3
$27,123
2
$21,910
FILES CLOSED FOR INCOMPLETENESS
0
$0
0
$0
6
$53,652
0
$0
0
$0
Aggregated Statistics For Year 1999 (Based on 1 partial tract)
A) FHA, FSA/RHS & VA Home Purchase Loans
B) Conventional Home Purchase Loans
C) Refinancings
D) Home Improvement Loans
F) Non-occupant Loans on < 5 Family Dwellings (A B C & D)
Detailed PMIC statistics for the following Tracts:0406.00
2002 - 2018 National Fire Incident Reporting System (NFIRS) incidents
According to the data from the years 2002 - 2018 the average number of fire incidents per year is 7. The highest number of fire incidents - 13 took place in 2009, and the least - 3 in 2013. The data has a dropping trend.
When looking into fire subcategories, the most incidents belonged to: Structure Fires (41.7%), and Outside Fires (39.2%).
Fire incident types reported to NFIRS in Zip Code 41174


 Nearest zip codes: 41175, 45630, 45663, 41166, 45662, 45652.


 (Students: 112, Location: 73 SCHOOLHOUSE RD, Grades: KG-12)
 According to the data from the years 2002 - 2018 the average number of fire incidents per year is 7. The highest number of fire incidents - 13 took place in 2009, and the least - 3 in 2013. The data has a dropping trend.
 When looking into fire subcategories, the most incidents belonged to: Structure Fires (41.7%), and Outside Fires (39.2%).