Estimated zip code population in 2022: 1,725 Zip code population in 2010: 1,618 Zip code population in 2000: 1,729
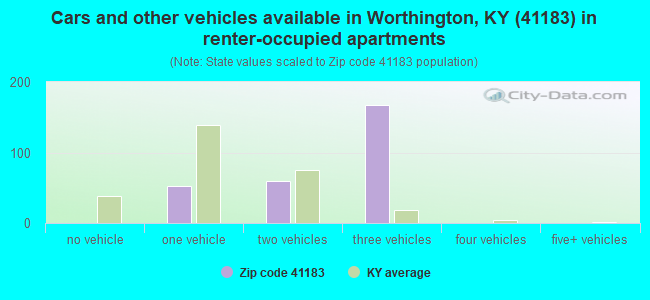
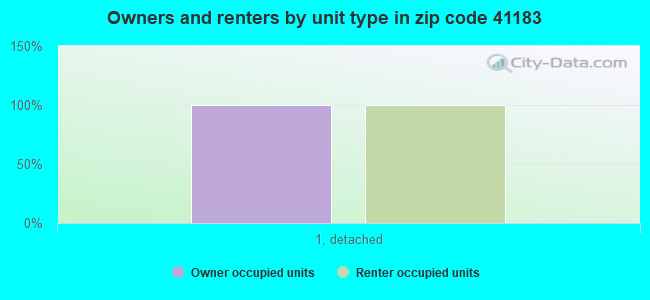
Houses and condos: 854 Renter-occupied apartments: 277
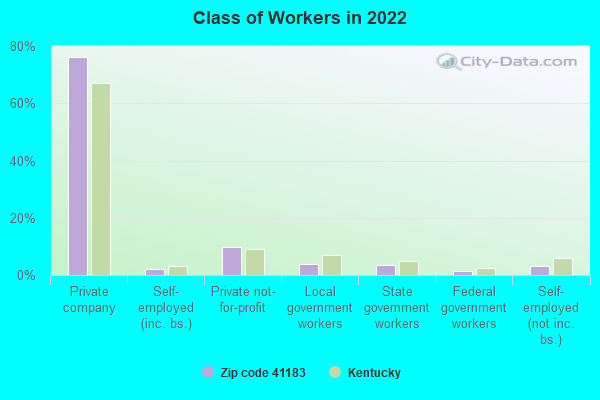
% of renters here:
35%
State:
31%
March 2022 cost of living index in zip code 41183: 81.6 (low, U.S. average is 100)
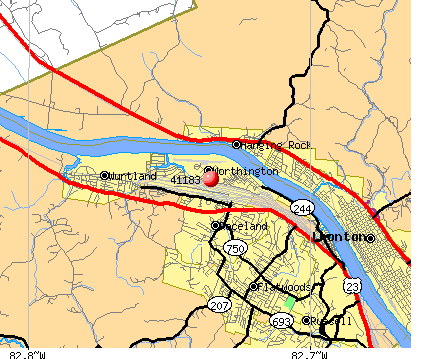
Land area: 1.3 sq. mi. Water area: 0.9 sq. mi.
Population density: 1,339 people per square mile
(low).
OSM Map
General Map
Google Map
MSN Map
OSM Map
General Map
Google Map
MSN Map
OSM Map
General Map
Google Map
MSN Map
OSM Map
General Map
Google Map
MSN Map
Please wait while loading the map...
Real estate property taxes paid for housing units in 2022:
This zip code:
1.1% ($1,407)
Kentucky:
0.7% ($1,456)
Median real estate property taxes paid for housing units with mortgages in 2022: $1,594 (1.3%) Median real estate property taxes paid for housing units with no mortgage in 2022: $1,128 (0.9%)
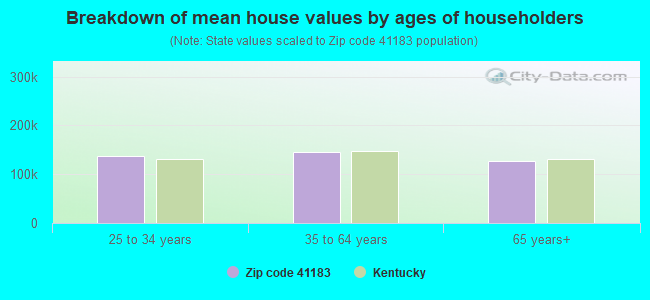
Estimated median house/condo value in 2022: $126,652
41183:
$126,652
Kentucky:
$196,300
According to our research of Kentucky and other state lists, there was 1 registered sex offender living in 41183 zip code as of April 24, 2024. The ratio of all residents to sex offenders in zip code 41183 is 1,444 to 1. The ratio of registered sex offenders to all residents in this zip code is much lower than the state average.
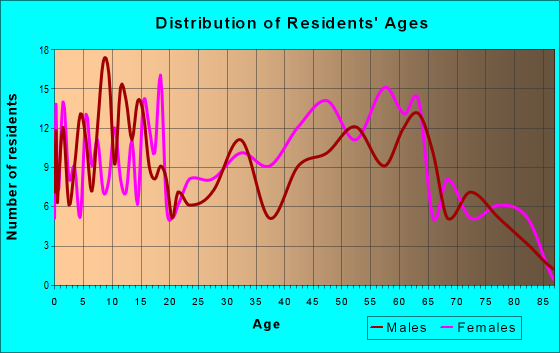
Median resident age:
This zip code:
37.4 years
Kentucky median age:
39.4 years
Average household size:
This zip code:
2.2 people
Kentucky:
2.4 people
Averages for the 2020 tax year for zip code 41183, filed in 2021:
Average Adjusted Gross Income (AGI) in 2020: $47,300 (Individual Income Tax Returns)
Here:
$47,300
State:
$61,342
Salary/wage: $40,935 (reported on 81.4% of returns)
Here:
$40,935
State:
$50,827
(% of AGI for various income ranges: 952.9% for AGIs below $25k, 3201.4% for AGIs $25k-50k, 5101.0% for AGIs $50k-75k, 7853.3% for AGIs $75k-100k, 14074.0% for AGIs $100k-200k)
Taxable interest for individuals: $356 (reported on 25.7% of returns)
This zip code:
$356
Kentucky:
$1,441
(% of AGI for various income ranges: 5.7% for AGIs below $25k, 12.9% for AGIs $25k-50k, 26.0% for AGIs $50k-75k, 6.7% for AGIs $75k-100k, 8.0% for AGIs $100k-200k)
Ordinary dividends: $767 (reported on 4.3% of returns)
Here:
$767
State:
$7,388
(% of AGI for various income ranges: 16.4% for AGIs $25k-50k)
Net capital gain/loss in AGI: +$600 (reported on 2.9% of returns)
Here:
+$600
State:
+$19,475
(% of AGI for various income ranges: 5.7% for AGIs below $25k)
Profit/loss from business: +$6,175 (reported on 11.4% of returns)
Here:
+$6,175
State:
+$11,386
(% of AGI for various income ranges: 51.0% for AGIs below $25k, 182.1% for AGIs $25k-50k, 220.0% for AGIs $75k-100k)
Taxable individual retirement arrangement distribution: $15,700 (reported on 7.1% of returns)
41183:
$15,700
Kentucky:
$18,941
(% of AGI for various income ranges: 785.0% for AGIs $50k-75k)
Earned income credit: $2,177 (reported on 18.6% of returns)
Here:
$2,177
State:
$2,336
(% of AGI for various income ranges: 80.5% for AGIs below $25k, 81.4% for AGIs $25k-50k)
Percentage of individuals using paid preparers for their 2020 taxes: 94.3%
Here:
94%
State:
94%
(% for various income ranges: 92.0% for AGIs below $25k, 100.0% for AGIs $25k-50k, 100.0% for AGIs $50k-75k, 87.5% for AGIs $75k-100k, 87.5% for AGIs $100k-200k)
Averages for the 2012 tax year for zip code 41183, filed in 2013:
Average Adjusted Gross Income (AGI) in 2012: $43,220 (Individual Income Tax Returns)
Here:
$43,220
State:
$50,814
Salary/wage: $39,519 (reported on 82.9% of returns)
Here:
$39,519
State:
$42,723
(% of AGI for various income ranges: 69.2% for AGIs below $25k, 75.7% for AGIs $25k-50k, 77.9% for AGIs $50k-75k, 75.5% for AGIs $75k-100k, 77.0% for AGIs $100k-200k)
Taxable interest for individuals: $365 (reported on 28.6% of returns)
This zip code:
$365
Kentucky:
$1,381
(% of AGI for various income ranges: 0.7% for AGIs below $25k, 0.2% for AGIs $25k-50k, 0.2% for AGIs $50k-75k, 0.1% for AGIs $75k-100k, 0.2% for AGIs $100k-200k)
Ordinary dividends: $467 (reported on 8.6% of returns)
Here:
$467
State:
$6,239
Net capital gain/loss in AGI: +$1,367 (reported on 4.3% of returns)
Here:
+$1,367
State:
+$11,336
Profit/loss from business: +$6,000 (reported on 10.0% of returns)
Here:
+$6,000
State:
+$10,862
Taxable individual retirement arrangement distribution: $9,371 (reported on 10.0% of returns)
41183:
$9,371
Kentucky:
$14,296
Total itemized deductions: $17,662 (22% of AGI, reported on 22.9% of returns)
Here:
$17,662
State:
$21,160
Here:
22.5% of AGI
State:
20.0% of AGI
(% of AGI for various income ranges: 9.5% for AGIs $25k-50k, 10.5% for AGIs $50k-75k, 7.9% for AGIs $75k-100k, 13.4% for AGIs $100k-200k)
Charity contributions: $2,625 (reported on 17.1% of returns)
Here:
$2,625
State:
$4,303
(% of AGI for various income ranges: 2.5% for AGIs below $25k, 1.9% for AGIs $50k-75k, 1.1% for AGIs $100k-200k)
Taxes paid: $6,338 (reported on 22.9% of returns)
41183:
$6,338
State:
$8,496
(% of AGI for various income ranges: 1.8% for AGIs $25k-50k, 3.4% for AGIs $50k-75k, 3.3% for AGIs $75k-100k, 6.3% for AGIs $100k-200k)
Earned income credit: $2,331 (reported on 22.9% of returns)
Here:
$2,331
State:
$2,273
(% of AGI for various income ranges: 8.2% for AGIs below $25k, 1.1% for AGIs $25k-50k)
Percentage of individuals using paid preparers for their 2012 taxes: 55.7%
Here:
56%
State:
60%
(% for various income ranges: 51.7% for AGIs below $25k, 52.9% for AGIs $25k-50k, 66.7% for AGIs $50k-75k, 50.0% for AGIs $75k-100k, 66.7% for AGIs $100k-200k)
Averages for the 2004 tax year for zip code 41183, filed in 2005:
Average Adjusted Gross Income (AGI) in 2004: $36,806 (Individual Income Tax Returns)
Here:
$36,806
State:
$41,540
Salary/wage: $34,565 (reported on 85.0% of returns)
Here:
$34,565
State:
$36,432
(% of AGI for various income ranges: 75.8% for AGIs below $10k, 68.9% for AGIs $10k-25k, 78.4% for AGIs $25k-50k, 88.6% for AGIs $50k-75k, 84.8% for AGIs $75k-100k, 67.6% for AGIs over 100k)
Taxable interest for individuals: $683 (reported on 44.1% of returns)
This zip code:
$683
Kentucky:
$1,571
(% of AGI for various income ranges: 2.1% for AGIs below $10k, 2.4% for AGIs $10k-25k, 1.2% for AGIs $25k-50k, 0.2% for AGIs $50k-75k, 0.5% for AGIs $75k-100k, 0.3% for AGIs over 100k)
Taxable dividends: $267 (reported on 12.9% of returns)
Here:
$267
State:
$3,453
(% of AGI for various income ranges: 0.3% for AGIs $10k-25k, 0.1% for AGIs $25k-50k, 0.1% for AGIs $50k-75k, 0.2% for AGIs $75k-100k)
Profit/loss from business: +$1,988 (reported on 11.6% of returns)
Here:
+$1,988
State:
+$9,233
(% of AGI for various income ranges: 7.4% for AGIs below $10k, 3.6% for AGIs $10k-25k, 0.6% for AGIs $25k-50k, -0.6% for AGIs $50k-75k)
IRA payment deduction: $1,429 (reported on 2.0% of returns)
41183:
$1,429
Kentucky:
$2,955
Total itemized deductions: $13,659 (20% of AGI, reported on 24.7% of returns)
Here:
$13,659
State:
$17,474
Here:
19.7% of AGI
State:
21.0% of AGI
(% of AGI for various income ranges: 5.6% for AGIs $10k-25k, 7.6% for AGIs $25k-50k, 10.0% for AGIs $50k-75k, 13.7% for AGIs $75k-100k, 8.6% for AGIs over 100k)
Charity contributions deductions: $2,352 (3% of AGI, reported on 20.3% of returns)
Here:
$2,352
State:
$3,494
Here:
3.4% of AGI
State:
4.0% of AGI
(% of AGI for various income ranges: 0.8% for AGIs $10k-25k, 0.8% for AGIs $25k-50k, 1.4% for AGIs $50k-75k, 2.2% for AGIs $75k-100k, 1.3% for AGIs over 100k)
Total tax: $4,463 (reported on 72.9% of returns)
41183:
$4,463
State:
$6,162
(% of AGI for various income ranges: 2.1% for AGIs below $10k, 3.2% for AGIs $10k-25k, 5.5% for AGIs $25k-50k, 8.9% for AGIs $50k-75k, 10.3% for AGIs $75k-100k, 18.3% for AGIs over 100k)
Earned income credit: $1,727 (reported on 18.3% of returns)
Here:
$1,727
State:
$1,723
Percentage of individuals using paid preparers for their 2004 taxes: 63.7%
Here:
64%
State:
66%
(% for various income ranges: 50.7% for AGIs below $10k, 65.6% for AGIs $10k-25k, 64.3% for AGIs $25k-50k, 74.2% for AGIs $50k-75k, 56.7% for AGIs $75k-100k, 87.5% for AGIs over 100k)
Household received Food Stamps/SNAP in the past 12 months: 153 Household did not receive Food Stamps/SNAP in the past 12 months: 633
Women who had a birth in the past 12 months: 9 (7 now married, 2 unmarried) Women who did not have a birth in the past 12 months: 324 (200 now married, 125 unmarried)
Housing units in zip code 41183 with a mortgage: 275 (28 second mortgage, 3 home equity loan, 25 both second mortgage and home equity loan) Houses without a mortgage: 9
Median monthly owner costs for units with a mortgage: $1,034 Median monthly owner costs for units without a mortgage: $506
Residents with income below the poverty level in 2022:
This zip code:
18.3%
Whole state:
16.5%
Residents with income below 50% of the poverty level in 2022:
This zip code:
10.6%
Whole state:
9.0%
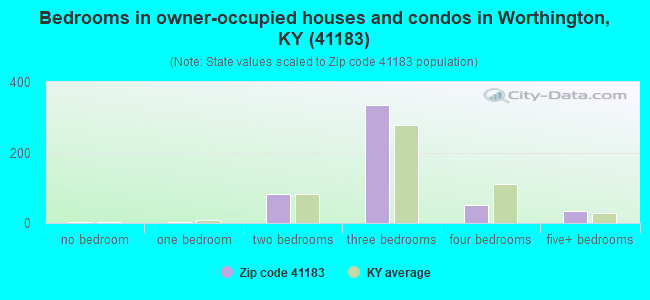
Median number of rooms in houses and condos:
Here:
6.2
State:
6.4
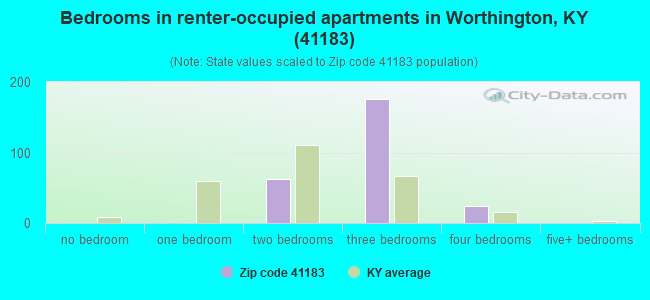
Median number of rooms in apartments:
Here:
5.3
State:
4.4
Notable locations in this zip code not listed on our city pages
Size of family households: 158 2-persons, 90 3-persons, 97 4-persons, 50 5-persons, 22 6-persons, 2 7-or-more-persons
Size of nonfamily households: 343 1-person, 24 2-persons
150 married couples with children.
131 single-parent households (10 men, 121 women).
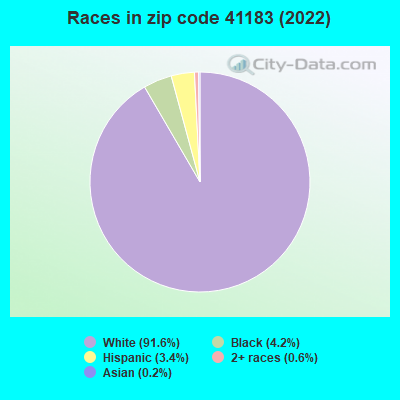
97.9% of residents of 41183 zip code speak English at home.
2.1% of residents speak Spanish at home (100% very well).
0.2% of residents speak Asian or Pacific Island language at home (100% very well).
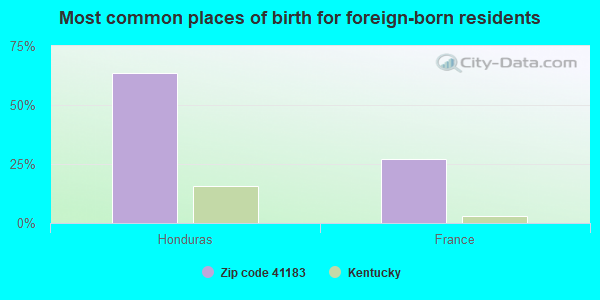
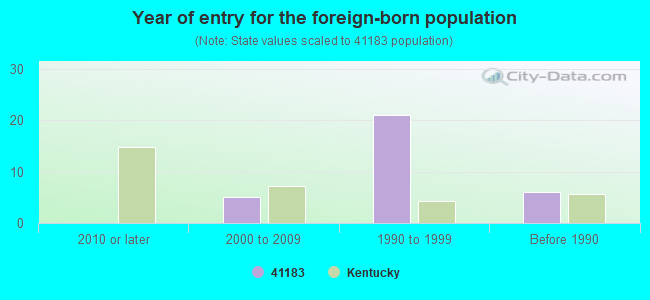
Foreign born population: 22 (1.3%) (70.0% of them are naturalized citizens)
This zip code:
1.3%
Whole state:
4.0%
64%Honduras
27%France
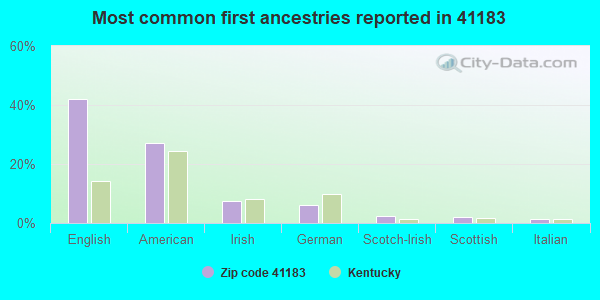
42%English
27%American
7%Irish
6%German
2%Scotch-Irish
2%Scottish
2%Italian
Year of entry for the foreign-born population
02010 or later
52000 to 2009
211990 to 1999
6Before 1990
Facilities with environmental interests located in this zip code:
ASHLAND-BOYD COUNTY AIRPORT (501 SCOTT ST in WORTHINGTON, KY)
National Pollutant Discharge Elimination System NON-MAJOR (Tracking pollutant discharge elimination systems) - permit National Pollutant Discharge Elimination System NON-MAJOR (Tracking pollutant discharge elimination systems) - permit Business SIC classification: AIRPORTS, FLYING FIELDS, AND AIRPORT TERMINAL SERVICES Organizations: ASHLAND BOYD CO AIRPORT (CONTACT/OWNER)
Alternative names: ASHLAND BOYD CO AIRPORT, HANGAR D BOYD CO AIRPORT
MOORE'S AUTO PARTS (RIVERSIDE AND FIFTH STREETS in WORTHINGTON, KY)
(Resource Conservation and Recovery Act (tracking hazardous waste)) Organizations: FRED MOORE (CONTACT/OWNER)
PRESSURE TECH INDUSTRIAL CLEANING SERVIC (610 FIRST AVENUE in WORTHINGTON, KY)
USED OIL PROGRAM (Resource Conservation and Recovery Act (tracking hazardous waste)) Organizations: CHADWICK B. GABBARD (CONTACT/OWNER)
Housing units lacking complete plumbing facilities: 0.9% Housing units lacking complete kitchen facilities: 2.2%
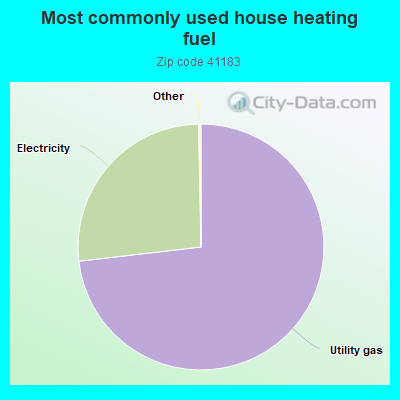
73.3%Utility gas
26.6%Electricity
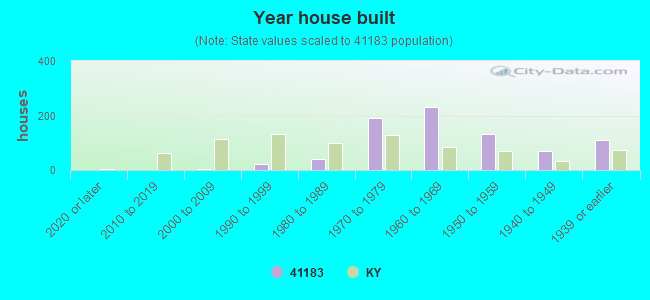
Population in 1990: 1,829.
Place of birth for U.S.-born residents:
This state: 1,078
Northeast: 29
Midwest: 256
South: 325
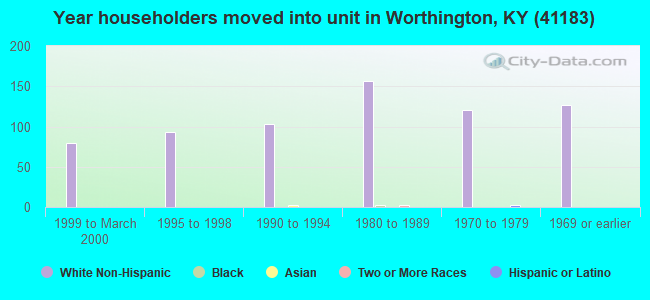
73% of the 41183 zip code residents lived in the same house 5 years ago. Out of people who lived in different houses, 61% lived in this county. Out of people who lived in different counties, 50% lived in Kentucky.
91% of the 41183 zip code residents lived in the same house 1 year ago. Out of people who lived in different houses, 50% moved from this county. Out of people who lived in different houses, 30% moved from different county within same state. Out of people who lived in different houses, 6% moved from different state. Out of people who lived in different houses, 13% moved from abroad.
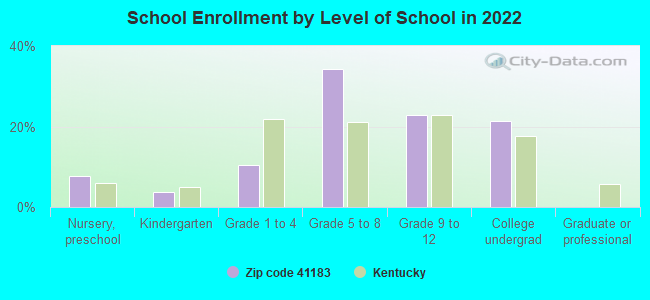
Private vs. public school enrollment:
Students in private schools in grades 1 to 8 (elementary and middle school): 8
Here:
4.8%
Kentucky:
17.2%
Students in private schools in grades 9 to 12 (high school): 12
Here:
13.6%
Kentucky:
15.2%
Students in private undergraduate colleges: 26
Here:
31.7%
Kentucky:
19.6%
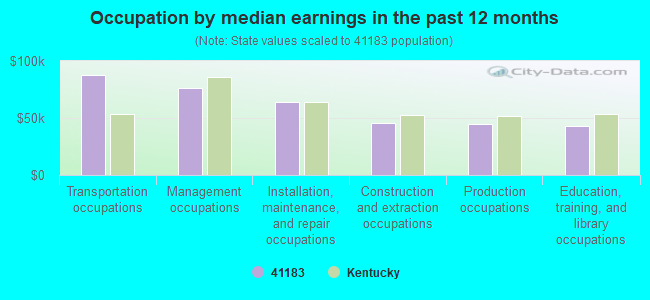
Occupation by median earnings in the past 12 months ($)
87,392Transportation occupations
76,270Management occupations
64,454Installation, maintenance, and repair occupations
45,608Construction and extraction occupations
44,934Production occupations
42,686Education, training, and library occupations
Top industries in this zip code by the number of employees in 2005:
Administrative and Support and Waste Management and Remediation Services: Janitorial Services (20-49 employees: 1 establishment, 10-19 employees: 1 establishment, 1-4 employees: 1 establishment)
Management of Companies and Enterprises: Corporate, Subsidiary, and Regional Managing Offices (10-19: 1, 1-4: 1)
Administrative and Support and Waste Management and Remediation Services: Other Services to Buildings and Dwellings (10-19: 1)
Other Services (except Public Administration): Religious Organizations (1-4: 3)
Professional, Scientific, and Technical Services: Process, Physical Distribution, and Logistics Consulting Services (1-4: 1)
Professional, Scientific, and Technical Services: Administrative Management and General Management Consulting Services (1-4: 1)
Home Mortgage Disclosure Act Aggregated Statistics For Year 2009 (Based on 2 partial tracts)
A) FHA, FSA/RHS & VA Home Purchase Loans
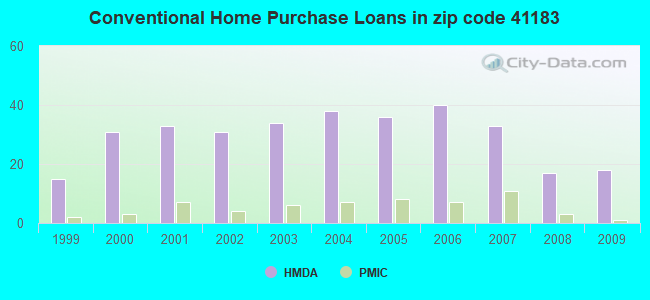
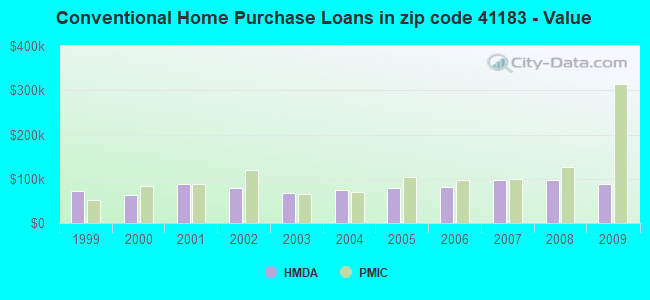
B) Conventional Home Purchase Loans
C) Refinancings
D) Home Improvement Loans
F) Non-occupant Loans on < 5 Family Dwellings (A B C & D)
G) Loans On Manufactured Home Dwelling (A B C & D)
Number
Average Value
Number
Average Value
Number
Average Value
Number
Average Value
Number
Average Value
Number
Average Value
LOANS ORIGINATED
7
$115,507
18
$89,099
69
$93,402
8
$32,908
7
$36,139
2
$25,115
APPLICATIONS APPROVED, NOT ACCEPTED
0
$0
1
$24,210
7
$123,289
2
$50,835
1
$24,210
0
$0
APPLICATIONS DENIED
3
$75,650
2
$49,325
26
$89,779
10
$26,629
1
$35,710
0
$0
APPLICATIONS WITHDRAWN
2
$139,500
1
$215,450
10
$100,040
1
$12,100
1
$103,490
1
$12,100
FILES CLOSED FOR INCOMPLETENESS
0
$0
0
$0
1
$142,220
0
$0
0
$0
0
$0
Aggregated Statistics For Year 2008 (Based on 2 partial tracts)
A) FHA, FSA/RHS & VA Home Purchase Loans
B) Conventional Home Purchase Loans
C) Refinancings
D) Home Improvement Loans
F) Non-occupant Loans on < 5 Family Dwellings (A B C & D)
G) Loans On Manufactured Home Dwelling (A B C & D)
Number
Average Value
Number
Average Value
Number
Average Value
Number
Average Value
Number
Average Value
Number
Average Value
LOANS ORIGINATED
12
$98,143
17
$97,722
41
$106,604
7
$42,969
8
$55,451
1
$49,020
APPLICATIONS APPROVED, NOT ACCEPTED
1
$97,440
4
$108,785
8
$104,246
2
$56,285
1
$42,970
0
$0
APPLICATIONS DENIED
3
$93,200
4
$71,110
34
$116,839
11
$32,185
2
$50,835
5
$72,140
APPLICATIONS WITHDRAWN
1
$49,630
6
$89,368
13
$96,227
3
$66,977
2
$61,430
1
$57,490
FILES CLOSED FOR INCOMPLETENESS
0
$0
1
$58,100
2
$152,815
0
$0
0
$0
0
$0
Aggregated Statistics For Year 2007 (Based on 2 partial tracts)
A) FHA, FSA/RHS & VA Home Purchase Loans
B) Conventional Home Purchase Loans
C) Refinancings
D) Home Improvement Loans
F) Non-occupant Loans on < 5 Family Dwellings (A B C & D)
G) Loans On Manufactured Home Dwelling (A B C & D)
Number
Average Value
Number
Average Value
Number
Average Value
Number
Average Value
Number
Average Value
Number
Average Value
LOANS ORIGINATED
10
$93,806
33
$96,667
47
$87,909
9
$53,258
9
$48,080
2
$25,115
APPLICATIONS APPROVED, NOT ACCEPTED
1
$116,800
4
$115,442
10
$70,264
2
$35,405
0
$0
1
$8,470
APPLICATIONS DENIED
1
$39,340
10
$65,543
25
$97,510
11
$23,107
1
$62,940
2
$31,470
APPLICATIONS WITHDRAWN
1
$73,830
2
$55,375
15
$178,413
1
$68,390
1
$30,260
0
$0
FILES CLOSED FOR INCOMPLETENESS
1
$113,780
5
$102,520
3
$332,253
0
$0
1
$118,010
0
$0
Aggregated Statistics For Year 2006 (Based on 2 partial tracts)
A) FHA, FSA/RHS & VA Home Purchase Loans
B) Conventional Home Purchase Loans
C) Refinancings
D) Home Improvement Loans
F) Non-occupant Loans on < 5 Family Dwellings (A B C & D)
G) Loans On Manufactured Home Dwelling (A B C & D)
Number
Average Value
Number
Average Value
Number
Average Value
Number
Average Value
Number
Average Value
Number
Average Value
LOANS ORIGINATED
9
$85,333
40
$82,322
42
$74,872
18
$26,494
7
$74,353
1
$96,830
APPLICATIONS APPROVED, NOT ACCEPTED
0
$0
7
$81,270
7
$82,480
4
$21,938
3
$85,333
4
$62,032
APPLICATIONS DENIED
1
$29,650
13
$62,755
43
$89,837
11
$29,435
4
$57,040
2
$59,310
APPLICATIONS WITHDRAWN
0
$0
4
$67,178
19
$114,446
1
$9,080
0
$0
1
$9,080
FILES CLOSED FOR INCOMPLETENESS
0
$0
1
$77,470
5
$79,886
1
$55,070
0
$0
0
$0
Aggregated Statistics For Year 2005 (Based on 2 partial tracts)
A) FHA, FSA/RHS & VA Home Purchase Loans
B) Conventional Home Purchase Loans
C) Refinancings
D) Home Improvement Loans
F) Non-occupant Loans on < 5 Family Dwellings (A B C & D)
G) Loans On Manufactured Home Dwelling (A B C & D)
Number
Average Value
Number
Average Value
Number
Average Value
Number
Average Value
Number
Average Value
Number
Average Value
LOANS ORIGINATED
6
$85,132
36
$78,659
42
$89,310
18
$34,328
9
$55,006
3
$42,767
APPLICATIONS APPROVED, NOT ACCEPTED
1
$29,050
9
$58,907
11
$84,233
2
$57,190
1
$82,310
3
$59,107
APPLICATIONS DENIED
1
$40,550
17
$56,568
58
$87,942
13
$27,885
2
$94,110
7
$55,419
APPLICATIONS WITHDRAWN
1
$40,550
6
$100,362
17
$84,372
5
$54,226
1
$49,020
1
$55,070
FILES CLOSED FOR INCOMPLETENESS
0
$0
2
$155,840
6
$73,733
1
$131,930
1
$31,470
0
$0
Aggregated Statistics For Year 2004 (Based on 2 partial tracts)
A) FHA, FSA/RHS & VA Home Purchase Loans
B) Conventional Home Purchase Loans
C) Refinancings
D) Home Improvement Loans
E) Loans on Dwellings For 5+ Families
F) Non-occupant Loans on < 5 Family Dwellings (A B C & D)
G) Loans On Manufactured Home Dwelling (A B C & D)
Number
Average Value
Number
Average Value
Number
Average Value
Number
Average Value
Number
Average Value
Number
Average Value
Number
Average Value
LOANS ORIGINATED
9
$101,001
38
$74,678
53
$75,559
10
$26,084
0
$0
15
$52,854
3
$39,943
APPLICATIONS APPROVED, NOT ACCEPTED
1
$36,920
11
$69,928
8
$85,939
4
$22,392
0
$0
1
$42,360
4
$33,740
APPLICATIONS DENIED
4
$96,228
5
$88,238
42
$91,904
10
$22,453
1
$136,170
7
$89,916
2
$37,825
APPLICATIONS WITHDRAWN
0
$0
2
$78,375
24
$107,322
3
$44,987
0
$0
1
$79,280
1
$38,130
FILES CLOSED FOR INCOMPLETENESS
1
$132,540
2
$73,530
4
$75,650
0
$0
0
$0
1
$58,700
0
$0
Aggregated Statistics For Year 2003 (Based on 2 partial tracts)
A) FHA, FSA/RHS & VA Home Purchase Loans
B) Conventional Home Purchase Loans
C) Refinancings
D) Home Improvement Loans
F) Non-occupant Loans on < 5 Family Dwellings (A B C & D)
Number
Average Value
Number
Average Value
Number
Average Value
Number
Average Value
Number
Average Value
LOANS ORIGINATED
5
$100,706
34
$68,423
103
$80,239
7
$22,566
11
$47,095
APPLICATIONS APPROVED, NOT ACCEPTED
1
$24,810
5
$52,532
13
$66,712
0
$0
1
$105,910
APPLICATIONS DENIED
2
$103,490
16
$72,321
44
$87,245
7
$55,160
5
$110,026
APPLICATIONS WITHDRAWN
0
$0
5
$61,126
26
$104,583
1
$15,130
3
$107,927
FILES CLOSED FOR INCOMPLETENESS
1
$122,250
2
$46,300
2
$109,240
0
$0
0
$0
Aggregated Statistics For Year 2002 (Based on 2 partial tracts)
A) FHA, FSA/RHS & VA Home Purchase Loans
B) Conventional Home Purchase Loans
C) Refinancings
D) Home Improvement Loans
E) Loans on Dwellings For 5+ Families
F) Non-occupant Loans on < 5 Family Dwellings (A B C & D)
Number
Average Value
Number
Average Value
Number
Average Value
Number
Average Value
Number
Average Value
Number
Average Value
LOANS ORIGINATED
6
$66,370
31
$78,617
78
$68,457
13
$10,102
1
$75,650
7
$41,586
APPLICATIONS APPROVED, NOT ACCEPTED
0
$0
18
$40,178
11
$66,407
2
$32,380
0
$0
3
$36,313
APPLICATIONS DENIED
1
$47,810
36
$43,389
34
$70,381
11
$8,858
0
$0
4
$54,165
APPLICATIONS WITHDRAWN
0
$0
3
$97,237
30
$74,319
2
$12,405
0
$0
2
$64,755
FILES CLOSED FOR INCOMPLETENESS
1
$30,260
0
$0
1
$65,970
0
$0
0
$0
0
$0
Aggregated Statistics For Year 2001 (Based on 2 partial tracts)
A) FHA, FSA/RHS & VA Home Purchase Loans
B) Conventional Home Purchase Loans
C) Refinancings
D) Home Improvement Loans
F) Non-occupant Loans on < 5 Family Dwellings (A B C & D)
Number
Average Value
Number
Average Value
Number
Average Value
Number
Average Value
Number
Average Value
LOANS ORIGINATED
3
$83,113
33
$87,039
80
$68,698
9
$26,292
8
$43,348
APPLICATIONS APPROVED, NOT ACCEPTED
0
$0
7
$42,623
14
$60,952
3
$22,593
0
$0
APPLICATIONS DENIED
0
$0
20
$47,387
41
$60,653
12
$17,500
0
$0
APPLICATIONS WITHDRAWN
0
$0
4
$71,715
18
$69,296
3
$8,473
1
$15,130
FILES CLOSED FOR INCOMPLETENESS
0
$0
1
$52,650
7
$69,771
1
$17,550
0
$0
Aggregated Statistics For Year 2000 (Based on 2 partial tracts)
A) FHA, FSA/RHS & VA Home Purchase Loans
B) Conventional Home Purchase Loans
C) Refinancings
D) Home Improvement Loans
F) Non-occupant Loans on < 5 Family Dwellings (A B C & D)
Number
Average Value
Number
Average Value
Number
Average Value
Number
Average Value
Number
Average Value
LOANS ORIGINATED
7
$59,829
31
$64,171
37
$44,539
16
$10,288
10
$33,286
APPLICATIONS APPROVED, NOT ACCEPTED
1
$21,180
1
$24,810
10
$49,808
2
$75,045
1
$39,940
APPLICATIONS DENIED
0
$0
7
$33,977
33
$52,377
7
$13,141
2
$59,610
APPLICATIONS WITHDRAWN
1
$46,000
4
$69,448
26
$43,202
0
$0
2
$34,800
FILES CLOSED FOR INCOMPLETENESS
0
$0
0
$0
2
$67,780
0
$0
0
$0
Aggregated Statistics For Year 1999 (Based on 1 partial tract)
A) FHA, FSA/RHS & VA Home Purchase Loans
B) Conventional Home Purchase Loans
C) Refinancings
D) Home Improvement Loans
F) Non-occupant Loans on < 5 Family Dwellings (A B C & D)
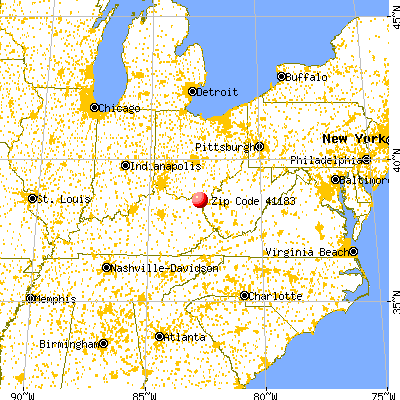


 Nearest zip codes: 41169, 41139, 45638, 45636, 41101, 41102.