Estimated zip code population in 2022: 1,182 Zip code population in 2010: 1,370 Zip code population in 2000: 1,435
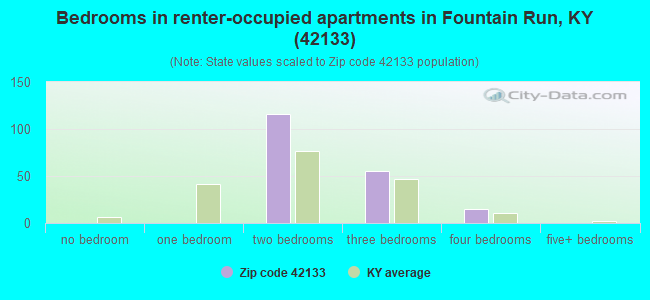
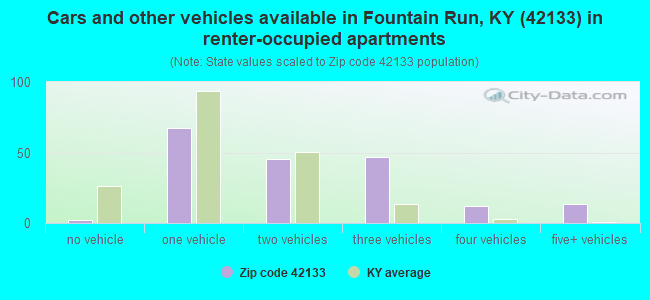
Houses and condos: 707 Renter-occupied apartments: 187
% of renters here:
34%
State:
31%
March 2022 cost of living index in zip code 42133: 81.0 (low, U.S. average is 100)
Land area: 71.0 sq. mi. Water area: 0.8 sq. mi.
Population density: 17 people per square mile
(very low).
OSM Map
General Map
Google Map
MSN Map
OSM Map
General Map
Google Map
MSN Map
OSM Map
General Map
Google Map
MSN Map
OSM Map
General Map
Google Map
MSN Map
Please wait while loading the map...
Real estate property taxes paid for housing units in 2022:
This zip code:
0.4% ($611)
Kentucky:
0.7% ($1,456)
Median real estate property taxes paid for housing units with mortgages in 2022: $920 (0.5%) Median real estate property taxes paid for housing units with no mortgage in 2022: $547 (0.5%)
Business Search- 14 Million verified businesses
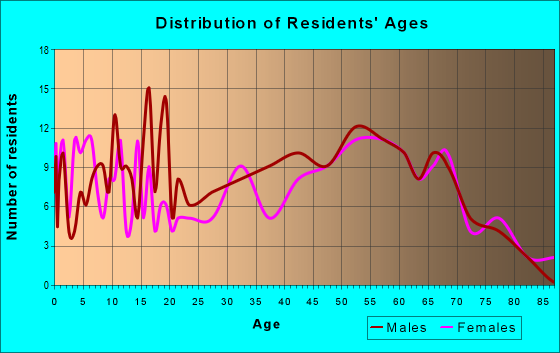
Males: 592
(50.1%)
Females: 589
(49.9%)
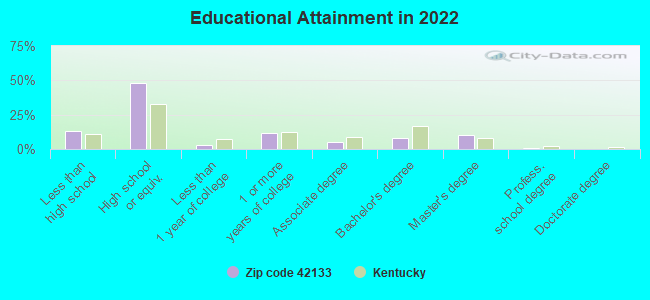
For population 25 years and over in 42133:
High school or higher: 85.2%
Bachelor's degree or higher: 18.9%
Graduate or professional degree: 10.7%
Unemployed: 7.8%
Mean travel time to work (commute): 25.9 minutes
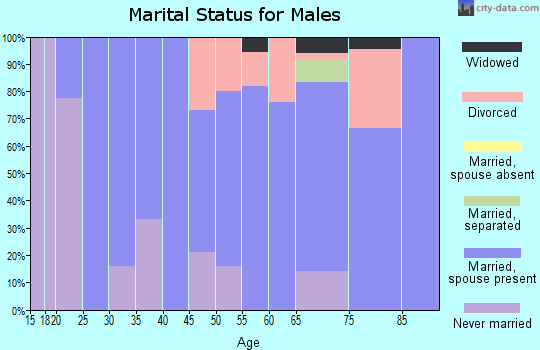
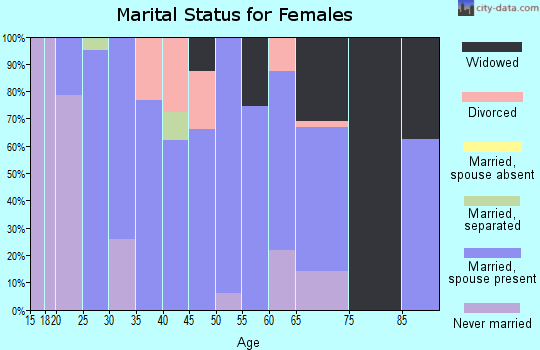
For population 15 years and over in 42133:
Never married: 24.8%
Now married: 57.6%
Separated: 3.8%
Widowed: 7.5%
Divorced: 6.3%
Zip code 42133 compared to state average:
Unemployed percentage above state average.
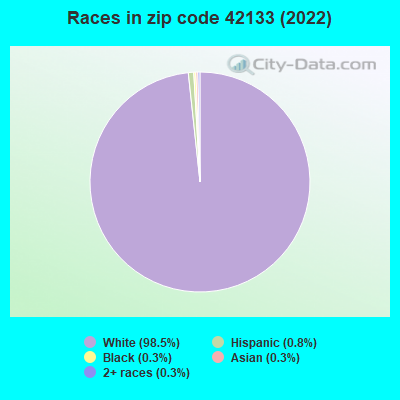
Black race population percentage significantly below state average.
Hispanic race population percentage significantly below state average.
Median age significantly above state average.
Foreign-born population percentage significantly below state average.
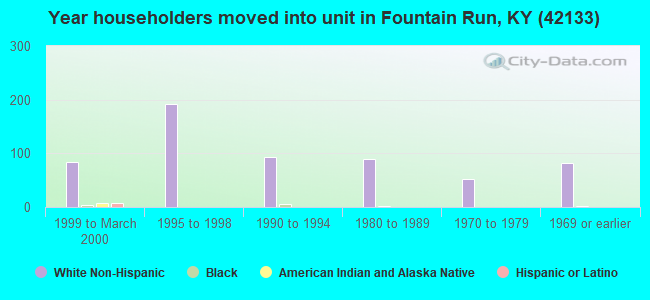
Length of stay since moving in above state average.
Number of college students significantly below state average.
Estimated median house/condo value in 2022: $138,630
42133:
$138,630
Kentucky:
$196,300
According to our research of Kentucky and other state lists, there were 2 registered sex offenders living in 42133 zip code as of April 24, 2024. The ratio of all residents to sex offenders in zip code 42133 is 766 to 1. The ratio of registered sex offenders to all residents in this zip code is lower than the state average.
Median resident age:
This zip code:
48.6 years
Kentucky median age:
39.4 years
Average household size:
This zip code:
2.1 people
Kentucky:
2.4 people
Averages for the 2020 tax year for zip code 42133, filed in 2021:
Average Adjusted Gross Income (AGI) in 2020: $45,375 (Individual Income Tax Returns)
Here:
$45,375
State:
$61,342
Salary/wage: $41,393 (reported on 76.4% of returns)
Here:
$41,393
State:
$50,827
(% of AGI for various income ranges: 1199.3% for AGIs below $25k, 3745.4% for AGIs $25k-50k, 6650.0% for AGIs $50k-75k, 10140.0% for AGIs $75k-100k, 14900.0% for AGIs $100k-200k)
Taxable interest for individuals: $671 (reported on 25.5% of returns)
This zip code:
$671
Kentucky:
$1,441
(% of AGI for various income ranges: 24.3% for AGIs below $25k, 16.9% for AGIs $25k-50k, 54.0% for AGIs $50k-75k, 36.7% for AGIs $100k-200k)
Ordinary dividends: $1,100 (reported on 7.3% of returns)
Here:
$1,100
State:
$7,388
(% of AGI for various income ranges: 33.8% for AGIs $25k-50k)
Net capital gain/loss in AGI: +$5,000 (reported on 12.7% of returns)
Here:
+$5,000
State:
+$19,475
(% of AGI for various income ranges: 85.0% for AGIs below $25k, 770.0% for AGIs $75k-100k)
Profit/loss from business: +$8,045 (reported on 20.0% of returns)
Here:
+$8,045
State:
+$11,386
(% of AGI for various income ranges: 273.6% for AGIs below $25k, 261.5% for AGIs $25k-50k, 324.0% for AGIs $50k-75k)
Taxable individual retirement arrangement distribution: $6,925 (reported on 7.3% of returns)
42133:
$6,925
Kentucky:
$18,941
(% of AGI for various income ranges: 213.1% for AGIs $25k-50k)
Earned income credit: $2,764 (reported on 25.5% of returns)
Here:
$2,764
State:
$2,336
(% of AGI for various income ranges: 175.0% for AGIs below $25k, 109.2% for AGIs $25k-50k)
Percentage of individuals using paid preparers for their 2020 taxes: 96.4%
Here:
96%
State:
94%
(% for various income ranges: 95.2% for AGIs below $25k, 100.0% for AGIs $25k-50k, 100.0% for AGIs $50k-75k, 80.0% for AGIs $75k-100k, 100.0% for AGIs $100k-200k)
Averages for the 2012 tax year for zip code 42133, filed in 2013:
Average Adjusted Gross Income (AGI) in 2012: $34,441 (Individual Income Tax Returns)
Here:
$34,441
State:
$50,814
Salary/wage: $30,764 (reported on 77.8% of returns)
Here:
$30,764
State:
$42,723
(% of AGI for various income ranges: 67.0% for AGIs below $25k, 80.1% for AGIs $25k-50k, 69.5% for AGIs $50k-75k, 133.1% for AGIs $75k-100k)
Taxable interest for individuals: $1,094 (reported on 33.3% of returns)
This zip code:
$1,094
Kentucky:
$1,381
(% of AGI for various income ranges: 2.1% for AGIs below $25k, 1.4% for AGIs $25k-50k, 0.2% for AGIs $50k-75k, 1.6% for AGIs $75k-100k)
Ordinary dividends: $750 (reported on 7.4% of returns)
Here:
$750
State:
$6,239
Net capital gain/loss in AGI: +$3,700 (reported on 18.5% of returns)
Here:
+$3,700
State:
+$11,336
(% of AGI for various income ranges: 2.2% for AGIs below $25k, 1.5% for AGIs $25k-50k, 5.3% for AGIs $50k-75k)
Profit/loss from business: +$9,900 (reported on 18.5% of returns)
Here:
+$9,900
State:
+$10,862
Taxable individual retirement arrangement distribution: $5,200 (reported on 7.4% of returns)
42133:
$5,200
Kentucky:
$14,296
Total itemized deductions: $16,767 (24% of AGI, reported on 16.7% of returns)
Here:
$16,767
State:
$21,160
Here:
24.4% of AGI
State:
20.0% of AGI
(% of AGI for various income ranges: 7.0% for AGIs below $25k, 9.4% for AGIs $25k-50k, 29.0% for AGIs $75k-100k)
Charity contributions: $2,957 (reported on 13.0% of returns)
Here:
$2,957
State:
$4,303
Taxes paid: $5,512 (reported on 14.8% of returns)
42133:
$5,512
State:
$8,496
Earned income credit: $2,379 (reported on 25.9% of returns)
Here:
$2,379
State:
$2,273
(% of AGI for various income ranges: 7.6% for AGIs below $25k, 1.3% for AGIs $25k-50k)
Percentage of individuals using paid preparers for their 2012 taxes: 81.5%
Here:
81%
State:
60%
(% for various income ranges: 81.5% for AGIs below $25k, 81.2% for AGIs $25k-50k, 83.3% for AGIs $50k-75k, 133.3% for AGIs $75k-100k)
Averages for the 2004 tax year for zip code 42133, filed in 2005:
Average Adjusted Gross Income (AGI) in 2004: $27,261 (Individual Income Tax Returns)
Here:
$27,261
State:
$41,540
Salary/wage: $26,912 (reported on 76.6% of returns)
Here:
$26,912
State:
$36,432
(% of AGI for various income ranges: 110.0% for AGIs below $10k, 82.1% for AGIs $10k-25k, 79.8% for AGIs $25k-50k, 82.3% for AGIs $50k-75k, 79.1% for AGIs $75k-100k, 46.3% for AGIs over 100k)
Taxable interest for individuals: $1,323 (reported on 37.8% of returns)
This zip code:
$1,323
Kentucky:
$1,571
(% of AGI for various income ranges: 10.6% for AGIs below $10k, 2.1% for AGIs $10k-25k, 2.0% for AGIs $25k-50k, 1.2% for AGIs $50k-75k, 0.2% for AGIs $75k-100k, 1.1% for AGIs over 100k)
Taxable dividends: $969 (reported on 10.6% of returns)
Here:
$969
State:
$3,453
(% of AGI for various income ranges: 3.0% for AGIs below $10k, 0.5% for AGIs $10k-25k, 0.1% for AGIs $25k-50k, 0.9% for AGIs $50k-75k)
Net capital gain/loss: +$6,427 (reported on 12.4% of returns)
Here:
+$6,427
State:
+$9,663
(% of AGI for various income ranges: 6.0% for AGIs below $10k, 3.0% for AGIs $10k-25k, 2.7% for AGIs $25k-50k, 5.2% for AGIs $50k-75k, 4.6% for AGIs $75k-100k)
Profit/loss from business: +$3,692 (reported on 19.3% of returns)
Here:
+$3,692
State:
+$9,233
Total itemized deductions: $14,289 (23% of AGI, reported on 13.7% of returns)
Here:
$14,289
State:
$17,474
Here:
23.0% of AGI
State:
21.0% of AGI
(% of AGI for various income ranges: 32.6% for AGIs below $10k, 6.3% for AGIs $25k-50k, 5.9% for AGIs $50k-75k, 10.4% for AGIs $75k-100k, 12.1% for AGIs over 100k)
Charity contributions deductions: $2,245 (3% of AGI, reported on 8.7% of returns)
Here:
$2,245
State:
$3,494
Here:
2.9% of AGI
State:
4.0% of AGI
Total tax: $3,336 (reported on 70.1% of returns)
42133:
$3,336
State:
$6,162
(% of AGI for various income ranges: 5.7% for AGIs below $10k, 3.7% for AGIs $10k-25k, 6.3% for AGIs $25k-50k, 9.0% for AGIs $50k-75k, 10.8% for AGIs $75k-100k, 17.6% for AGIs over 100k)
Earned income credit: $1,648 (reported on 26.2% of returns)
Here:
$1,648
State:
$1,723
Percentage of individuals using paid preparers for their 2004 taxes: 83.2%
Here:
83%
State:
66%
(% for various income ranges: 82.2% for AGIs below $10k, 82.2% for AGIs $10k-25k, 84.3% for AGIs $25k-50k, 81.8% for AGIs $50k-75k, 87.5% for AGIs $75k-100k, 93.3% for AGIs over 100k)
Household received Food Stamps/SNAP in the past 12 months: 65 Household did not receive Food Stamps/SNAP in the past 12 months: 487
Women who had a birth in the past 12 months: 17 (17 now married, 0 unmarried) Women who did not have a birth in the past 12 months: 221 (110 now married, 111 unmarried)
Housing units in zip code 42133 with a mortgage: 155 (11 second mortgage, 12 both second mortgage and home equity loan) Houses without a mortgage: 28
Median monthly owner costs for units with a mortgage: $1,055 Median monthly owner costs for units without a mortgage: $396
Residents with income below the poverty level in 2022:
This zip code:
12.7%
Whole state:
16.5%
Residents with income below 50% of the poverty level in 2022:
This zip code:
7.8%
Whole state:
9.0%
Median number of rooms in houses and condos:
Here:
6.1
State:
6.4
Median number of rooms in apartments:
Here:
5.3
State:
4.4
Notable locations in this zip code not listed on our city pages
Churches in zip code 42133 include: Lebanon Church (A), Maple Grove Church (B), White Oak Ridge Church (C), New Design Church (D), Pleasant Home Church (E), Union Church (F), Fountain Run Mennonite Church (G), Capitol Hill Church (H), Wood Church (I). Display/hide their locations on the map
Streams, rivers, and creeks: Benedict Branch (A), Trace Creek (B), Spring Creek (C), Slickrock Branch (D), White Creek (E), Jakes Branch (F), Indian Camp Branch (G), Hunt Branch (H), Grooms Branch (I). Display/hide their locations on the map
Size of family households: 242 2-persons, 105 3-persons, 23 4-persons, 9 5-persons
Size of nonfamily households: 116 1-person, 56 2-persons
96 married couples with children.
26 single-parent households (16 men, 10 women).
98.9% of residents of 42133 zip code speak English at home.
0.8% of residents speak Spanish at home (100% very well).
0.3% of residents speak Asian or Pacific Island language at home (100% very well).
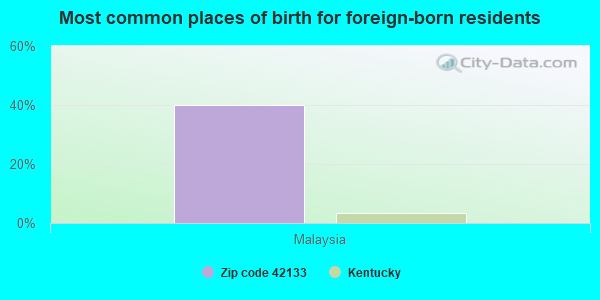
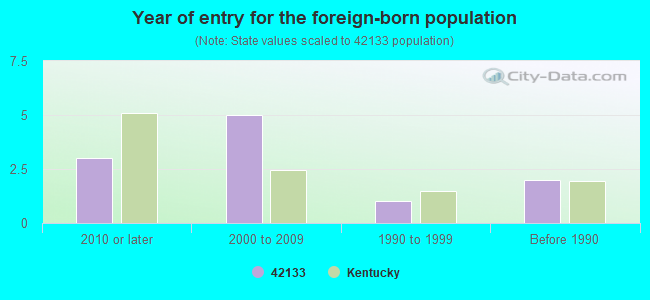
Foreign born population: 4 (0.4%) (0.0% of them are naturalized citizens)
:
0.4%
Whole state:
4.0%
40%Malaysia
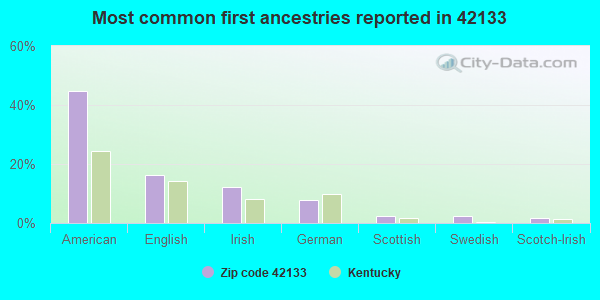
45%American
16%English
12%Irish
8%German
2%Scottish
2%Swedish
2%Scotch-Irish
Year of entry for the foreign-born population
32010 or later
52000 to 2009
11990 to 1999
2Before 1990
Facilities with environmental interests located in this zip code:
CHEVRON COAL CO (OFF HIGHWAY 11 in FOUNT, KY)
AIR MAJOR (AIRS/AFS)
Housing units lacking complete plumbing facilities: 3.4% Housing units lacking complete kitchen facilities: 6.7%
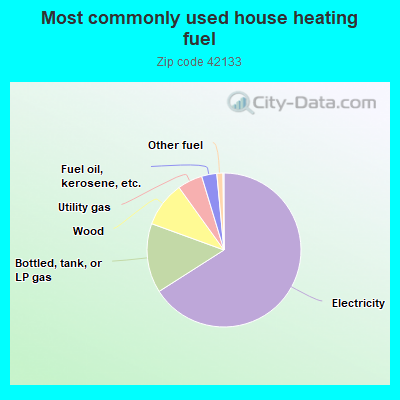
66.5%Electricity
14.7%Bottled, tank, or LP gas
9.6%Wood
5.3%Utility gas
3.2%Fuel oil, kerosene, etc.
1.3%Other fuel
Population in 1990: 1,568.
Place of birth for U.S.-born residents:
This state: 771
Northeast: 32
Midwest: 125
South: 238
64% of the 42133 zip code residents lived in the same house 5 years ago. Out of people who lived in different houses, 42% lived in this county. Out of people who lived in different counties, 50% lived in Kentucky.
96% of the 42133 zip code residents lived in the same house 1 year ago. Out of people who lived in different houses, 3% moved from this county. Out of people who lived in different houses, 51% moved from different county within same state. Out of people who lived in different houses, 51% moved from different state.
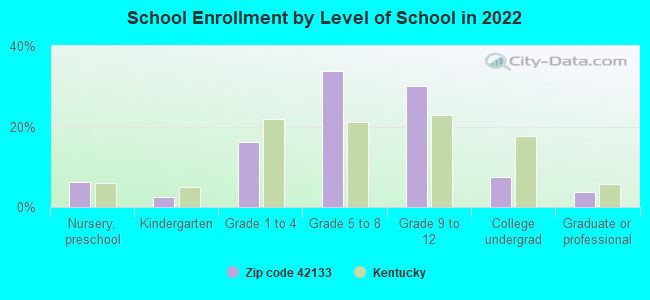
Private vs. public school enrollment:
Students in private schools in grades 1 to 8 (elementary and middle school): 14
Here:
33.5%
Kentucky:
17.2%
Students in private schools in grades 9 to 12 (high school):
Here:
0.0%
Kentucky:
15.2%
Students in private undergraduate colleges:
Here:
0.0%
Kentucky:
19.6%
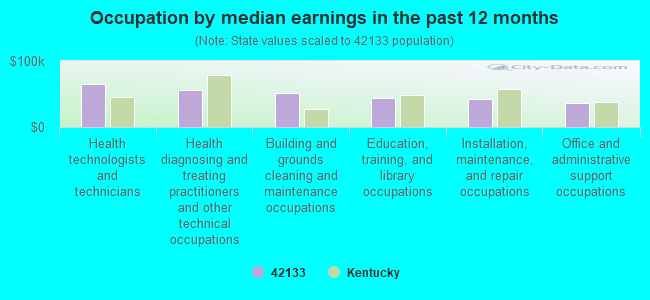
Occupation by median earnings in the past 12 months ($)
65,209Health technologists and technicians
56,142Health diagnosing and treating practitioners and other technical occupations
51,842Building and grounds cleaning and maintenance occupations
44,436Education, training, and library occupations
41,863Installation, maintenance, and repair occupations
35,846Office and administrative support occupations
Top industries in this zip code by the number of employees in 2005:
Other Services (except Public Administration): Religious Organizations (1-4: 3)
Other Services (except Public Administration): Funeral Homes and Funeral Services (1-4: 1)
Construction: Residential Remodelers (1-4: 1)
Construction: New Single-Family Housing Construction (except Operative Builders) (1-4: 1)
Health Care and Social Assistance: All Other Outpatient Care Centers (1-4: 1)
Fatal accident statistics in 2013:
Fatal accident count: 1
Vehicles involved in fatal accidents: 1
Fatal accidents caused by drunken drivers: 0
Fatalities: 1
Persons involved in fatal accidents: 4
Pedestrians involved in fatal accidents: 0
Fatal accident statistics in 2012:
Fatal accident count: 1
Vehicles involved in fatal accidents: 1
Fatal accidents caused by drunken drivers: 1
Fatalities: 1
Persons involved in fatal accidents: 2
Pedestrians involved in fatal accidents: 0
2002 - 2018 National Fire Incident Reporting System (NFIRS) incidents
According to the data from the years 2002 - 2018 the average number of fire incidents per year is 12. The highest number of fire incidents - 28 took place in 2003, and the least - 4 in 2018. The data has a decreasing trend.
When looking into fire subcategories, the most incidents belonged to: Structure Fires (43.1%), and Outside Fires (36.0%).
Fire incident types reported to NFIRS in Zip Code 42133


 Nearest zip codes: 42123, 42153, 42140, 42157, 42156, 37083.
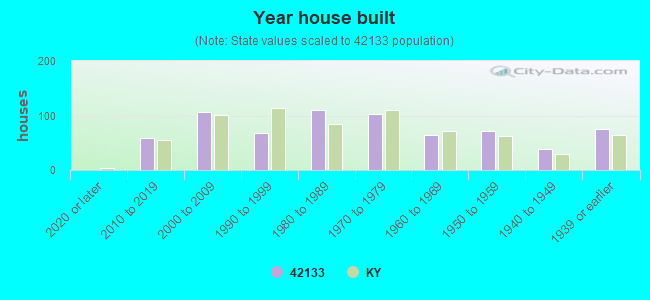


 According to the data from the years 2002 - 2018 the average number of fire incidents per year is 12. The highest number of fire incidents - 28 took place in 2003, and the least - 4 in 2018. The data has a decreasing trend.
 When looking into fire subcategories, the most incidents belonged to: Structure Fires (43.1%), and Outside Fires (36.0%).