Estimated zip code population in 2022: 4,482 Zip code population in 2010: 4,236 Zip code population in 2000: 4,618
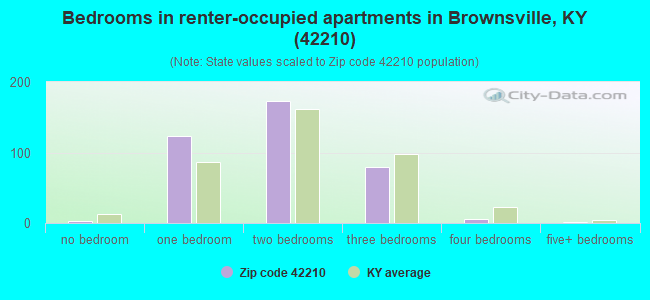
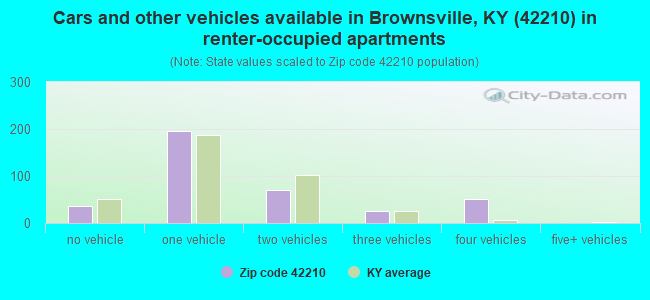
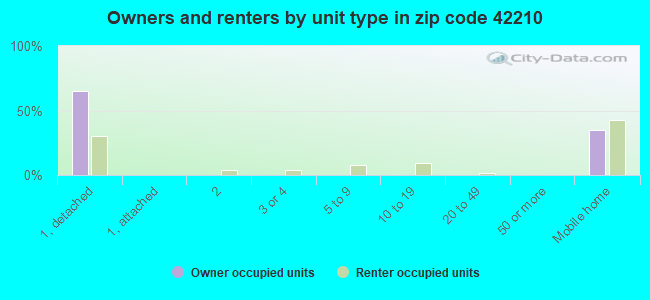
Houses and condos: 2,195 Renter-occupied apartments: 377
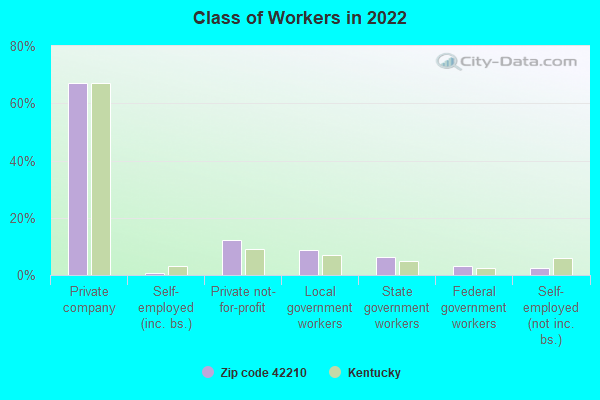
% of renters here:
20%
State:
31%
March 2022 cost of living index in zip code 42210: 80.6 (low, U.S. average is 100)
Land area: 143.9 sq. mi. Water area: 1.3 sq. mi.
Population density: 31 people per square mile
(very low).
OSM Map
General Map
Google Map
MSN Map
OSM Map
General Map
Google Map
MSN Map
OSM Map
General Map
Google Map
MSN Map
OSM Map
General Map
Google Map
MSN Map
Please wait while loading the map...
Real estate property taxes paid for housing units in 2022:
This zip code:
0.7% ($782)
Kentucky:
0.7% ($1,456)
Median real estate property taxes paid for housing units with mortgages in 2022: $965 (0.6%) Median real estate property taxes paid for housing units with no mortgage in 2022: $579 (0.8%)
Business Search- 14 Million verified businesses
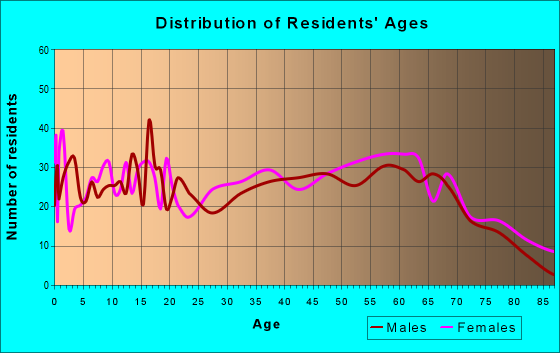
Males: 2,083
(46.5%)
Females: 2,399
(53.5%)
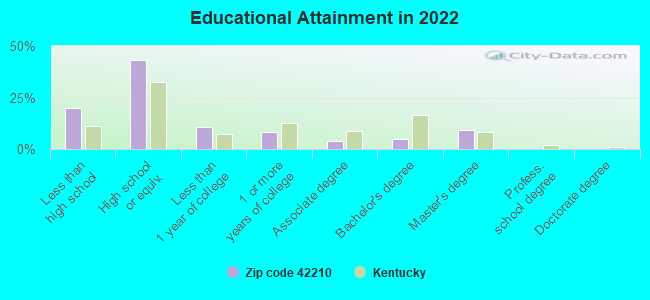
For population 25 years and over in 42210:
High school or higher: 78.5%
Bachelor's degree or higher: 13.7%
Graduate or professional degree: 8.9%
Unemployed: 10.2%
Mean travel time to work (commute): 35.0 minutes
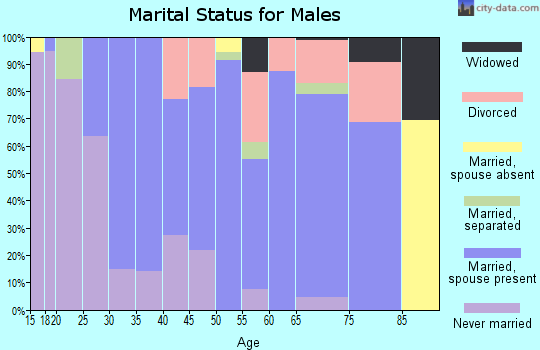
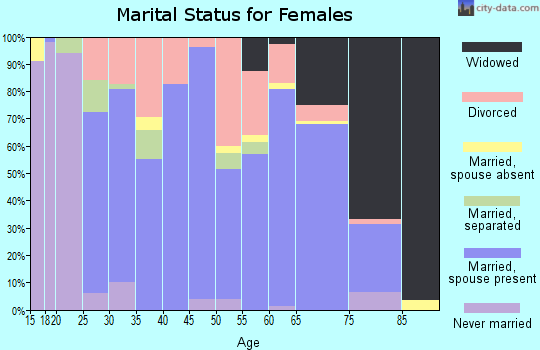
For population 15 years and over in 42210:
Never married: 20.5%
Now married: 56.5%
Separated: 2.8%
Widowed: 10.3%
Divorced: 9.9%
Zip code 42210 compared to state average:
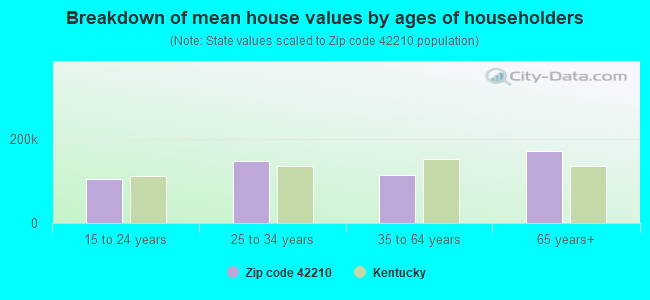
Median house value below state average.
Unemployed percentage above state average.
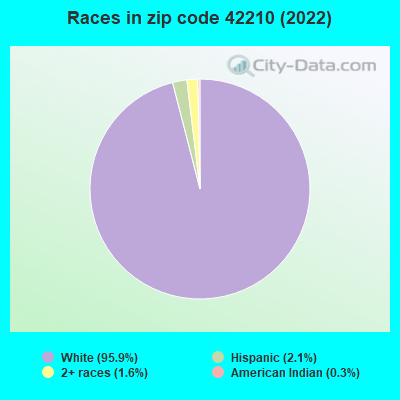
Black race population percentage significantly below state average.
Hispanic race population percentage below state average.
Median age significantly above state average.
Foreign-born population percentage significantly below state average.
Renting percentage below state average.
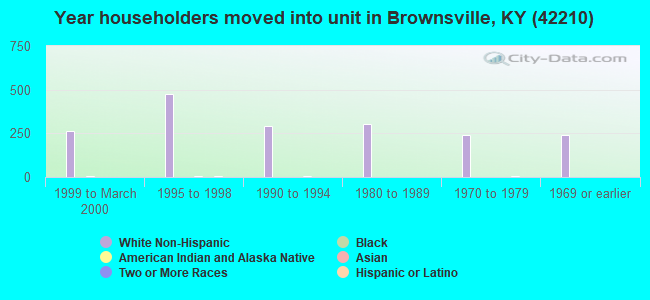
Length of stay since moving in significantly above state average.
Number of college students below state average.
Percentage of population with a bachelor's degree or higher below state average.
Estimated median house/condo value in 2022: $108,242
42210:
$108,242
Kentucky:
$196,300
According to our research of Kentucky and other state lists, there were 3 registered sex offenders living in 42210 zip code as of April 24, 2024. The ratio of all residents to sex offenders in zip code 42210 is 1,277 to 1. The ratio of registered sex offenders to all residents in this zip code is much lower than the state average.
Median resident age:
This zip code:
48.1 years
Kentucky median age:
39.4 years
Average household size:
This zip code:
2.4 people
Kentucky:
2.4 people
Averages for the 2020 tax year for zip code 42210, filed in 2021:
Average Adjusted Gross Income (AGI) in 2020: $46,668 (Individual Income Tax Returns)
Here:
$46,668
State:
$61,342
Salary/wage: $41,657 (reported on 81.0% of returns)
Here:
$41,657
State:
$50,827
(% of AGI for various income ranges: 1162.9% for AGIs below $25k, 3324.6% for AGIs $25k-50k, 6272.3% for AGIs $50k-75k, 9948.2% for AGIs $75k-100k, 17141.2% for AGIs $100k-200k)
Taxable interest for individuals: $1,030 (reported on 28.0% of returns)
This zip code:
$1,030
Kentucky:
$1,441
(% of AGI for various income ranges: 36.9% for AGIs below $25k, 18.5% for AGIs $25k-50k, 30.0% for AGIs $50k-75k, 86.4% for AGIs $75k-100k, 106.2% for AGIs $100k-200k)
Ordinary dividends: $850 (reported on 6.0% of returns)
Here:
$850
State:
$7,388
(% of AGI for various income ranges: 10.5% for AGIs $25k-50k, 15.9% for AGIs $50k-75k, 11.2% for AGIs $100k-200k)
Net capital gain/loss in AGI: +$8,069 (reported on 7.7% of returns)
Here:
+$8,069
State:
+$19,475
(% of AGI for various income ranges: 12.9% for AGIs below $25k, 29.2% for AGIs $25k-50k, 131.4% for AGIs $50k-75k, 122.7% for AGIs $75k-100k, 566.2% for AGIs $100k-200k)
Profit/loss from business: +$5,584 (reported on 18.5% of returns)
Here:
+$5,584
State:
+$11,386
(% of AGI for various income ranges: 148.2% for AGIs below $25k, 106.9% for AGIs $25k-50k, 75.5% for AGIs $50k-75k, 65.5% for AGIs $75k-100k, 511.2% for AGIs $100k-200k)
Taxable individual retirement arrangement distribution: $9,650 (reported on 6.0% of returns)
42210:
$9,650
Kentucky:
$18,941
(% of AGI for various income ranges: 36.0% for AGIs below $25k, 74.1% for AGIs $25k-50k, 467.3% for AGIs $75k-100k)
Total itemized deductions: $27,167 (reported on 1.8% of returns)
Here:
$27,167
State:
$32,473
(% of AGI for various income ranges: 740.9% for AGIs $75k-100k)
Taxes paid: $7,000 (reported on 1.8% of returns)
42210:
$7,000
State:
$7,830
(% of AGI for various income ranges: 190.9% for AGIs $75k-100k)
Earned income credit: $2,277 (reported on 23.2% of returns)
Here:
$2,277
State:
$2,336
(% of AGI for various income ranges: 114.2% for AGIs below $25k, 95.9% for AGIs $25k-50k)
Percentage of individuals using paid preparers for their 2020 taxes: 97.6%
Here:
98%
State:
94%
(% for various income ranges: 96.8% for AGIs below $25k, 97.9% for AGIs $25k-50k, 96.4% for AGIs $50k-75k, 100.0% for AGIs $75k-100k, 115.4% for AGIs $100k-200k, 0.0% for AGIs over 200k)
Averages for the 2012 tax year for zip code 42210, filed in 2013:
Average Adjusted Gross Income (AGI) in 2012: $36,908 (Individual Income Tax Returns)
Here:
$36,908
State:
$50,814
Salary/wage: $33,031 (reported on 82.7% of returns)
Here:
$33,031
State:
$42,723
(% of AGI for various income ranges: 75.2% for AGIs below $25k, 83.8% for AGIs $25k-50k, 81.6% for AGIs $50k-75k, 75.8% for AGIs $75k-100k, 48.2% for AGIs $100k-200k)
Taxable interest for individuals: $1,296 (reported on 28.0% of returns)
This zip code:
$1,296
Kentucky:
$1,381
(% of AGI for various income ranges: 1.5% for AGIs below $25k, 0.6% for AGIs $25k-50k, 1.0% for AGIs $50k-75k, 0.3% for AGIs $75k-100k, 1.6% for AGIs $100k-200k)
Ordinary dividends: $962 (reported on 7.7% of returns)
Here:
$962
State:
$6,239
(% of AGI for various income ranges: 0.1% for AGIs $25k-50k, 0.3% for AGIs $50k-75k, 0.4% for AGIs $100k-200k)
Net capital gain/loss in AGI: +$4,600 (reported on 11.3% of returns)
Here:
+$4,600
State:
+$11,336
(% of AGI for various income ranges: 0.5% for AGIs below $25k, 0.3% for AGIs $25k-50k, 1.4% for AGIs $50k-75k, 4.8% for AGIs $100k-200k)
Profit/loss from business: +$6,403 (reported on 18.5% of returns)
Here:
+$6,403
State:
+$10,862
(% of AGI for various income ranges: 8.8% for AGIs below $25k, 1.2% for AGIs $25k-50k, 0.7% for AGIs $50k-75k, 2.9% for AGIs $75k-100k, 4.9% for AGIs $100k-200k)
Taxable individual retirement arrangement distribution: $7,388 (reported on 4.8% of returns)
42210:
$7,388
Kentucky:
$14,296
(% of AGI for various income ranges: 1.2% for AGIs below $25k, 0.7% for AGIs $25k-50k, 2.4% for AGIs $50k-75k)
Total itemized deductions: $17,400 (25% of AGI, reported on 18.5% of returns)
Here:
$17,400
State:
$21,160
Here:
25.4% of AGI
State:
20.0% of AGI
(% of AGI for various income ranges: 5.1% for AGIs below $25k, 6.8% for AGIs $25k-50k, 9.5% for AGIs $50k-75k, 12.2% for AGIs $75k-100k, 10.8% for AGIs $100k-200k)
Charity contributions: $2,282 (reported on 13.1% of returns)
Here:
$2,282
State:
$4,303
(% of AGI for various income ranges: 0.4% for AGIs $25k-50k, 1.0% for AGIs $50k-75k, 1.3% for AGIs $75k-100k, 1.4% for AGIs $100k-200k)
Taxes paid: $5,233 (reported on 17.9% of returns)
42210:
$5,233
State:
$8,496
(% of AGI for various income ranges: 0.6% for AGIs below $25k, 1.6% for AGIs $25k-50k, 3.0% for AGIs $50k-75k, 4.0% for AGIs $75k-100k, 3.9% for AGIs $100k-200k)
Earned income credit: $2,374 (reported on 25.6% of returns)
Here:
$2,374
State:
$2,273
(% of AGI for various income ranges: 8.3% for AGIs below $25k, 1.3% for AGIs $25k-50k)
Percentage of individuals using paid preparers for their 2012 taxes: 77.4%
Here:
77%
State:
60%
(% for various income ranges: 71.8% for AGIs below $25k, 79.2% for AGIs $25k-50k, 83.3% for AGIs $50k-75k, 90.0% for AGIs $75k-100k, 87.5% for AGIs $100k-200k)
Averages for the 2004 tax year for zip code 42210, filed in 2005:
Average Adjusted Gross Income (AGI) in 2004: $30,102 (Individual Income Tax Returns)
Here:
$30,102
State:
$41,540
Salary/wage: $29,535 (reported on 85.5% of returns)
Here:
$29,535
State:
$36,432
(% of AGI for various income ranges: 136.6% for AGIs below $10k, 80.5% for AGIs $10k-25k, 86.8% for AGIs $25k-50k, 88.7% for AGIs $50k-75k, 78.1% for AGIs $75k-100k, 61.2% for AGIs over 100k)
Taxable interest for individuals: $1,694 (reported on 37.6% of returns)
This zip code:
$1,694
Kentucky:
$1,571
(% of AGI for various income ranges: 9.2% for AGIs below $10k, 2.4% for AGIs $10k-25k, 1.9% for AGIs $25k-50k, 2.0% for AGIs $50k-75k, 0.9% for AGIs $75k-100k, 2.4% for AGIs over 100k)
Taxable dividends: $6,429 (reported on 9.2% of returns)
Here:
$6,429
State:
$3,453
(% of AGI for various income ranges: 2.2% for AGIs below $10k, 0.1% for AGIs $10k-25k, 0.2% for AGIs $25k-50k, 0.3% for AGIs $50k-75k, 2.2% for AGIs $75k-100k, 16.2% for AGIs over 100k)
Net capital gain/loss: +$3,226 (reported on 9.7% of returns)
Here:
+$3,226
State:
+$9,663
(% of AGI for various income ranges: 1.5% for AGIs below $10k, 1.0% for AGIs $10k-25k, 1.3% for AGIs $25k-50k, 0.8% for AGIs $50k-75k, 1.4% for AGIs $75k-100k, 0.3% for AGIs over 100k)
Profit/loss from business: +$4,734 (reported on 18.0% of returns)
Here:
+$4,734
State:
+$9,233
(% of AGI for various income ranges: 24.2% for AGIs below $10k, 4.9% for AGIs $10k-25k, 1.6% for AGIs $25k-50k, -0.2% for AGIs $50k-75k, 1.9% for AGIs $75k-100k, 7.9% for AGIs over 100k)
IRA payment deduction: $2,846 (reported on 1.6% of returns)
42210:
$2,846
Kentucky:
$2,955
Total itemized deductions: $14,143 (25% of AGI, reported on 19.2% of returns)
Here:
$14,143
State:
$17,474
Here:
25.0% of AGI
State:
21.0% of AGI
(% of AGI for various income ranges: 4.3% for AGIs $10k-25k, 8.8% for AGIs $25k-50k, 10.1% for AGIs $50k-75k, 13.4% for AGIs $75k-100k, 12.3% for AGIs over 100k)
Charity contributions deductions: $1,800 (3% of AGI, reported on 14.6% of returns)
Here:
$1,800
State:
$3,494
Here:
3.0% of AGI
State:
4.0% of AGI
(% of AGI for various income ranges: 0.2% for AGIs $10k-25k, 0.5% for AGIs $25k-50k, 0.9% for AGIs $50k-75k, 1.4% for AGIs $75k-100k, 2.8% for AGIs over 100k)
Total tax: $2,967 (reported on 70.9% of returns)
42210:
$2,967
State:
$6,162
(% of AGI for various income ranges: 4.5% for AGIs below $10k, 3.7% for AGIs $10k-25k, 5.3% for AGIs $25k-50k, 7.5% for AGIs $50k-75k, 9.9% for AGIs $75k-100k, 14.9% for AGIs over 100k)
Earned income credit: $1,848 (reported on 23.4% of returns)
Here:
$1,848
State:
$1,723
Percentage of individuals using paid preparers for their 2004 taxes: 80.9%
Here:
81%
State:
66%
(% for various income ranges: 72.5% for AGIs below $10k, 79.8% for AGIs $10k-25k, 85.3% for AGIs $25k-50k, 87.7% for AGIs $50k-75k, 80.0% for AGIs $75k-100k, 84.8% for AGIs over 100k)
Household received Food Stamps/SNAP in the past 12 months: 340 Household did not receive Food Stamps/SNAP in the past 12 months: 1,525
Women who had a birth in the past 12 months: 60 (54 now married, 4 unmarried) Women who did not have a birth in the past 12 months: 774 (411 now married, 364 unmarried)
Housing units in zip code 42210 with a mortgage: 614 (82 second mortgage, 82 both second mortgage and home equity loan) Houses without a mortgage: 32
Median monthly owner costs for units with a mortgage: $1,219 Median monthly owner costs for units without a mortgage: $337
Residents with income below the poverty level in 2022:
This zip code:
19.3%
Whole state:
16.5%
Residents with income below 50% of the poverty level in 2022:
This zip code:
14.5%
Whole state:
9.0%
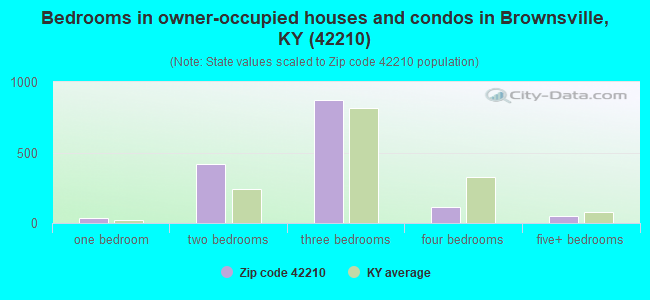
Median number of rooms in houses and condos:
Here:
6.3
State:
6.4
Median number of rooms in apartments:
Here:
4.2
State:
4.4
Notable locations in this zip code not listed on our city pages
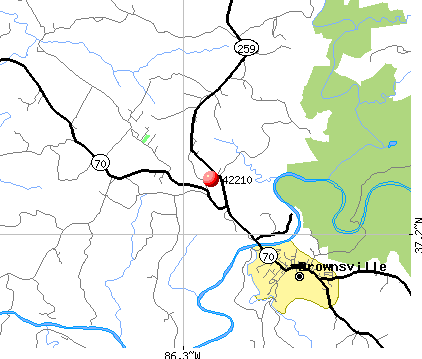
Notable locations in zip code 42210: Camp Joy (A), Grassland (B), Maple Springs Group Campground (C), Houchins Ferry (D), Flint Ridge Ranger Station (E), Fairview (F), Great Onyx Cave Pumphouse (G), Mammoth Cave Volunteer Fire Department (H), Kyrock Fire Department (I), Bear Creek Fire Department (J), Brownsville Fire Department (K), Edmonson County Ambulance Service (L). Display/hide their locations on the map
Churches in zip code 42210 include: Good Spring Church (A), Holly Springs Church (B), Joppa Church (C), Mount Zion Church (D), New Home Church (E), New Liberty Church (F), Oak Grove Church (G), Oak Hill Church (H), Old New Liberty Church (I). Display/hide their locations on the map
Cemeteries: Woolsey Cemetery (1), Little Jordan Cemetery (2), Old Guides Cemetery (3), Oak Grove Cemetery (4), Wilkins Cemetery (5), France Cemetery (6), Gravel Cemetery (7). Display/hide their locations on the map
Streams, rivers, and creeks: Dry Branch (A), Bear Creek (B), Beaverdam Creek (C), Blair Spring Branch (D), Blowing Spring Branch (E), Watery Branch (F), Cub Creek (G), Crooked Branch (H), Ugly Creek (I). Display/hide their locations on the map
In group quarters: 83 (-1 institutionalized population)
Size of family households: 706 2-persons, 339 3-persons, 148 4-persons, 62 5-persons, 6 6-persons, 46 7-or-more-persons
Size of nonfamily households: 479 1-person, 74 2-persons
530 married couples with children.
164 single-parent households (99 men, 65 women).
95.4% of residents of 42210 zip code speak English at home.
1.3% of residents speak Spanish at home (100% very well).
3.9% of residents speak other Indo-European language at home (86% very well, 14% well).
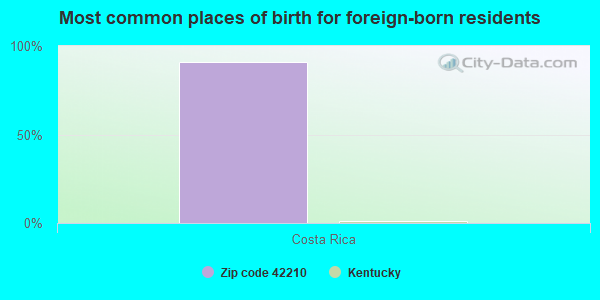
Foreign born population: 10 (0.2%) (0.0% of them are naturalized citizens)
:
0.2%
Whole state:
4.0%
91%Costa Rica
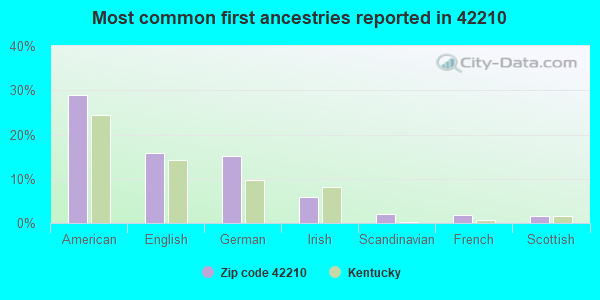
29%American
16%English
15%German
6%Irish
2%Scandinavian
2%French
2%Scottish
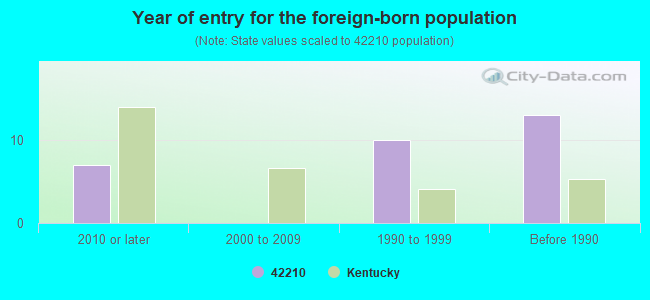
Year of entry for the foreign-born population
72010 or later
02000 to 2009
101990 to 1999
13Before 1990
Facilities with environmental interests located in this zip code:
KYDD ENERGY, INC. (DARRELL MARTIN #1) (MAIN CROSS ST in BROWNSVILLE, KY)
(Integrated Compliance Information System) - ICIS-04-1999-0148, FORMAL ENFORCEMENT ACTION, ICIS-04-1999-0210,
AT & T (1.5 MILE WEST OF HWY 259 in BROWNSVILLE, KY)
(Resource Conservation and Recovery Act (tracking hazardous waste)) Organizations: A T & T (CONTACT/OWNER)
BROWNSVILLE SHELL (HIGHWAY 259 in BROWNSVILLE, KY)
(Resource Conservation and Recovery Act (tracking hazardous waste)) Organizations: BROWNING OIL COMPANY (CONTACT/OWNER)
BROWNSVILLE STP (YORK ST in BROWNSVILLE, KY)
National Pollutant Discharge Elimination System NON-MAJOR (Tracking pollutant discharge elimination systems) - permit Business SIC classification: SEWERAGE SYSTEMS
MINIT MART #91 (101 HOUCHENS FERRY RD in BROWNSVILLE, KY)
(Resource Conservation and Recovery Act (tracking hazardous waste)) Organizations: MINIT MART FOODS, INC. (CONTACT/OWNER)
PORKY PIG DINER (HWY422/259 INTERSTATE in BROWNVILLE, KY)
(Resource Conservation and Recovery Act (tracking hazardous waste)) Organizations: JIM HOLDER (CONTACT/OWNER)
Housing units lacking complete plumbing facilities: 4.7% Housing units lacking complete kitchen facilities: 5.6%
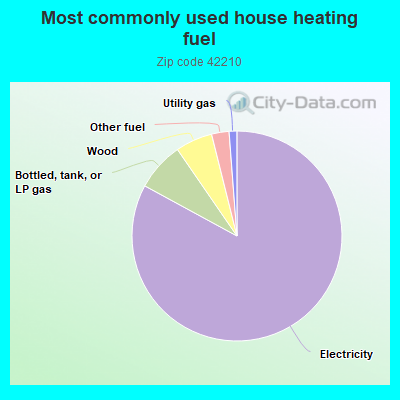
83.1%Electricity
7.5%Bottled, tank, or LP gas
5.7%Wood
2.7%Other fuel
1.2%Utility gas
Population in 1990: 2,296. Population change in the 1990s: +2,322 (+101.1%).
Place of birth for U.S.-born residents:
This state: 3,718
Northeast: 61
Midwest: 288
South: 277
West: 78
64% of the 42210 zip code residents lived in the same house 5 years ago. Out of people who lived in different houses, 52% lived in this county. Out of people who lived in different counties, 50% lived in Kentucky.
91% of the 42210 zip code residents lived in the same house 1 year ago. Out of people who lived in different houses, 57% moved from this county. Out of people who lived in different houses, 35% moved from different county within same state. Out of people who lived in different houses, 6% moved from different state.
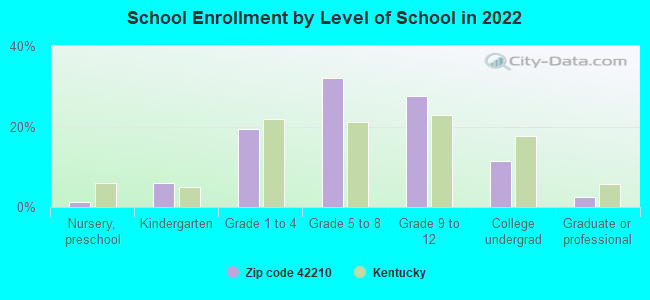
Private vs. public school enrollment:
Students in private schools in grades 1 to 8 (elementary and middle school): 115
Here:
28.2%
Kentucky:
17.2%
Students in private schools in grades 9 to 12 (high school): 4
Here:
2.1%
Kentucky:
15.2%
Students in private undergraduate colleges:
Here:
0.0%
Kentucky:
19.6%
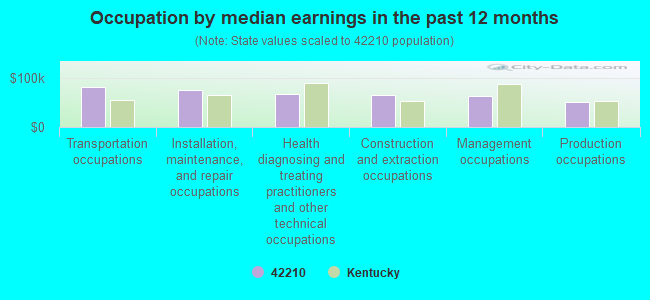
Occupation by median earnings in the past 12 months ($)
81,674Transportation occupations
74,007Installation, maintenance, and repair occupations
66,879Health diagnosing and treating practitioners and other technical occupations
64,589Construction and extraction occupations
63,492Management occupations
50,954Production occupations
Companies with federal contracts located in this zip code:
OLA WEBB (1403 POPLAR SPRINGS RD in BROWNSVILLE, KY; small business) : $148,878 in 7 contractsfrom 2003 to 2006
Contracts for Facilities Operations Support Services by Army, U.S. Army Corps of Engineers - civil program financing only Signed by year:2000: $0; 2001: $0; 2002: $0; 2003: $84,240; 2004: $42,768; 2005: $0; 2006: $21,870.
Biggest contracts:
$42,120 with Army for Facilities Operations Support Services. Signed on 2003-12-16. Completion date: 2004-12-31.
$42,120 with U.S. Army Corps of Engineers - civil program financing only for Facilities Operations Support Services. Signed on 2003-12-16. Completion date: 2004-12-31.
$21,870 with Army for Facilities Operations Support Services. Signed on 2006-05-03. Completion date: 2005-12-31.
$21,384 with U.S. Army Corps of Engineers - civil program financing only for Facilities Operations Support Services. Signed on 2004-12-30. Completion date: 2005-12-31.
Top industries in this zip code by the number of employees in 2005:
Health Care and Social Assistance: Nursing Care Facilities (50-99 employees: 1 establishment)
Health Care and Social Assistance: Home Health Care Services (20-49: 1)
Accommodation and Food Services: Limited-Service Restaurants (10-19: 1, 5-9: 1)
Finance and Insurance: Insurance Agencies and Brokerages (5-9: 1, 1-4: 5)
Health Care and Social Assistance: Offices of Dentists (10-19: 1, 1-4: 1)
Construction: Plumbing, Heating, and Air-Conditioning Contractors (10-19: 1)
People in group quarters in 2010:
92 people in nursing facilities/skilled-nursing facilities
People in group quarters in 2000:
89 people in nursing homes
Fatal accident statistics in 2014:
Fatal accident count: 1
Vehicles involved in fatal accidents: 2
Fatal accidents caused by drunken drivers: 0
Fatalities: 1
Persons involved in fatal accidents: 2
Pedestrians involved in fatal accidents: 0
Fatal accident statistics in 2012:
Fatal accident count: 2
Vehicles involved in fatal accidents: 4
Fatal accidents caused by drunken drivers: 0
Fatalities: 2
Persons involved in fatal accidents: 5
Pedestrians involved in fatal accidents: 0
2002 - 2018 National Fire Incident Reporting System (NFIRS) incidents
According to the data from the years 2002 - 2018 the average number of fires per year is 30. The highest number of reported fires - 74 took place in 2014, and the least - 5 in 2002. The data has an increasing trend.
When looking into fire subcategories, the most reports belonged to: Outside Fires (42.2%), and Structure Fires (41.6%).
Fire incident types reported to NFIRS in Zip Code 42210


 Nearest zip codes: 42285, 42207, 42259, 42163, 42729, 42171.
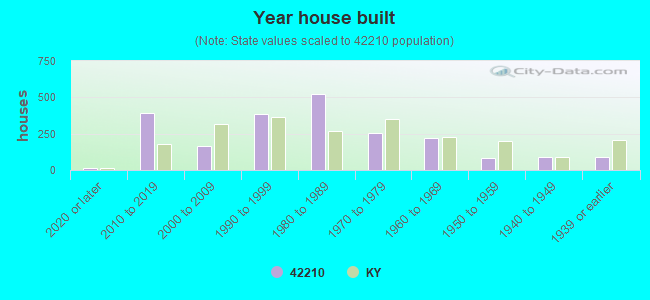


 According to the data from the years 2002 - 2018 the average number of fires per year is 30. The highest number of reported fires - 74 took place in 2014, and the least - 5 in 2002. The data has an increasing trend.
 When looking into fire subcategories, the most reports belonged to: Outside Fires (42.2%), and Structure Fires (41.6%).