Estimated zip code population in 2022: 753 Zip code population in 2010: 929 Zip code population in 2000: 817
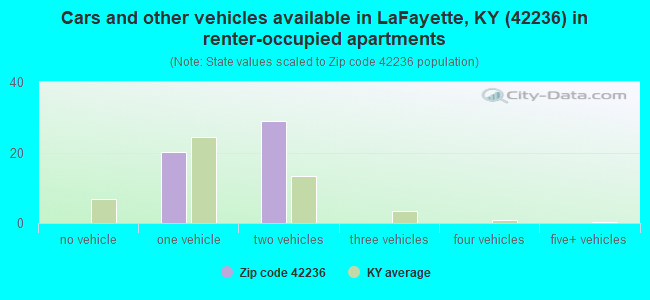
Houses and condos: 307 Renter-occupied apartments: 49
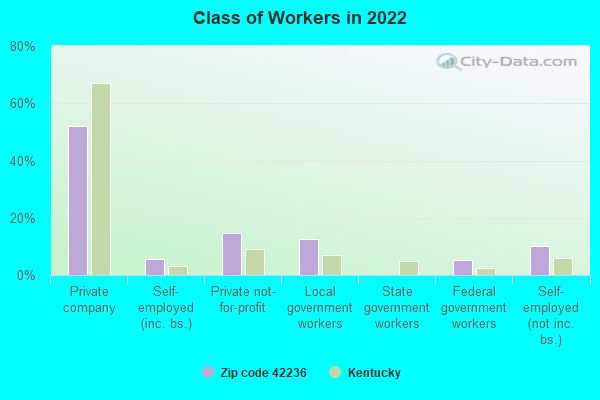
% of renters here:
18%
State:
31%
March 2022 cost of living index in zip code 42236: 81.1 (low, U.S. average is 100)
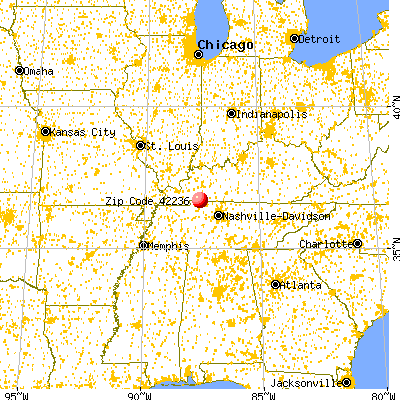
Land area: 66.4 sq. mi. Water area: 0.7 sq. mi.
Population density: 11 people per square mile
(very low).
OSM Map
General Map
Google Map
MSN Map
OSM Map
General Map
Google Map
MSN Map
OSM Map
General Map
Google Map
MSN Map
OSM Map
General Map
Google Map
MSN Map
Please wait while loading the map...
Real estate property taxes paid for housing units in 2022:
This zip code:
0.7% ($858)
Kentucky:
0.7% ($1,456)
Median real estate property taxes paid for housing units with mortgages in 2022: $1,257 (0.9%) Median real estate property taxes paid for housing units with no mortgage in 2022: $556 (0.5%)
Business Search- 14 Million verified businesses
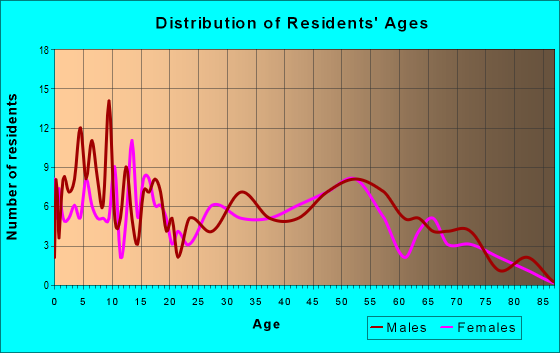
Males: 425
(56.5%)
Females: 327
(43.5%)
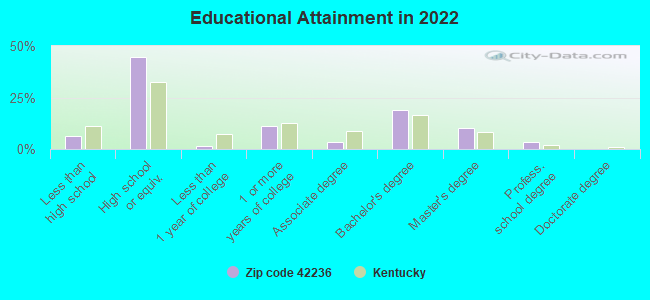
For population 25 years and over in 42236:
High school or higher: 94.0%
Bachelor's degree or higher: 32.7%
Graduate or professional degree: 13.8%
Mean travel time to work (commute): 23.0 minutes
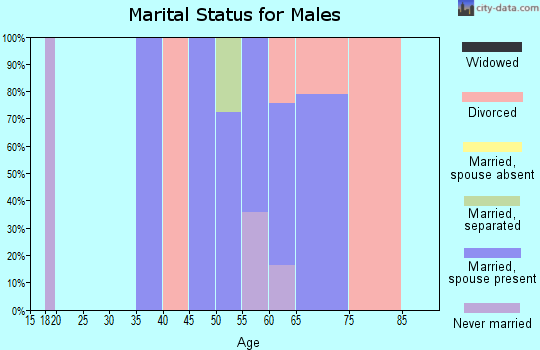
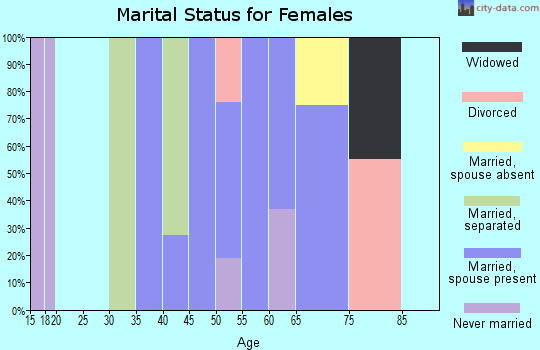
For population 15 years and over in 42236:
Never married: 13.7%
Now married: 71.6%
Separated: 0.0%
Widowed: 5.6%
Divorced: 9.1%
Zip code 42236 compared to state average:
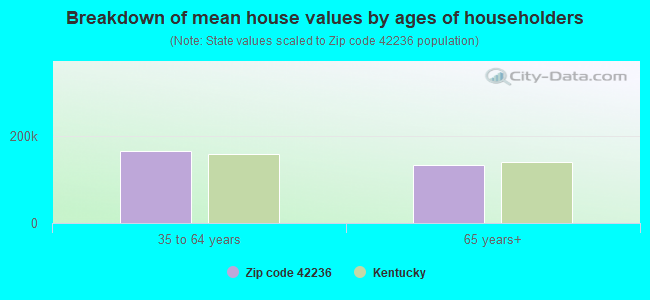
Median house value below state average.
Unemployed percentage significantly below state average.
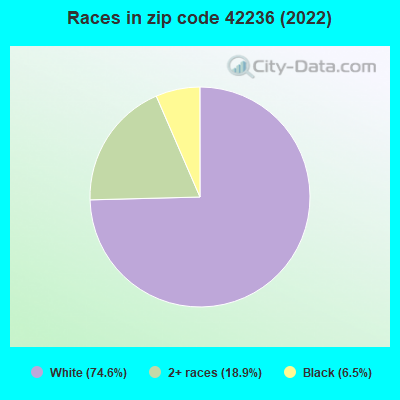
Hispanic race population percentage significantly below state average.
Median age above state average.
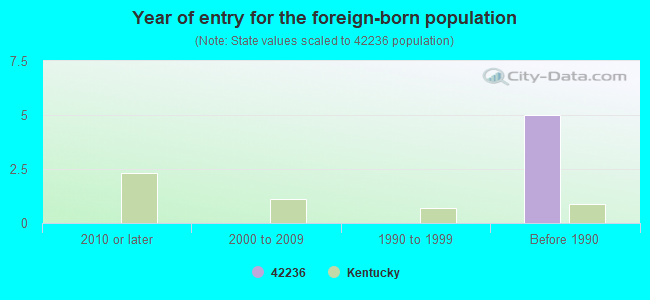
Foreign-born population percentage significantly below state average.
Averages for the 2020 tax year for zip code 42236, filed in 2021:
Average Adjusted Gross Income (AGI) in 2020: $66,435 (Individual Income Tax Returns)
Here:
$66,435
State:
$61,342
Salary/wage: $46,861 (reported on 70.0% of returns)
Here:
$46,861
State:
$50,827
(% of AGI for various income ranges: 1017.5% for AGIs below $25k, 4071.4% for AGIs $25k-50k, 5427.5% for AGIs $50k-75k, 7580.0% for AGIs $75k-100k, 25060.0% for AGIs $100k-200k)
Taxable interest for individuals: $4,336 (reported on 27.5% of returns)
This zip code:
$4,336
Kentucky:
$1,441
(% of AGI for various income ranges: 44.3% for AGIs $25k-50k, 95.0% for AGIs $50k-75k, 2040.0% for AGIs $100k-200k)
Ordinary dividends: $4,600 (reported on 17.5% of returns)
Here:
$4,600
State:
$7,388
(% of AGI for various income ranges: 158.6% for AGIs $25k-50k, 1055.0% for AGIs $100k-200k)
Net capital gain/loss in AGI: +$11,850 (reported on 15.0% of returns)
Here:
+$11,850
State:
+$19,475
(% of AGI for various income ranges: 174.3% for AGIs $25k-50k, 2945.0% for AGIs $100k-200k)
Profit/loss from business: +$9,986 (reported on 17.5% of returns)
Here:
+$9,986
State:
+$11,386
(% of AGI for various income ranges: 206.2% for AGIs below $25k, 685.7% for AGIs $25k-50k, 180.0% for AGIs $75k-100k)
Taxable individual retirement arrangement distribution: $6,600 (reported on 7.5% of returns)
42236:
$6,600
Kentucky:
$18,941
(% of AGI for various income ranges: 282.9% for AGIs $25k-50k)
Taxes paid: $5,300 (reported on 5.0% of returns)
42236:
$5,300
State:
$7,830
(% of AGI for various income ranges: 151.4% for AGIs $25k-50k)
Earned income credit: $2,617 (reported on 15.0% of returns)
Here:
$2,617
State:
$2,336
(% of AGI for various income ranges: 128.8% for AGIs below $25k, 77.1% for AGIs $25k-50k)
Percentage of individuals using paid preparers for their 2020 taxes: 87.5%
Here:
88%
State:
94%
(% for various income ranges: 83.3% for AGIs below $25k, 83.3% for AGIs $25k-50k, 100.0% for AGIs $50k-75k, 100.0% for AGIs $75k-100k, 83.3% for AGIs $100k-200k)
Averages for the 2012 tax year for zip code 42236, filed in 2013:
Average Adjusted Gross Income (AGI) in 2012: $64,647 (Individual Income Tax Returns)
Here:
$64,647
State:
$50,814
Salary/wage: $41,997 (reported on 78.9% of returns)
Here:
$41,997
State:
$42,723
(% of AGI for various income ranges: 67.2% for AGIs below $25k, 75.6% for AGIs $25k-50k, 72.7% for AGIs $50k-75k, 68.6% for AGIs $75k-100k, 29.4% for AGIs $100k-200k)
Taxable interest for individuals: $2,323 (reported on 34.2% of returns)
This zip code:
$2,323
Kentucky:
$1,381
(% of AGI for various income ranges: 1.7% for AGIs below $25k, 0.6% for AGIs $25k-50k, 0.3% for AGIs $50k-75k, 0.6% for AGIs $75k-100k, 1.8% for AGIs $100k-200k)
Ordinary dividends: $2,600 (reported on 18.4% of returns)
Here:
$2,600
State:
$6,239
(% of AGI for various income ranges: 2.6% for AGIs below $25k, 0.4% for AGIs $50k-75k, 1.0% for AGIs $100k-200k)
Net capital gain/loss in AGI: +$12,788 (reported on 21.1% of returns)
Here:
+$12,788
State:
+$11,336
(% of AGI for various income ranges: 4.1% for AGIs below $25k, 1.2% for AGIs $50k-75k, 7.7% for AGIs $100k-200k)
Profit/loss from business: +$12,800 (reported on 13.2% of returns)
Here:
+$12,800
State:
+$10,862
Taxable individual retirement arrangement distribution: $8,367 (reported on 7.9% of returns)
42236:
$8,367
Kentucky:
$14,296
Total itemized deductions: $21,560 (18% of AGI, reported on 26.3% of returns)
Here:
$21,560
State:
$21,160
Here:
17.7% of AGI
State:
20.0% of AGI
(% of AGI for various income ranges: 13.4% for AGIs $25k-50k, 19.8% for AGIs $50k-75k, 7.7% for AGIs $100k-200k)
Charity contributions: $7,000 (reported on 18.4% of returns)
Here:
$7,000
State:
$4,303
Taxes paid: $7,080 (reported on 26.3% of returns)
42236:
$7,080
State:
$8,496
(% of AGI for various income ranges: 1.9% for AGIs $25k-50k, 4.8% for AGIs $50k-75k, 3.8% for AGIs $100k-200k)
Earned income credit: $2,014 (reported on 18.4% of returns)
Here:
$2,014
State:
$2,273
(% of AGI for various income ranges: 4.5% for AGIs below $25k, 1.7% for AGIs $25k-50k)
Percentage of individuals using paid preparers for their 2012 taxes: 63.2%
Here:
63%
State:
60%
(% for various income ranges: 53.8% for AGIs below $25k, 63.6% for AGIs $25k-50k, 66.7% for AGIs $50k-75k, 75.0% for AGIs $75k-100k, 75.0% for AGIs $100k-200k)
Averages for the 2004 tax year for zip code 42236, filed in 2005:
Average Adjusted Gross Income (AGI) in 2004: $68,987 (Individual Income Tax Returns)
Here:
$68,987
State:
$41,540
Salary/wage: $37,471 (reported on 81.6% of returns)
Here:
$37,471
State:
$36,432
(% of AGI for various income ranges: 79.6% for AGIs below $10k, 68.3% for AGIs $10k-25k, 84.5% for AGIs $25k-50k, 82.6% for AGIs $50k-75k, 80.2% for AGIs $75k-100k, 15.0% for AGIs over 100k)
Taxable interest for individuals: $5,568 (reported on 45.1% of returns)
This zip code:
$5,568
Kentucky:
$1,571
(% of AGI for various income ranges: 11.6% for AGIs below $10k, 2.1% for AGIs $10k-25k, 0.8% for AGIs $25k-50k, 1.5% for AGIs $50k-75k, 0.8% for AGIs $75k-100k, 5.4% for AGIs over 100k)
Taxable dividends: $4,356 (reported on 24.0% of returns)
Here:
$4,356
State:
$3,453
(% of AGI for various income ranges: 1.5% for AGIs below $10k, 0.7% for AGIs $10k-25k, 0.5% for AGIs $25k-50k, 0.8% for AGIs $50k-75k, 2.3% for AGIs over 100k)
Profit/loss from business: +$661 (reported on 14.9% of returns)
Here:
+$661
State:
+$9,233
(% of AGI for various income ranges: 3.3% for AGIs below $10k, 5.0% for AGIs $10k-25k, -1.3% for AGIs $25k-50k, -0.2% for AGIs $50k-75k)
Total itemized deductions: $21,766 (11% of AGI, reported on 25.1% of returns)
Here:
$21,766
State:
$17,474
Here:
11.5% of AGI
State:
21.0% of AGI
(% of AGI for various income ranges: 12.0% for AGIs $10k-25k, 6.2% for AGIs $25k-50k, 9.3% for AGIs $50k-75k, 10.7% for AGIs $75k-100k, 7.3% for AGIs over 100k)
Charity contributions deductions: $8,132 (4% of AGI, reported on 20.3% of returns)
Here:
$8,132
State:
$3,494
Here:
3.6% of AGI
State:
4.0% of AGI
(% of AGI for various income ranges: 1.1% for AGIs $25k-50k, 2.9% for AGIs $50k-75k, 2.4% for AGIs $75k-100k, 2.9% for AGIs over 100k)
Total tax: $15,269 (reported on 75.5% of returns)
42236:
$15,269
State:
$6,162
(% of AGI for various income ranges: 4.0% for AGIs below $10k, 4.3% for AGIs $10k-25k, 6.4% for AGIs $25k-50k, 9.4% for AGIs $50k-75k, 8.9% for AGIs $75k-100k, 24.1% for AGIs over 100k)
Earned income credit: $1,645 (reported on 16.5% of returns)
Here:
$1,645
State:
$1,723
Percentage of individuals using paid preparers for their 2004 taxes: 70.1%
Here:
70%
State:
66%
(% for various income ranges: 63.2% for AGIs below $10k, 75.3% for AGIs $10k-25k, 69.1% for AGIs $25k-50k, 70.8% for AGIs $50k-75k, 68.0% for AGIs $75k-100k, 78.9% for AGIs over 100k)
Household received Food Stamps/SNAP in the past 12 months: 4 Household did not receive Food Stamps/SNAP in the past 12 months: 263
Women who had a birth in the past 12 months: 5 (5 now married, 0 unmarried) Women who did not have a birth in the past 12 months: 84 (77 now married, 7 unmarried)
Housing units in zip code 42236 with a mortgage: 106 (5 second mortgage) Houses without a mortgage: 17
Median monthly owner costs for units with a mortgage: $1,248 Median monthly owner costs for units without a mortgage: $479
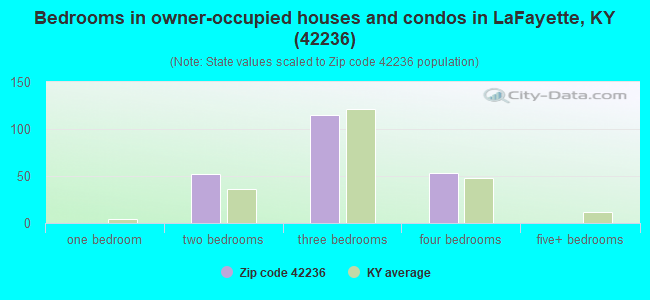
Median number of rooms in houses and condos:
Here:
6.1
State:
6.4
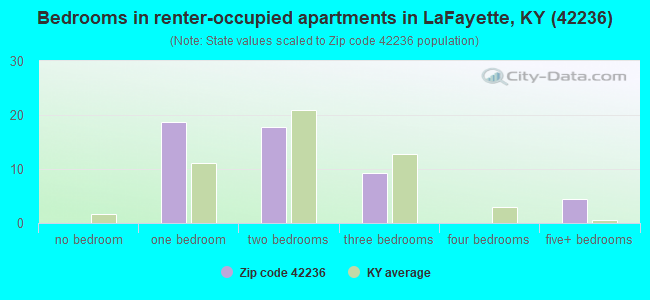
Median number of rooms in apartments:
Here:
4.4
State:
4.4
Notable locations in this zip code not listed on our city pages
Churches in zip code 42236 include: Flat Lick Church (A), Zion Hope Church (B), Little River Baptist Church (C), Little River Church (D), New Asia Church (E), Olivet Baptist Church (F), Rich Church (G), Spring Hill Church (H). Display/hide their locations on the map
Cemeteries: Major Cemetery (1), Carter Cemetery (2), Stapp Cemetery (3), Dawson Cemetery (4), Double Barn Cemetery (5), Northington Cemetery (6), Elliott Cemetery (7). Display/hide their locations on the map
Size of family households: 110 2-persons, 11 3-persons, 41 4-persons, 10 5-persons, 4 7-or-more-persons
Size of nonfamily households: 81 1-person, 7 3-persons
244 married couples with children.
0 single-parent households ().
95.2% of residents of 42236 zip code speak English at home.
4.9% of residents speak other Indo-European language at home (60% very well, 26% well, 14% not well).
Foreign born population: 0 (0.0%)
:
0.0%
Whole state:
4.0%
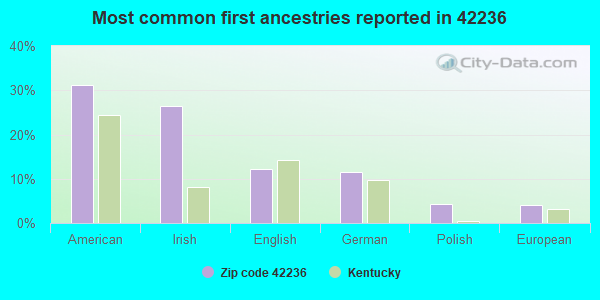
31%American
26%Irish
12%English
11%German
4%Polish
4%European
Year of entry for the foreign-born population
02010 or later
02000 to 2009
01990 to 1999
5Before 1990
Facilities with environmental interests located in this zip code:
SOUTH CHRISTIAN ELEMENTARY SCHOOL (12340 HERNDON-OAK GROVE RD in HERNDON, KY)
(National Center for Education Statistics) - STATE ID-024115170 Organizations: CHRISTIAN COUNTY (SCHOOL DISTRICT)
Housing units lacking complete plumbing facilities: 2.2% Housing units lacking complete kitchen facilities: 2.1%
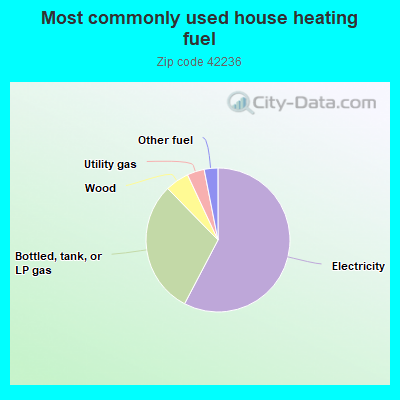
58.1%Electricity
30.2%Bottled, tank, or LP gas
5.4%Wood
3.9%Utility gas
3.1%Other fuel
Population in 1990: 810. Population change in the 1990s: +7 (+0.9%).
Place of birth for U.S.-born residents:
This state: 409
Northeast: 44
Midwest: 66
South: 232
69% of the 42236 zip code residents lived in the same house 5 years ago. Out of people who lived in different houses, 42% lived in this county. Out of people who lived in different counties, 50% lived in Kentucky.
96% of the 42236 zip code residents lived in the same house 1 year ago. Out of people who lived in different houses, 118% moved from different state.
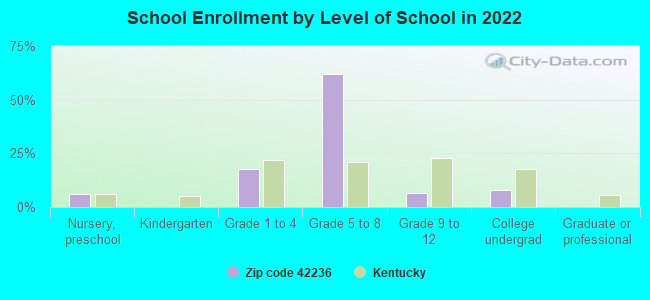
Private vs. public school enrollment:
Students in private schools in grades 1 to 8 (elementary and middle school): 175
Here:
79.3%
Kentucky:
17.2%
Students in private schools in grades 9 to 12 (high school): 16
Here:
100.0%
Kentucky:
15.2%
Students in private undergraduate colleges: 10
Here:
50.8%
Kentucky:
19.6%
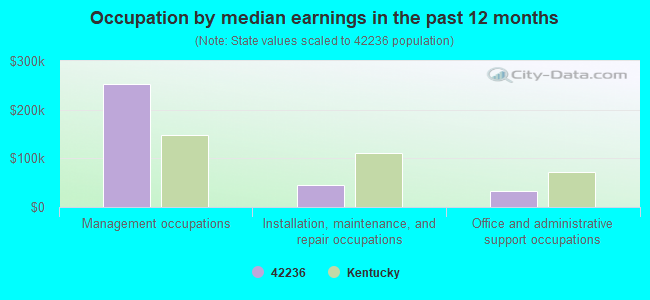
Occupation by median earnings in the past 12 months ($)
252,553Management occupations
46,127Installation, maintenance, and repair occupations
32,809Office and administrative support occupations
Top industries in this zip code by the number of employees in 2005:
Health Care and Social Assistance: Other Residential Care Facilities (10-19 employees: 1 establishment)
Other Services (except Public Administration): Religious Organizations (1-4: 2)
Construction: Electrical Contractors (1-4: 1)
Professional, Scientific, and Technical Services: Engineering Services (1-4: 1)
Fatal accident statistics in 2012:
Fatal accident count: 1
Vehicles involved in fatal accidents: 2
Fatal accidents caused by drunken drivers: 0
Fatalities: 1
Persons involved in fatal accidents: 3
Pedestrians involved in fatal accidents: 0
Fatal accident statistics in 2010:
Fatal accident count: 1
Vehicles involved in fatal accidents: 2
Fatal accidents caused by drunken drivers: 0
Fatalities: 1
Persons involved in fatal accidents: 4
Pedestrians involved in fatal accidents: 0
Home Mortgage Disclosure Act Aggregated Statistics For Year 2009 (Based on 4 partial tracts)
A) FHA, FSA/RHS & VA Home Purchase Loans
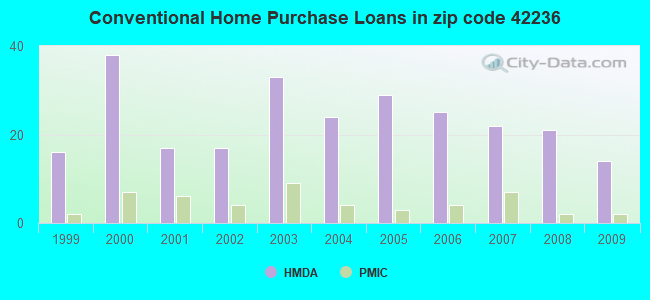
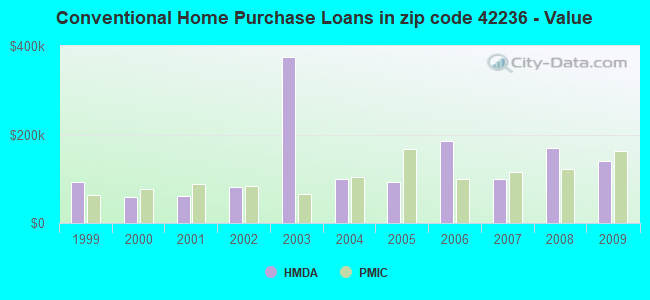
B) Conventional Home Purchase Loans
C) Refinancings
D) Home Improvement Loans
F) Non-occupant Loans on < 5 Family Dwellings (A B C & D)
G) Loans On Manufactured Home Dwelling (A B C & D)
Number
Average Value
Number
Average Value
Number
Average Value
Number
Average Value
Number
Average Value
Number
Average Value
LOANS ORIGINATED
28
$142,636
14
$141,149
55
$152,955
3
$44,480
6
$122,558
2
$44,010
APPLICATIONS APPROVED, NOT ACCEPTED
1
$143,850
3
$100,003
3
$87,700
0
$0
0
$0
0
$0
APPLICATIONS DENIED
2
$153,710
2
$311,965
20
$170,446
3
$46,690
1
$22,970
0
$0
APPLICATIONS WITHDRAWN
1
$91,870
2
$179,815
9
$176,767
2
$61,990
1
$57,730
0
$0
FILES CLOSED FOR INCOMPLETENESS
0
$0
1
$22,710
3
$370,357
0
$0
1
$354,900
1
$22,710
Aggregated Statistics For Year 2008 (Based on 4 partial tracts)
A) FHA, FSA/RHS & VA Home Purchase Loans
B) Conventional Home Purchase Loans
C) Refinancings
D) Home Improvement Loans
F) Non-occupant Loans on < 5 Family Dwellings (A B C & D)
G) Loans On Manufactured Home Dwelling (A B C & D)
Number
Average Value
Number
Average Value
Number
Average Value
Number
Average Value
Number
Average Value
Number
Average Value
LOANS ORIGINATED
26
$130,021
21
$168,550
42
$130,198
6
$29,023
8
$82,219
2
$107,890
APPLICATIONS APPROVED, NOT ACCEPTED
1
$57,730
1
$53,000
2
$57,730
1
$71,930
0
$0
0
$0
APPLICATIONS DENIED
2
$105,525
1
$209,700
27
$123,669
3
$38,223
0
$0
3
$87,880
APPLICATIONS WITHDRAWN
1
$100,320
2
$161,360
12
$145,982
0
$0
1
$52,050
1
$90,850
FILES CLOSED FOR INCOMPLETENESS
0
$0
0
$0
2
$77,130
0
$0
0
$0
0
$0
Aggregated Statistics For Year 2007 (Based on 4 partial tracts)
A) FHA, FSA/RHS & VA Home Purchase Loans
B) Conventional Home Purchase Loans
C) Refinancings
D) Home Improvement Loans
F) Non-occupant Loans on < 5 Family Dwellings (A B C & D)
G) Loans On Manufactured Home Dwelling (A B C & D)
Number
Average Value
Number
Average Value
Number
Average Value
Number
Average Value
Number
Average Value
Number
Average Value
LOANS ORIGINATED
29
$144,016
22
$99,845
38
$106,943
5
$32,106
4
$76,658
4
$49,685
APPLICATIONS APPROVED, NOT ACCEPTED
1
$135,340
2
$104,575
5
$104,482
1
$2,550
0
$0
0
$0
APPLICATIONS DENIED
4
$114,515
7
$90,633
21
$72,648
6
$15,800
0
$0
4
$42,565
APPLICATIONS WITHDRAWN
2
$92,745
4
$143,615
6
$141,185
1
$127,760
1
$29,340
0
$0
FILES CLOSED FOR INCOMPLETENESS
0
$0
1
$354,900
2
$82,810
0
$0
0
$0
0
$0
Aggregated Statistics For Year 2006 (Based on 4 partial tracts)
A) FHA, FSA/RHS & VA Home Purchase Loans
B) Conventional Home Purchase Loans
C) Refinancings
D) Home Improvement Loans
F) Non-occupant Loans on < 5 Family Dwellings (A B C & D)
G) Loans On Manufactured Home Dwelling (A B C & D)
Number
Average Value
Number
Average Value
Number
Average Value
Number
Average Value
Number
Average Value
Number
Average Value
LOANS ORIGINATED
10
$125,493
25
$184,964
28
$147,402
9
$33,229
10
$130,035
4
$40,695
APPLICATIONS APPROVED, NOT ACCEPTED
1
$159,000
1
$104,380
5
$64,166
2
$14,670
0
$0
1
$68,140
APPLICATIONS DENIED
0
$0
8
$79,529
27
$94,968
4
$35,035
2
$58,815
8
$48,071
APPLICATIONS WITHDRAWN
2
$70,035
3
$68,773
5
$187,320
3
$32,810
0
$0
3
$58,993
FILES CLOSED FOR INCOMPLETENESS
0
$0
0
$0
0
$0
1
$47,320
0
$0
0
$0
Aggregated Statistics For Year 2005 (Based on 4 partial tracts)
A) FHA, FSA/RHS & VA Home Purchase Loans
B) Conventional Home Purchase Loans
C) Refinancings
D) Home Improvement Loans
F) Non-occupant Loans on < 5 Family Dwellings (A B C & D)
G) Loans On Manufactured Home Dwelling (A B C & D)
Number
Average Value
Number
Average Value
Number
Average Value
Number
Average Value
Number
Average Value
Number
Average Value
LOANS ORIGINATED
14
$98,020
29
$93,628
26
$92,420
7
$68,467
6
$51,578
9
$56,994
APPLICATIONS APPROVED, NOT ACCEPTED
0
$0
2
$51,740
10
$88,678
2
$15,470
0
$0
3
$48,057
APPLICATIONS DENIED
4
$63,172
7
$45,609
21
$78,093
6
$15,870
2
$36,205
9
$42,258
APPLICATIONS WITHDRAWN
4
$92,510
1
$69,090
11
$101,822
3
$98,427
0
$0
1
$43,530
FILES CLOSED FOR INCOMPLETENESS
0
$0
2
$68,140
1
$123,980
0
$0
0
$0
0
$0
Aggregated Statistics For Year 2004 (Based on 4 partial tracts)
A) FHA, FSA/RHS & VA Home Purchase Loans
B) Conventional Home Purchase Loans
C) Refinancings
D) Home Improvement Loans
F) Non-occupant Loans on < 5 Family Dwellings (A B C & D)
G) Loans On Manufactured Home Dwelling (A B C & D)
Number
Average Value
Number
Average Value
Number
Average Value
Number
Average Value
Number
Average Value
Number
Average Value
LOANS ORIGINATED
9
$86,859
24
$98,780
28
$77,368
3
$65,617
3
$59,940
7
$56,109
APPLICATIONS APPROVED, NOT ACCEPTED
0
$0
1
$38,490
6
$77,290
1
$227,140
0
$0
1
$91,490
APPLICATIONS DENIED
2
$143,345
11
$64,260
27
$83,237
5
$95,588
1
$74,600
7
$44,451
APPLICATIONS WITHDRAWN
2
$133,440
1
$56,780
13
$121,452
0
$0
0
$0
1
$84,230
FILES CLOSED FOR INCOMPLETENESS
1
$38,800
1
$46,450
2
$248,275
0
$0
0
$0
0
$0
Aggregated Statistics For Year 2003 (Based on 4 partial tracts)
A) FHA, FSA/RHS & VA Home Purchase Loans
B) Conventional Home Purchase Loans
C) Refinancings
D) Home Improvement Loans
F) Non-occupant Loans on < 5 Family Dwellings (A B C & D)
Number
Average Value
Number
Average Value
Number
Average Value
Number
Average Value
Number
Average Value
LOANS ORIGINATED
6
$93,063
33
$375,185
56
$96,576
11
$56,956
7
$1,399,904
APPLICATIONS APPROVED, NOT ACCEPTED
0
$0
3
$50,157
7
$60,299
1
$4,730
0
$0
APPLICATIONS DENIED
4
$65,302
12
$42,998
23
$92,755
3
$30,820
3
$34,700
APPLICATIONS WITHDRAWN
1
$78,090
3
$105,997
11
$62,527
1
$9,460
2
$36,435
FILES CLOSED FOR INCOMPLETENESS
1
$70,030
0
$0
7
$75,171
0
$0
0
$0
Aggregated Statistics For Year 2002 (Based on 4 partial tracts)
A) FHA, FSA/RHS & VA Home Purchase Loans
B) Conventional Home Purchase Loans
C) Refinancings
D) Home Improvement Loans
F) Non-occupant Loans on < 5 Family Dwellings (A B C & D)
Number
Average Value
Number
Average Value
Number
Average Value
Number
Average Value
Number
Average Value
LOANS ORIGINATED
6
$107,732
17
$81,728
45
$87,700
4
$15,142
5
$38,614
APPLICATIONS APPROVED, NOT ACCEPTED
1
$163,730
9
$48,852
7
$81,993
1
$61,520
0
$0
APPLICATIONS DENIED
1
$123,030
16
$51,665
13
$91,509
3
$20,897
1
$66,350
APPLICATIONS WITHDRAWN
2
$99,845
0
$0
9
$54,827
1
$1,020
0
$0
FILES CLOSED FOR INCOMPLETENESS
0
$0
0
$0
3
$121,140
0
$0
0
$0
Aggregated Statistics For Year 2001 (Based on 4 partial tracts)
A) FHA, FSA/RHS & VA Home Purchase Loans
B) Conventional Home Purchase Loans
C) Refinancings
D) Home Improvement Loans
F) Non-occupant Loans on < 5 Family Dwellings (A B C & D)
Number
Average Value
Number
Average Value
Number
Average Value
Number
Average Value
Number
Average Value
LOANS ORIGINATED
9
$95,902
17
$61,345
41
$100,411
10
$21,767
3
$80,430
APPLICATIONS APPROVED, NOT ACCEPTED
0
$0
8
$52,096
3
$51,737
0
$0
0
$0
APPLICATIONS DENIED
0
$0
27
$49,334
20
$76,246
6
$25,868
1
$14,200
APPLICATIONS WITHDRAWN
1
$124,920
4
$32,028
6
$48,897
0
$0
0
$0
FILES CLOSED FOR INCOMPLETENESS
0
$0
0
$0
1
$10,210
0
$0
0
$0
Aggregated Statistics For Year 2000 (Based on 4 partial tracts)
A) FHA, FSA/RHS & VA Home Purchase Loans
B) Conventional Home Purchase Loans
C) Refinancings
D) Home Improvement Loans
F) Non-occupant Loans on < 5 Family Dwellings (A B C & D)
Number
Average Value
Number
Average Value
Number
Average Value
Number
Average Value
Number
Average Value
LOANS ORIGINATED
63
$67,915
38
$57,755
21
$50,565
11
$44,051
12
$31,692
APPLICATIONS APPROVED, NOT ACCEPTED
6
$46,495
5
$52,508
7
$55,084
2
$14,195
0
$0
APPLICATIONS DENIED
3
$49,510
23
$45,718
23
$39,925
6
$25,553
1
$33,120
APPLICATIONS WITHDRAWN
2
$77,125
1
$130,600
10
$39,181
0
$0
0
$0
FILES CLOSED FOR INCOMPLETENESS
0
$0
1
$56,140
1
$55,950
2
$54,750
0
$0
Aggregated Statistics For Year 1999 (Based on 2 partial tracts)
A) FHA, FSA/RHS & VA Home Purchase Loans
B) Conventional Home Purchase Loans
C) Refinancings
D) Home Improvement Loans
F) Non-occupant Loans on < 5 Family Dwellings (A B C & D)
Detailed PMIC statistics for the following Tracts:2014.00
, 2015.00
2002 - 2018 National Fire Incident Reporting System (NFIRS) incidents
Based on the data from the years 2002 - 2018 the average number of fire incidents per year is 7. The highest number of reported fire incidents - 19 took place in 2007, and the least - 0 in 2004. The data has a rising trend.
When looking into fire subcategories, the most reports belonged to: Outside Fires (49.2%), and Structure Fires (31.7%).
Fire incident types reported to NFIRS in Zip Code 42236


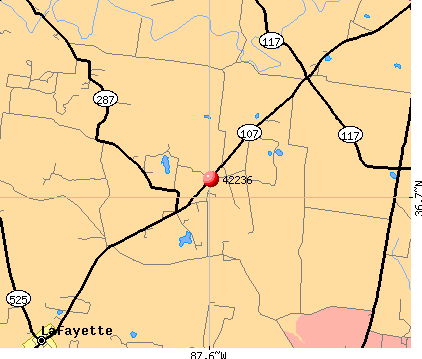 Nearest zip codes: 42254, 42232, 42262, 42223, 37023, 42240.
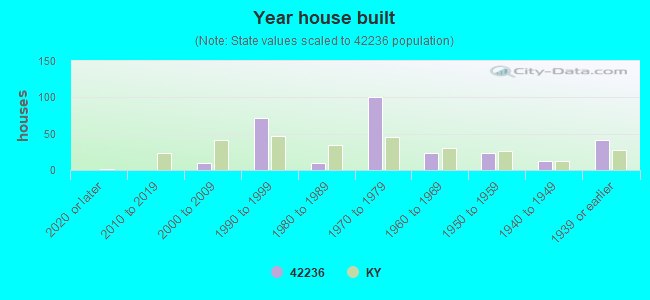


 Based on the data from the years 2002 - 2018 the average number of fire incidents per year is 7. The highest number of reported fire incidents - 19 took place in 2007, and the least - 0 in 2004. The data has a rising trend.
 When looking into fire subcategories, the most reports belonged to: Outside Fires (49.2%), and Structure Fires (31.7%).