Estimated zip code population in 2022: 7,470 Zip code population in 2010: 7,537 Zip code population in 2000: 5,564
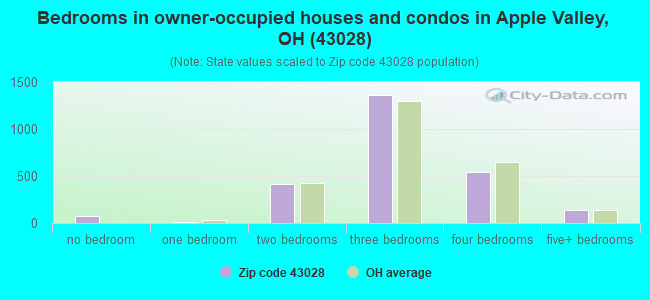
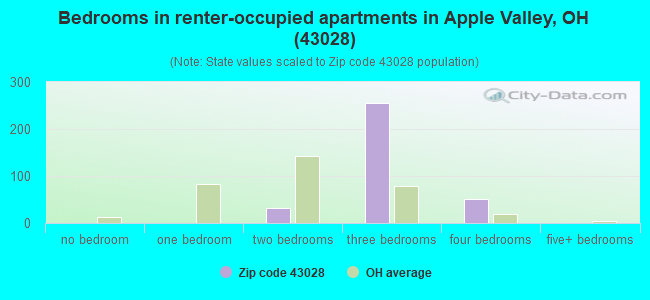
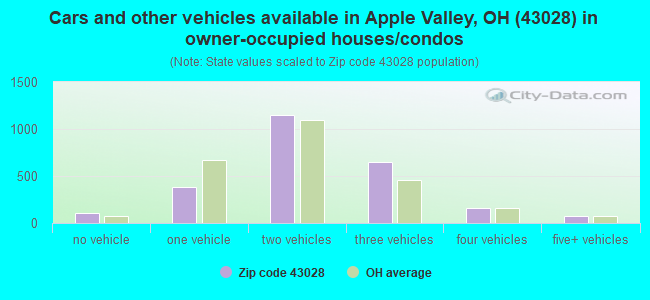
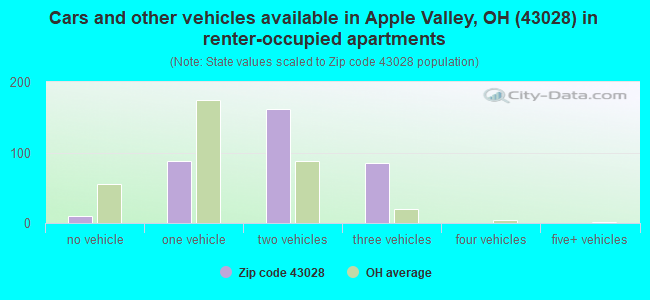
Houses and condos: 3,588 Renter-occupied apartments: 347
% of renters here:
12%
State:
33%
March 2022 cost of living index in zip code 43028: 81.1 (low, U.S. average is 100)
Land area: 53.5 sq. mi. Water area: 1.1 sq. mi.
Population density: 140 people per square mile
(very low).
OSM Map
General Map
Google Map
MSN Map
OSM Map
General Map
Google Map
MSN Map
OSM Map
General Map
Google Map
MSN Map
OSM Map
General Map
Google Map
MSN Map
Please wait while loading the map...
Real estate property taxes paid for housing units in 2022:
This zip code:
1.1% ($2,662)
Ohio:
1.3% ($2,639)
Median real estate property taxes paid for housing units with mortgages in 2022: $2,539 (1.0%) Median real estate property taxes paid for housing units with no mortgage in 2022: $2,895 (1.4%)
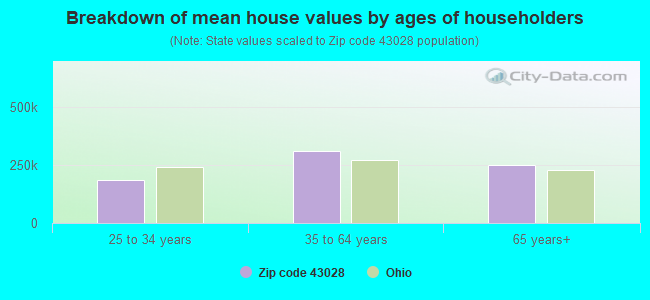
Estimated median house/condo value in 2022: $232,716
43028:
$232,716
Ohio:
$204,100
According to our research of Ohio and other state lists, there were 8 registered sex offenders living in 43028 zip code as of April 19, 2024. The ratio of all residents to sex offenders in zip code 43028 is 1,017 to 1. The ratio of registered sex offenders to all residents in this zip code is lower than the state average.
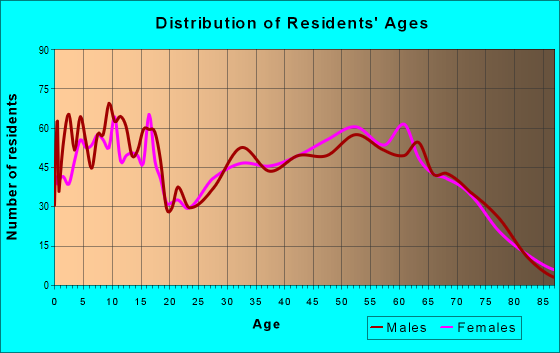
Median resident age:
This zip code:
45.5 years
Ohio median age:
39.9 years
Average household size:
This zip code:
2.6 people
Ohio:
2.4 people
Averages for the 2020 tax year for zip code 43028, filed in 2021:
Average Adjusted Gross Income (AGI) in 2020: $67,618 (Individual Income Tax Returns)
Here:
$67,618
State:
$67,288
Salary/wage: $56,288 (reported on 74.7% of returns)
Here:
$56,288
State:
$55,628
(% of AGI for various income ranges: 1081.2% for AGIs below $25k, 3459.9% for AGIs $25k-50k, 6197.1% for AGIs $50k-75k, 8813.8% for AGIs $75k-100k, 15611.7% for AGIs $100k-200k, 82453.3% for AGIs over 200k)
Taxable interest for individuals: $1,327 (reported on 28.8% of returns)
This zip code:
$1,327
Ohio:
$1,518
(% of AGI for various income ranges: 25.8% for AGIs below $25k, 31.2% for AGIs $25k-50k, 42.7% for AGIs $50k-75k, 37.2% for AGIs $75k-100k, 100.0% for AGIs $100k-200k, 1456.7% for AGIs over 200k)
Ordinary dividends: $5,699 (reported on 20.5% of returns)
Here:
$5,699
State:
$7,167
(% of AGI for various income ranges: 38.6% for AGIs below $25k, 57.7% for AGIs $25k-50k, 108.7% for AGIs $50k-75k, 133.4% for AGIs $75k-100k, 282.3% for AGIs $100k-200k, 6530.0% for AGIs over 200k)
Net capital gain/loss in AGI: +$22,361 (reported on 18.9% of returns)
Here:
+$22,361
State:
+$18,919
(% of AGI for various income ranges: 20.8% for AGIs below $25k, 70.4% for AGIs $25k-50k, 101.6% for AGIs $50k-75k, 211.7% for AGIs $75k-100k, 661.0% for AGIs $100k-200k, 39926.7% for AGIs over 200k)
Profit/loss from business: +$15,199 (reported on 18.6% of returns)
Here:
+$15,199
State:
+$13,744
(% of AGI for various income ranges: 201.8% for AGIs below $25k, 327.8% for AGIs $25k-50k, 349.1% for AGIs $50k-75k, 593.8% for AGIs $75k-100k, 862.7% for AGIs $100k-200k, 3440.0% for AGIs over 200k)
Taxable individual retirement arrangement distribution: $18,869 (reported on 13.7% of returns)
43028:
$18,869
Ohio:
$18,876
(% of AGI for various income ranges: 114.3% for AGIs below $25k, 191.7% for AGIs $25k-50k, 311.3% for AGIs $50k-75k, 513.1% for AGIs $75k-100k, 883.0% for AGIs $100k-200k, 6730.0% for AGIs over 200k)
Total itemized deductions: $28,378 (reported on 6.2% of returns)
Here:
$28,378
State:
$33,869
(% of AGI for various income ranges: 130.9% for AGIs $25k-50k, 136.7% for AGIs $50k-75k, 312.1% for AGIs $75k-100k, 643.0% for AGIs $100k-200k, 7250.0% for AGIs over 200k)
Charity contributions: $10,328 (reported on 4.9% of returns)
Here:
$10,328
State:
$14,577
(% of AGI for various income ranges: 47.0% for AGIs $25k-50k, 68.6% for AGIs $75k-100k, 235.0% for AGIs $100k-200k, 2103.3% for AGIs over 200k)
Taxes paid: $6,630 (reported on 6.2% of returns)
43028:
$6,630
State:
$7,681
(% of AGI for various income ranges: 24.1% for AGIs $25k-50k, 24.7% for AGIs $50k-75k, 78.3% for AGIs $75k-100k, 193.0% for AGIs $100k-200k, 1473.3% for AGIs over 200k)
Earned income credit: $2,155 (reported on 11.3% of returns)
Here:
$2,155
State:
$2,304
(% of AGI for various income ranges: 76.3% for AGIs below $25k, 59.3% for AGIs $25k-50k)
Percentage of individuals using paid preparers for their 2020 taxes: 93.5%
Here:
94%
State:
94%
(% for various income ranges: 91.9% for AGIs below $25k, 94.8% for AGIs $25k-50k, 93.9% for AGIs $50k-75k, 93.5% for AGIs $75k-100k, 94.2% for AGIs $100k-200k, 91.7% for AGIs over 200k)
Averages for the 2012 tax year for zip code 43028, filed in 2013:
Average Adjusted Gross Income (AGI) in 2012: $54,498 (Individual Income Tax Returns)
Here:
$54,498
State:
$54,926
Salary/wage: $43,351 (reported on 78.3% of returns)
Here:
$43,351
State:
$45,869
(% of AGI for various income ranges: 64.7% for AGIs below $25k, 71.7% for AGIs $25k-50k, 71.5% for AGIs $50k-75k, 71.2% for AGIs $75k-100k, 67.6% for AGIs $100k-200k, 26.2% for AGIs over 200k)
Taxable interest for individuals: $1,149 (reported on 31.0% of returns)
This zip code:
$1,149
Ohio:
$1,297
(% of AGI for various income ranges: 1.8% for AGIs below $25k, 0.8% for AGIs $25k-50k, 0.6% for AGIs $50k-75k, 0.2% for AGIs $75k-100k, 0.8% for AGIs $100k-200k, 0.4% for AGIs over 200k)
Ordinary dividends: $3,802 (reported on 17.6% of returns)
Here:
$3,802
State:
$5,821
(% of AGI for various income ranges: 1.2% for AGIs below $25k, 1.1% for AGIs $25k-50k, 0.7% for AGIs $50k-75k, 0.8% for AGIs $75k-100k, 1.3% for AGIs $100k-200k, 2.3% for AGIs over 200k)
Net capital gain/loss in AGI: +$5,162 (reported on 14.0% of returns)
Here:
+$5,162
State:
+$11,232
(% of AGI for various income ranges: 0.2% for AGIs below $25k, 0.6% for AGIs $50k-75k, 0.9% for AGIs $75k-100k, 2.2% for AGIs $100k-200k, 3.4% for AGIs over 200k)
Profit/loss from business: +$9,298 (reported on 18.5% of returns)
Here:
+$9,298
State:
+$12,773
(% of AGI for various income ranges: 9.2% for AGIs below $25k, 4.0% for AGIs $25k-50k, 2.4% for AGIs $50k-75k, 1.9% for AGIs $75k-100k, 4.7% for AGIs $100k-200k)
Taxable individual retirement arrangement distribution: $14,040 (reported on 14.3% of returns)
43028:
$14,040
Ohio:
$14,511
(% of AGI for various income ranges: 4.9% for AGIs below $25k, 3.4% for AGIs $25k-50k, 4.1% for AGIs $50k-75k, 4.3% for AGIs $75k-100k, 5.9% for AGIs $100k-200k)
Total itemized deductions: $19,381 (21% of AGI, reported on 33.3% of returns)
Here:
$19,381
State:
$21,278
Here:
20.5% of AGI
State:
18.8% of AGI
(% of AGI for various income ranges: 10.7% for AGIs below $25k, 10.6% for AGIs $25k-50k, 11.2% for AGIs $50k-75k, 12.5% for AGIs $75k-100k, 13.9% for AGIs $100k-200k, 11.7% for AGIs over 200k)
Charity contributions: $3,796 (reported on 25.3% of returns)
Here:
$3,796
State:
$3,943
(% of AGI for various income ranges: 1.2% for AGIs below $25k, 1.3% for AGIs $25k-50k, 1.2% for AGIs $50k-75k, 1.7% for AGIs $75k-100k, 1.8% for AGIs $100k-200k, 3.2% for AGIs over 200k)
Taxes paid: $7,253 (reported on 33.3% of returns)
43028:
$7,253
State:
$9,568
(% of AGI for various income ranges: 2.1% for AGIs below $25k, 2.7% for AGIs $25k-50k, 3.5% for AGIs $50k-75k, 4.5% for AGIs $75k-100k, 6.0% for AGIs $100k-200k, 6.6% for AGIs over 200k)
Earned income credit: $2,249 (reported on 14.0% of returns)
Here:
$2,249
State:
$2,285
(% of AGI for various income ranges: 5.3% for AGIs below $25k, 0.9% for AGIs $25k-50k)
Percentage of individuals using paid preparers for their 2012 taxes: 50.0%
Here:
50%
State:
51%
(% for various income ranges: 42.6% for AGIs below $25k, 52.7% for AGIs $25k-50k, 53.3% for AGIs $50k-75k, 56.8% for AGIs $75k-100k, 50.0% for AGIs $100k-200k, 80.0% for AGIs over 200k)
Averages for the 2004 tax year for zip code 43028, filed in 2005:
Average Adjusted Gross Income (AGI) in 2004: $43,809 (Individual Income Tax Returns)
Here:
$43,809
State:
$44,480
Salary/wage: $38,918 (reported on 82.7% of returns)
Here:
$38,918
State:
$39,198
(% of AGI for various income ranges: 81.9% for AGIs below $10k, 64.6% for AGIs $10k-25k, 78.1% for AGIs $25k-50k, 79.5% for AGIs $50k-75k, 78.2% for AGIs $75k-100k, 61.0% for AGIs over 100k)
Taxable interest for individuals: $1,110 (reported on 46.9% of returns)
This zip code:
$1,110
Ohio:
$1,532
(% of AGI for various income ranges: 3.7% for AGIs below $10k, 2.6% for AGIs $10k-25k, 1.0% for AGIs $25k-50k, 1.1% for AGIs $50k-75k, 0.9% for AGIs $75k-100k, 1.0% for AGIs over 100k)
Taxable dividends: $1,990 (reported on 22.5% of returns)
Here:
$1,990
State:
$3,496
(% of AGI for various income ranges: 2.7% for AGIs below $10k, 1.9% for AGIs $10k-25k, 0.7% for AGIs $25k-50k, 0.5% for AGIs $50k-75k, 1.0% for AGIs $75k-100k, 1.5% for AGIs over 100k)
Net capital gain/loss: +$10,530 (reported on 17.1% of returns)
Here:
+$10,530
State:
+$8,582
(% of AGI for various income ranges: 0.3% for AGIs below $10k, 0.7% for AGIs $10k-25k, 0.7% for AGIs $25k-50k, 0.6% for AGIs $50k-75k, 2.0% for AGIs $75k-100k, 14.9% for AGIs over 100k)
Profit/loss from business: +$9,649 (reported on 19.4% of returns)
Here:
+$9,649
State:
+$10,813
(% of AGI for various income ranges: 9.3% for AGIs below $10k, 9.1% for AGIs $10k-25k, 4.3% for AGIs $25k-50k, 2.9% for AGIs $50k-75k, 2.6% for AGIs $75k-100k, 4.7% for AGIs over 100k)
IRA payment deduction: $3,059 (reported on 2.8% of returns)
43028:
$3,059
Ohio:
$2,794
Self-employed pension: $8,714 (reported on 0.5% of returns)
Here:
$8,714
Ohio:
$13,981
Total itemized deductions: $15,462 (23% of AGI, reported on 39.9% of returns)
Here:
$15,462
State:
$17,503
Here:
22.8% of AGI
State:
20.8% of AGI
(% of AGI for various income ranges: 15.5% for AGIs below $10k, 11.1% for AGIs $10k-25k, 13.2% for AGIs $25k-50k, 14.8% for AGIs $50k-75k, 16.5% for AGIs $75k-100k, 13.6% for AGIs over 100k)
Charity contributions deductions: $2,531 (3% of AGI, reported on 31.3% of returns)
Here:
$2,531
State:
$3,087
Here:
3.5% of AGI
State:
3.4% of AGI
(% of AGI for various income ranges: 0.9% for AGIs below $10k, 1.4% for AGIs $10k-25k, 1.5% for AGIs $25k-50k, 1.9% for AGIs $50k-75k, 2.1% for AGIs $75k-100k, 2.1% for AGIs over 100k)
Total tax: $5,507 (reported on 79.2% of returns)
43028:
$5,507
State:
$6,781
(% of AGI for various income ranges: 2.9% for AGIs below $10k, 4.5% for AGIs $10k-25k, 6.9% for AGIs $25k-50k, 8.4% for AGIs $50k-75k, 10.3% for AGIs $75k-100k, 17.5% for AGIs over 100k)
Earned income credit: $1,556 (reported on 11.1% of returns)
Here:
$1,556
State:
$1,696
Percentage of individuals using paid preparers for their 2004 taxes: 54.1%
Here:
54%
State:
55%
(% for various income ranges: 40.3% for AGIs below $10k, 56.4% for AGIs $10k-25k, 57.6% for AGIs $25k-50k, 53.5% for AGIs $50k-75k, 52.8% for AGIs $75k-100k, 67.9% for AGIs over 100k)
Household received Food Stamps/SNAP in the past 12 months: 151 Household did not receive Food Stamps/SNAP in the past 12 months: 2,714
Women who had a birth in the past 12 months: 92 (94 now married, 0 unmarried) Women who did not have a birth in the past 12 months: 1,242 (749 now married, 492 unmarried)
Housing units in zip code 43028 with a mortgage: 1,529 (117 second mortgage, 109 both second mortgage and home equity loan) Houses without a mortgage: 64
Median monthly owner costs for units with a mortgage: $1,343 Median monthly owner costs for units without a mortgage: $566
Residents with income below the poverty level in 2022:
This zip code:
9.8%
Whole state:
13.4%
Residents with income below 50% of the poverty level in 2022:
This zip code:
5.7%
Whole state:
7.0%
Median number of rooms in houses and condos:
Here:
6.4
State:
6.7
Median number of rooms in apartments:
Here:
5.8
State:
4.4
Notable locations in this zip code not listed on our city pages
Notable locations in zip code 43028: Apple Valley Golf Course (A), Skyline Turkey Farm (B), Ireland Valley Farm (C), Grassydell Farms (D), Howard Sewage Treatment Plant (E), Blanchard Swine Farms (F), Horn Farms (G), Borror Farm (H), Bullock Farms (I), Widows Point Farms (J), Valley Fruit Farm (K), Autumn Hills Farm (L), Spring Creek Dairy (M), Eastern Knox County Joint Fire District Station 2 (N). Display/hide their locations on the map
Streams, rivers, and creeks: Dry Run (A), Jug Run (B), Honey Run (C), Brush Run (D), Barney Run (E), Jelloway Creek (F), Schenck Creek (G). Display/hide their locations on the map
In group quarters: 10 (-1 institutionalized population)
Size of family households: 1,254 2-persons, 391 3-persons, 461 4-persons, 132 5-persons, 9 6-persons, 19 7-or-more-persons
Size of nonfamily households: 482 1-person, 109 2-persons
1,295 married couples with children.
260 single-parent households (9 men, 251 women).
97.6% of residents of 43028 zip code speak English at home.
0.2% of residents speak Spanish at home (100% very well).
2.3% of residents speak other Indo-European language at home (45% very well, 47% well, 8% not well).
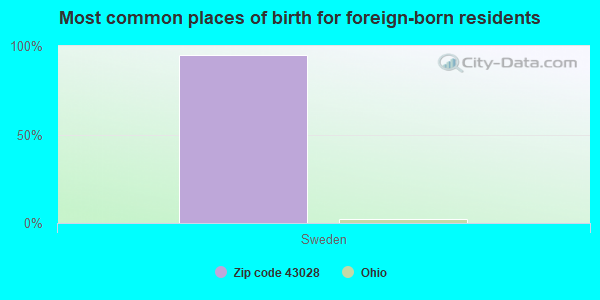
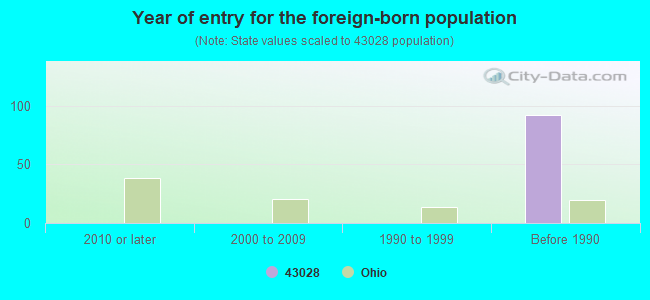
Foreign born population: 42 (0.6%) (100.0% of them are naturalized citizens)
This zip code:
0.6%
Whole state:
5.0%
95%Sweden
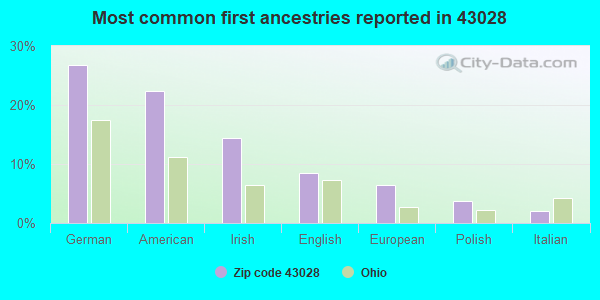
27%German
22%American
14%Irish
8%English
7%European
4%Polish
2%Italian
Year of entry for the foreign-born population
02010 or later
02000 to 2009
01990 to 1999
92Before 1990
Housing units lacking complete plumbing facilities: 1.1% Housing units lacking complete kitchen facilities: 0.7%
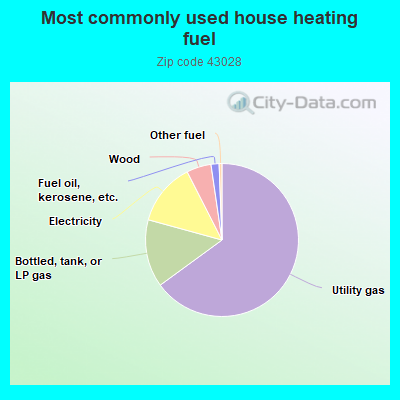
64.9%Utility gas
14.3%Bottled, tank, or LP gas
13.2%Electricity
5.2%Wood
1.7%Fuel oil, kerosene, etc.
0.6%Other fuel
Population in 1990: 1,972. Population change in the 1990s: +3,592 (+182.2%).
Place of birth for U.S.-born residents:
This state: 5,922
Northeast: 322
Midwest: 507
South: 516
West: 88
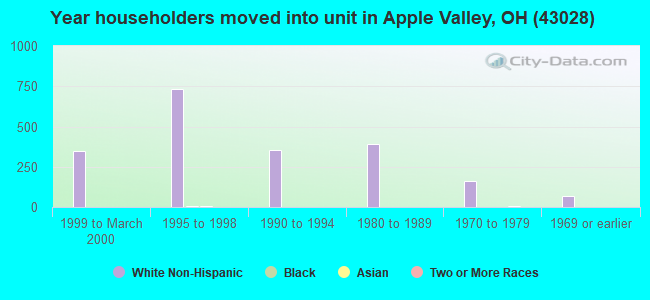
57% of the 43028 zip code residents lived in the same house 5 years ago. Out of people who lived in different houses, 49% lived in this county. Out of people who lived in different counties, 50% lived in Ohio.
87% of the 43028 zip code residents lived in the same house 1 year ago. Out of people who lived in different houses, 20% moved from this county. Out of people who lived in different houses, 52% moved from different county within same state. Out of people who lived in different houses, 30% moved from different state.
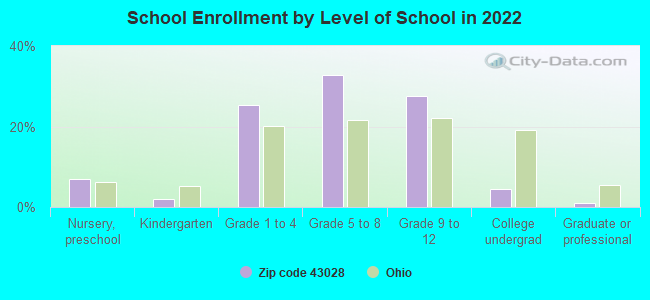
Private vs. public school enrollment:
Students in private schools in grades 1 to 8 (elementary and middle school): 175
Here:
20.6%
Ohio:
16.0%
Students in private schools in grades 9 to 12 (high school): 52
Here:
13.0%
Ohio:
13.1%
Students in private undergraduate colleges: 29
Here:
44.9%
Ohio:
22.3%
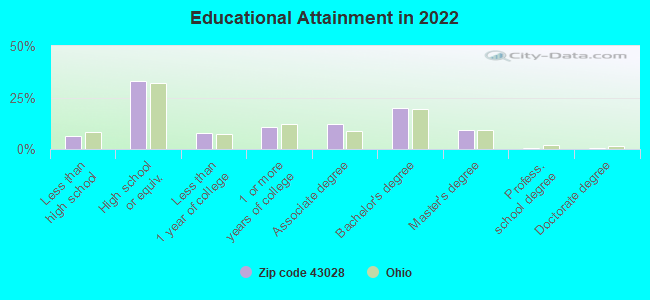
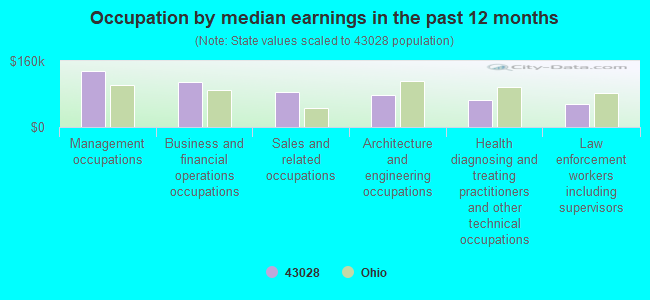
Occupation by median earnings in the past 12 months ($)
135,114Management occupations
109,516Business and financial operations occupations
86,024Sales and related occupations
77,095Architecture and engineering occupations
65,135Health diagnosing and treating practitioners and other technical occupations
54,579Law enforcement workers including supervisors
Top industries in this zip code by the number of employees in 2005:
Other Services (except Public Administration): Other Similar Organizations (except Business, Professional, Labor, and Political Organizations) (20-49 employees: 1 establishment)
Health Care and Social Assistance: Home Health Care Services (20-49: 1)
Educational Services: Apprenticeship Training (20-49: 1)
Construction: Plumbing, Heating, and Air-Conditioning Contractors (10-19: 1, 1-4: 1)
Mining: Industrial Sand Mining (10-19: 1)
Construction: New Single-Family Housing Construction (except Operative Builders) (5-9: 1, 1-4: 2)
Other Services (except Public Administration): Beauty Salons (5-9: 1, 1-4: 1)
Accommodation and Food Services: Drinking Places (Alcoholic Beverages) (5-9: 1)
People in group quarters in 2010:
7 people in group homes intended for adults
People in group quarters in 2000:
3 people in homes for the mentally retarded
Fatal accident statistics in 2011:
Fatal accident count: 1
Vehicles involved in fatal accidents: 1
Fatal accidents caused by drunken drivers: 1
Fatalities: 1
Persons involved in fatal accidents: 1
Pedestrians involved in fatal accidents: 0
Fatal accident statistics in 2010:
Fatal accident count: 1
Vehicles involved in fatal accidents: 2
Fatal accidents caused by drunken drivers: 0
Fatalities: 1
Persons involved in fatal accidents: 2
Pedestrians involved in fatal accidents: 0
2002 - 2018 National Fire Incident Reporting System (NFIRS) incidents
Based on the data from the years 2002 - 2018 the average number of fire incidents per year is 32. The highest number of reported fires - 58 took place in 2006, and the least - 15 in 2017. The data has a decreasing trend.
When looking into fire subcategories, the most reports belonged to: Outside Fires (54.6%), and Structure Fires (32.3%).
Fire incident types reported to NFIRS in Zip Code 43028
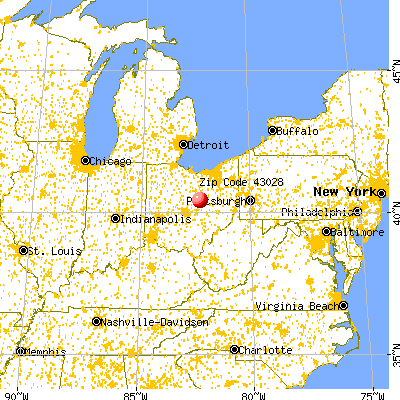


 Nearest zip codes: 43022, 43014, 43005, 43037, 43843, 43006.


 Based on the data from the years 2002 - 2018 the average number of fire incidents per year is 32. The highest number of reported fires - 58 took place in 2006, and the least - 15 in 2017. The data has a decreasing trend.
 When looking into fire subcategories, the most reports belonged to: Outside Fires (54.6%), and Structure Fires (32.3%).