Estimated zip code population in 2022: 14,006 Zip code population in 2010: 12,318 Zip code population in 2000: 10,170
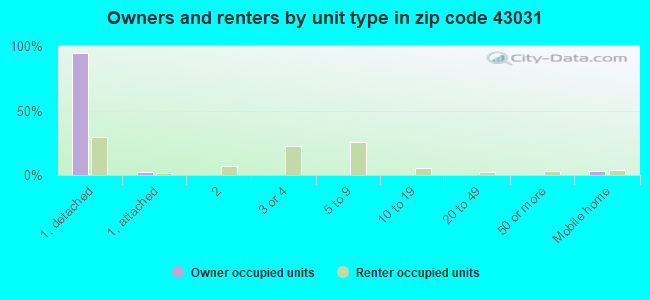
Houses and condos: 5,494 Renter-occupied apartments: 1,086
% of renters here:
20%
State:
33%
March 2022 cost of living index in zip code 43031: 84.8 (less than average, U.S. average is 100)
Land area: 89.1 sq. mi. Water area: 0.3 sq. mi.
Population density: 157 people per square mile
(very low).
OSM Map
General Map
Google Map
MSN Map
OSM Map
General Map
Google Map
MSN Map
OSM Map
General Map
Google Map
MSN Map
OSM Map
General Map
Google Map
MSN Map
Please wait while loading the map...
Real estate property taxes paid for housing units in 2022:
This zip code:
1.1% ($4,042)
Ohio:
1.3% ($2,639)
Median real estate property taxes paid for housing units with mortgages in 2022: $4,144 (1.1%) Median real estate property taxes paid for housing units with no mortgage in 2022: $3,647 (1.3%)
Business Search- 14 Million verified businesses
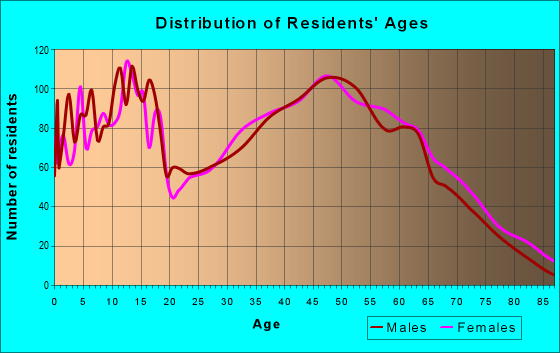
Males: 7,092
(50.6%)
Females: 6,914
(49.4%)
For population 25 years and over in 43031:
High school or higher: 97.6%
Bachelor's degree or higher: 41.1%
Graduate or professional degree: 11.5%
Unemployed: 1.3%
Mean travel time to work (commute): 28.5 minutes
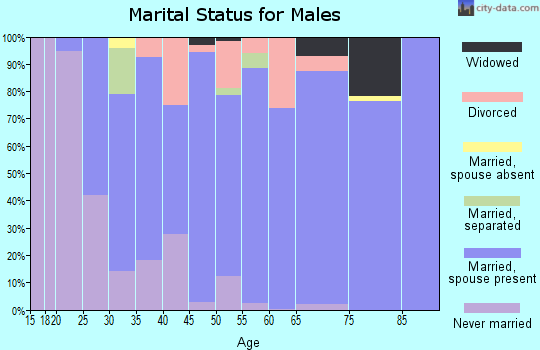
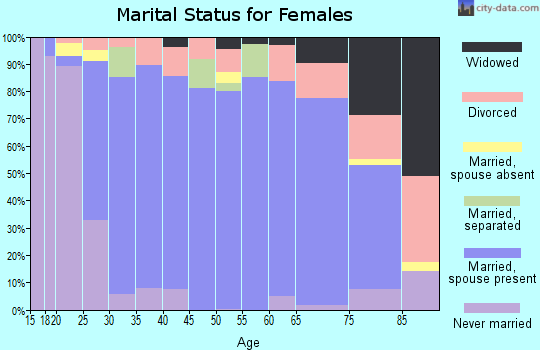
For population 15 years and over in 43031:
Never married: 21.4%
Now married: 65.1%
Separated: 0.5%
Widowed: 4.1%
Divorced: 8.9%
Zip code 43031 compared to state average:
Median household income above state average.
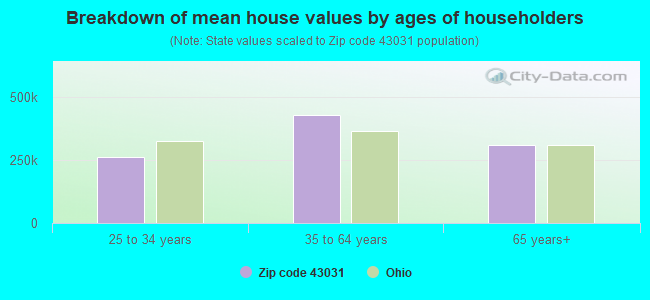
Median house value above state average.
Unemployed percentage below state average.
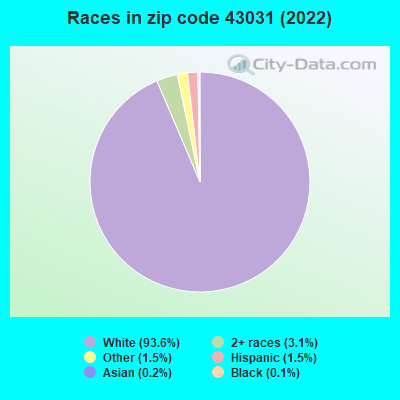
Black race population percentage significantly below state average.
Hispanic race population percentage below state average.
Foreign-born population percentage significantly below state average.
Renting percentage below state average.
Length of stay since moving in significantly above state average.
Estimated median house/condo value in 2022: $357,203
43031:
$357,203
Ohio:
$204,100
According to our research of Ohio and other state lists, there were 12 registered sex offenders living in 43031 zip code as of April 24, 2024. The ratio of all residents to sex offenders in zip code 43031 is 1,071 to 1. The ratio of registered sex offenders to all residents in this zip code is lower than the state average.
Median resident age:
This zip code:
42.2 years
Ohio median age:
39.9 years
Average household size:
This zip code:
2.6 people
Ohio:
2.4 people
Averages for the 2020 tax year for zip code 43031, filed in 2021:
Average Adjusted Gross Income (AGI) in 2020: $84,926 (Individual Income Tax Returns)
Here:
$84,926
State:
$67,288
Salary/wage: $68,418 (reported on 82.8% of returns)
Here:
$68,418
State:
$55,628
(% of AGI for various income ranges: 1177.6% for AGIs below $25k, 3553.0% for AGIs $25k-50k, 6572.1% for AGIs $50k-75k, 9609.6% for AGIs $75k-100k, 18466.3% for AGIs $100k-200k, 70416.0% for AGIs over 200k)
Taxable interest for individuals: $1,086 (reported on 29.6% of returns)
This zip code:
$1,086
Ohio:
$1,518
(% of AGI for various income ranges: 14.1% for AGIs below $25k, 17.0% for AGIs $25k-50k, 34.4% for AGIs $50k-75k, 35.2% for AGIs $75k-100k, 55.5% for AGIs $100k-200k, 893.0% for AGIs over 200k)
Ordinary dividends: $4,833 (reported on 20.7% of returns)
Here:
$4,833
State:
$7,167
(% of AGI for various income ranges: 18.0% for AGIs below $25k, 31.7% for AGIs $25k-50k, 64.5% for AGIs $50k-75k, 105.5% for AGIs $75k-100k, 149.9% for AGIs $100k-200k, 3862.0% for AGIs over 200k)
Net capital gain/loss in AGI: +$13,646 (reported on 18.2% of returns)
Here:
+$13,646
State:
+$18,919
(% of AGI for various income ranges: 13.8% for AGIs below $25k, 48.6% for AGIs $25k-50k, 102.2% for AGIs $50k-75k, 121.1% for AGIs $75k-100k, 461.9% for AGIs $100k-200k, 10748.0% for AGIs over 200k)
Profit/loss from business: +$14,091 (reported on 16.3% of returns)
Here:
+$14,091
State:
+$13,744
(% of AGI for various income ranges: 124.8% for AGIs below $25k, 187.0% for AGIs $25k-50k, 234.8% for AGIs $50k-75k, 300.7% for AGIs $75k-100k, 589.2% for AGIs $100k-200k, 3561.0% for AGIs over 200k)
Taxable individual retirement arrangement distribution: $18,096 (reported on 10.7% of returns)
43031:
$18,096
Ohio:
$18,876
(% of AGI for various income ranges: 88.0% for AGIs below $25k, 176.4% for AGIs $25k-50k, 232.7% for AGIs $50k-75k, 337.5% for AGIs $75k-100k, 550.8% for AGIs $100k-200k, 1767.0% for AGIs over 200k)
Self-employed (Keogh) retirement plans: $17,200 (reported on 0.6% of returns)
43031:
$17,200
Ohio:
$24,898
(% of AGI for various income ranges: 81.9% for AGIs $100k-200k)
Total itemized deductions: $26,821 (reported on 9.0% of returns)
Here:
$26,821
State:
$33,869
(% of AGI for various income ranges: 56.1% for AGIs below $25k, 73.8% for AGIs $25k-50k, 221.3% for AGIs $50k-75k, 452.3% for AGIs $75k-100k, 754.9% for AGIs $100k-200k, 4323.0% for AGIs over 200k)
Charity contributions: $8,430 (reported on 6.8% of returns)
Here:
$8,430
State:
$14,577
(% of AGI for various income ranges: 8.5% for AGIs below $25k, 28.1% for AGIs $50k-75k, 87.0% for AGIs $75k-100k, 176.1% for AGIs $100k-200k, 1597.0% for AGIs over 200k)
Taxes paid: $8,103 (reported on 8.7% of returns)
43031:
$8,103
State:
$7,681
(% of AGI for various income ranges: 7.1% for AGIs below $25k, 13.8% for AGIs $25k-50k, 70.4% for AGIs $50k-75k, 138.0% for AGIs $75k-100k, 245.0% for AGIs $100k-200k, 1175.0% for AGIs over 200k)
Earned income credit: $2,119 (reported on 8.6% of returns)
Here:
$2,119
State:
$2,304
(% of AGI for various income ranges: 58.9% for AGIs below $25k, 49.5% for AGIs $25k-50k)
Percentage of individuals using paid preparers for their 2020 taxes: 93.5%
Here:
93%
State:
94%
(% for various income ranges: 92.3% for AGIs below $25k, 93.7% for AGIs $25k-50k, 94.4% for AGIs $50k-75k, 93.8% for AGIs $75k-100k, 93.7% for AGIs $100k-200k, 93.9% for AGIs over 200k)
Averages for the 2012 tax year for zip code 43031, filed in 2013:
Average Adjusted Gross Income (AGI) in 2012: $56,517 (Individual Income Tax Returns)
Here:
$56,517
State:
$54,926
Salary/wage: $50,212 (reported on 84.8% of returns)
Here:
$50,212
State:
$45,869
(% of AGI for various income ranges: 71.3% for AGIs below $25k, 78.0% for AGIs $25k-50k, 77.3% for AGIs $50k-75k, 80.8% for AGIs $75k-100k, 80.3% for AGIs $100k-200k, 52.1% for AGIs over 200k)
Taxable interest for individuals: $901 (reported on 32.2% of returns)
This zip code:
$901
Ohio:
$1,297
(% of AGI for various income ranges: 1.5% for AGIs below $25k, 0.6% for AGIs $25k-50k, 0.5% for AGIs $50k-75k, 0.2% for AGIs $75k-100k, 0.5% for AGIs $100k-200k, 0.4% for AGIs over 200k)
Ordinary dividends: $2,144 (reported on 19.7% of returns)
Here:
$2,144
State:
$5,821
(% of AGI for various income ranges: 1.5% for AGIs below $25k, 0.4% for AGIs $25k-50k, 0.7% for AGIs $50k-75k, 0.6% for AGIs $75k-100k, 0.7% for AGIs $100k-200k, 1.1% for AGIs over 200k)
Net capital gain/loss in AGI: +$4,875 (reported on 13.7% of returns)
Here:
+$4,875
State:
+$11,232
(% of AGI for various income ranges: 0.2% for AGIs $25k-50k, 0.2% for AGIs $50k-75k, 0.4% for AGIs $75k-100k, 1.1% for AGIs $100k-200k, 6.1% for AGIs over 200k)
Profit/loss from business: +$11,287 (reported on 15.7% of returns)
Here:
+$11,287
State:
+$12,773
(% of AGI for various income ranges: 7.9% for AGIs below $25k, 3.3% for AGIs $25k-50k, 2.2% for AGIs $50k-75k, 2.4% for AGIs $75k-100k, 2.4% for AGIs $100k-200k, 4.3% for AGIs over 200k)
Taxable individual retirement arrangement distribution: $12,076 (reported on 10.4% of returns)
43031:
$12,076
Ohio:
$14,511
(% of AGI for various income ranges: 3.1% for AGIs below $25k, 3.1% for AGIs $25k-50k, 2.4% for AGIs $50k-75k, 2.0% for AGIs $75k-100k, 2.5% for AGIs $100k-200k)
Self-employment retirement plans: $16,750 (reported on 0.3% of returns)
43031:
$16,750
Ohio:
$20,257
(% of AGI for various income ranges: 0.5% for AGIs $75k-100k)
Total itemized deductions: $19,569 (21% of AGI, reported on 40.0% of returns)
Here:
$19,569
State:
$21,278
Here:
20.8% of AGI
State:
18.8% of AGI
(% of AGI for various income ranges: 8.3% for AGIs below $25k, 10.1% for AGIs $25k-50k, 14.2% for AGIs $50k-75k, 15.5% for AGIs $75k-100k, 16.6% for AGIs $100k-200k, 12.3% for AGIs over 200k)
Charity contributions: $3,042 (reported on 30.4% of returns)
Here:
$3,042
State:
$3,943
(% of AGI for various income ranges: 0.7% for AGIs below $25k, 0.9% for AGIs $25k-50k, 1.4% for AGIs $50k-75k, 1.7% for AGIs $75k-100k, 2.3% for AGIs $100k-200k, 1.9% for AGIs over 200k)
Taxes paid: $8,513 (reported on 40.0% of returns)
43031:
$8,513
State:
$9,568
(% of AGI for various income ranges: 2.0% for AGIs below $25k, 3.0% for AGIs $25k-50k, 5.4% for AGIs $50k-75k, 6.5% for AGIs $75k-100k, 8.1% for AGIs $100k-200k, 7.6% for AGIs over 200k)
Earned income credit: $1,995 (reported on 12.7% of returns)
Here:
$1,995
State:
$2,285
(% of AGI for various income ranges: 4.7% for AGIs below $25k, 0.7% for AGIs $25k-50k)
Percentage of individuals using paid preparers for their 2012 taxes: 51.2%
Here:
51%
State:
51%
(% for various income ranges: 44.1% for AGIs below $25k, 53.9% for AGIs $25k-50k, 57.4% for AGIs $50k-75k, 54.9% for AGIs $75k-100k, 50.6% for AGIs $100k-200k, 72.7% for AGIs over 200k)
Averages for the 2004 tax year for zip code 43031, filed in 2005:
Average Adjusted Gross Income (AGI) in 2004: $46,388 (Individual Income Tax Returns)
Here:
$46,388
State:
$44,480
Salary/wage: $42,371 (reported on 86.7% of returns)
Here:
$42,371
State:
$39,198
(% of AGI for various income ranges: 121.1% for AGIs below $10k, 73.9% for AGIs $10k-25k, 79.7% for AGIs $25k-50k, 83.2% for AGIs $50k-75k, 87.2% for AGIs $75k-100k, 68.9% for AGIs over 100k)
Taxable interest for individuals: $1,281 (reported on 44.6% of returns)
This zip code:
$1,281
Ohio:
$1,532
(% of AGI for various income ranges: 6.0% for AGIs below $10k, 2.5% for AGIs $10k-25k, 0.9% for AGIs $25k-50k, 0.6% for AGIs $50k-75k, 1.1% for AGIs $75k-100k, 1.5% for AGIs over 100k)
Taxable dividends: $1,533 (reported on 24.4% of returns)
Here:
$1,533
State:
$3,496
(% of AGI for various income ranges: 2.3% for AGIs below $10k, 0.7% for AGIs $10k-25k, 0.8% for AGIs $25k-50k, 0.6% for AGIs $50k-75k, 0.7% for AGIs $75k-100k, 1.0% for AGIs over 100k)
Net capital gain/loss: +$8,484 (reported on 18.7% of returns)
Here:
+$8,484
State:
+$8,582
(% of AGI for various income ranges: -0.0% for AGIs below $10k, 1.0% for AGIs $10k-25k, 0.8% for AGIs $25k-50k, 1.0% for AGIs $50k-75k, 1.3% for AGIs $75k-100k, 10.0% for AGIs over 100k)
Profit/loss from business: +$8,786 (reported on 16.6% of returns)
Here:
+$8,786
State:
+$10,813
(% of AGI for various income ranges: -9.7% for AGIs below $10k, 5.5% for AGIs $10k-25k, 3.1% for AGIs $25k-50k, 2.5% for AGIs $50k-75k, 2.2% for AGIs $75k-100k, 4.4% for AGIs over 100k)
IRA payment deduction: $2,819 (reported on 2.1% of returns)
43031:
$2,819
Ohio:
$2,794
(% of AGI for various income ranges: 0.2% for AGIs $10k-25k, 0.2% for AGIs $25k-50k, 0.2% for AGIs $50k-75k, 0.1% for AGIs $75k-100k, 0.1% for AGIs over 100k)
Self-employed pension: $10,515 (reported on 0.6% of returns)
Here:
$10,515
Ohio:
$13,981
Total itemized deductions: $16,562 (23% of AGI, reported on 46.1% of returns)
Here:
$16,562
State:
$17,503
Here:
22.8% of AGI
State:
20.8% of AGI
(% of AGI for various income ranges: 10.8% for AGIs below $10k, 10.9% for AGIs $10k-25k, 14.6% for AGIs $25k-50k, 17.5% for AGIs $50k-75k, 19.4% for AGIs $75k-100k, 16.6% for AGIs over 100k)
Charity contributions deductions: $2,346 (3% of AGI, reported on 38.1% of returns)
Here:
$2,346
State:
$3,087
Here:
3.1% of AGI
State:
3.4% of AGI
(% of AGI for various income ranges: 1.2% for AGIs below $10k, 0.8% for AGIs $10k-25k, 1.4% for AGIs $25k-50k, 1.8% for AGIs $50k-75k, 2.1% for AGIs $75k-100k, 2.7% for AGIs over 100k)
Total tax: $5,930 (reported on 81.2% of returns)
43031:
$5,930
State:
$6,781
(% of AGI for various income ranges: 4.8% for AGIs below $10k, 4.7% for AGIs $10k-25k, 7.3% for AGIs $25k-50k, 8.9% for AGIs $50k-75k, 10.0% for AGIs $75k-100k, 16.3% for AGIs over 100k)
Earned income credit: $1,548 (reported on 9.5% of returns)
Here:
$1,548
State:
$1,696
Percentage of individuals using paid preparers for their 2004 taxes: 52.8%
Here:
53%
State:
55%
(% for various income ranges: 41.5% for AGIs below $10k, 50.7% for AGIs $10k-25k, 59.0% for AGIs $25k-50k, 54.4% for AGIs $50k-75k, 52.7% for AGIs $75k-100k, 57.9% for AGIs over 100k)
Household received Food Stamps/SNAP in the past 12 months: 356 Household did not receive Food Stamps/SNAP in the past 12 months: 5,024
Women who had a birth in the past 12 months: 230 (167 now married, 64 unmarried) Women who did not have a birth in the past 12 months: 2,730 (1,598 now married, 1,130 unmarried)
Housing units in zip code 43031 with a mortgage: 3,187 (467 second mortgage, 451 both second mortgage and home equity loan) Houses without a mortgage: 266
Median monthly owner costs for units with a mortgage: $1,698 Median monthly owner costs for units without a mortgage: $683
Residents with income below the poverty level in 2022:
This zip code:
6.0%
Whole state:
13.4%
Residents with income below 50% of the poverty level in 2022:
This zip code:
4.2%
Whole state:
7.0%
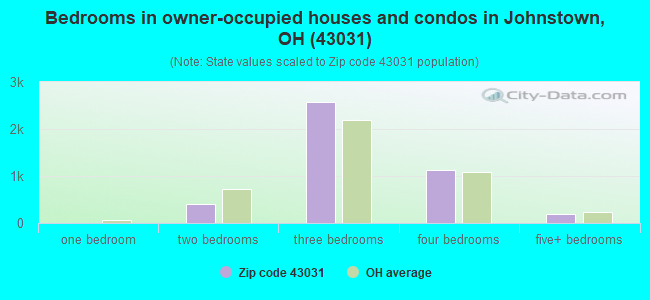
Median number of rooms in houses and condos:
Here:
7.1
State:
6.7
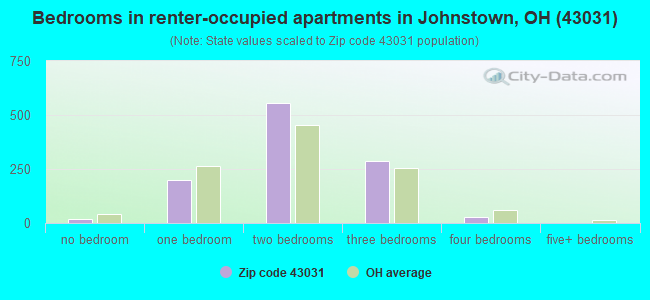
Median number of rooms in apartments:
Here:
4.4
State:
4.4
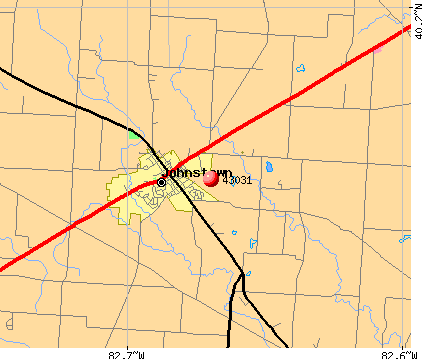
Notable locations in this zip code not listed on our city pages
Notable locations in zip code 43031: Twelve Corners (A), Brooks Corners (B), Hazelton Corners (C), Willison Corners (D), Edelblut Corners (E), Monroe Township Fire Department (F), Ohio Poetry Therapy Center (G), Bosveld Library On Applied Poetry (H). Display/hide their locations on the map
Churches in zip code 43031 include: Concord Church (A), Universalist Church (B), Harmony Church (C), Jersey Chapel (D), Miller Church (E), Liberty Church (F). Display/hide their locations on the map
Cemeteries: Appleton Cemetery (1), Wickhieser Cemetery (2), Burnside Cemetery (3), Saint Joseph Cemetery (4), Green Hill Cemetery (5), Hancock Cemetery (6), Hanover Cemetery (7). Display/hide their locations on the map
2,443 married couples with children.
491 single-parent households (75 men, 416 women).
98.6% of residents of 43031 zip code speak English at home.
0.2% of residents speak Spanish at home (100% very well).
0.8% of residents speak other Indo-European language at home (100% very well).
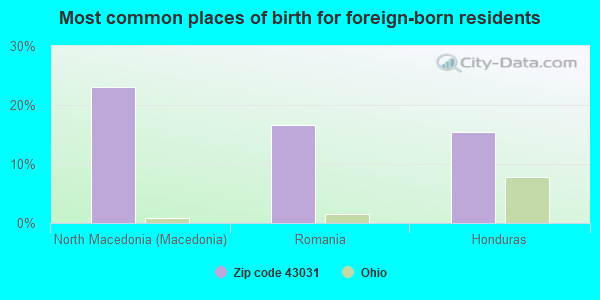
Foreign born population: 79 (0.6%) (88.5% of them are naturalized citizens)
This zip code:
0.6%
Whole state:
5.0%
23%North Macedonia (Macedonia)
17%Romania
15%Honduras
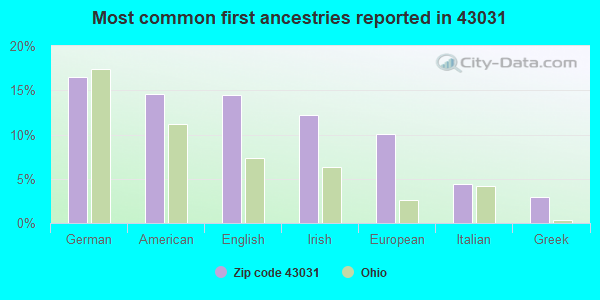
16%German
15%American
14%English
12%Irish
10%European
4%Italian
3%Greek
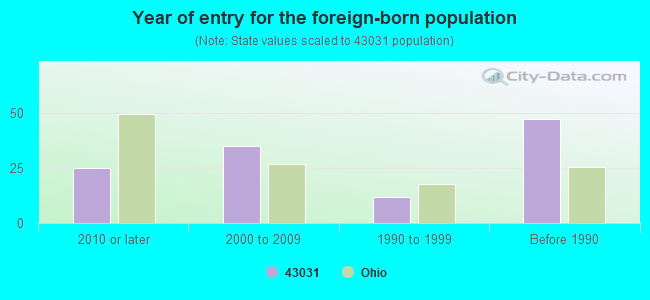
Year of entry for the foreign-born population
252010 or later
352000 to 2009
121990 to 1999
47Before 1990
Facilities with environmental interests located in this zip code:
AGRIGENERAL CO LP * (10513 CROTON RD in JOHNSTOWN, OH)
(Integrated Compliance Information System) - ICIS-05-1991-0231, FORMAL ENFORCEMENT ACTION STATE MASTER (Ohio general info) - RCRA-OHD987011491, HAZARDOUS WASTE PROGRAM, AIR MAJOR, -45-8215-823-2, EPCRA Small Quantity Generators, between 100 kg and 1000 kg of hazardous waste/month (Resource Conservation and Recovery Act (tracking hazardous waste)) - notification Business SIC classification: CHICKEN EGGS Organizations: AGRIGENERAL CO L P (CONTACT/OWNER)
Alternative names: AGRIGENERAL CO L P
AT&T LONG LINES ALEXAND (APPROX 4 MI E OF JOHNSTOWN in JOHNSTOWN, OH)
STATE MASTER (Ohio general info) - RCRA-OHT400013918, HAZARDOUS WASTE PROGRAM (Resource Conservation and Recovery Act (tracking hazardous waste)) Organizations: AMERICAN TELEPHONE AND TELEGRAPH (CONTACT/OWNER)
, UNKNOWN (CONTACT/OWNER)
BIGMAR INC * (9711 SPORTSMAN CLUB ROAD in JOHNSTOWN, OH)
STATE MASTER (Ohio general info) - RCRA-OHR000024729, HAZARDOUS WASTE PROGRAM Conditionally Exempt Small Quantity Generators, less than 100 kg/month of hazardous waste (Resource Conservation and Recovery Act (tracking hazardous waste)) - notification Organizations: JTECH LABORATORIES INC (CONTACT/OWNER)
ALLTEL - JOHNSTOWN (11272 JUG ST RD in JOHNSTOWN, OH)
(Integrated Compliance Information System) - ICIS-HQ-2000-6004, FORMAL ENFORCEMENT ACTION
ALLIANCE CARPET CUSHION OHIO (143 COMMERCE BLVD in JOHNSTOWN, OH)
TRI REPORTER (Tracking of toxic chemicals releasing facilities) Business SIC classification: PLASTICS FOAM PRODUCTS Alternative names: MOHAWK INDS. - ATTEN DENISE WOOD
BACHMAN AGRICULTURAL SERVICE INCORPORATED (16062 CENTERVILLAGE ROAD in JOHNSTOWN, OH)
ENFORCEMENT/COMPLIANCE ACTIVITY (Integrated Compliance Information System)
Housing units lacking complete plumbing facilities: 0.2% Housing units lacking complete kitchen facilities: 0.8%
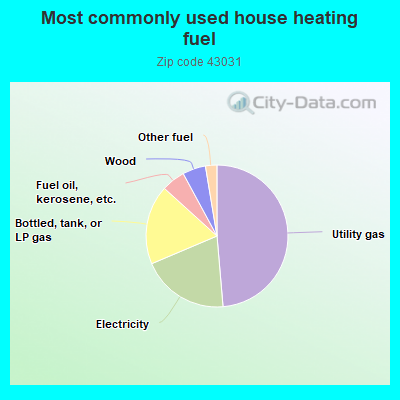
48.7%Utility gas
20.0%Electricity
18.1%Bottled, tank, or LP gas
5.4%Fuel oil, kerosene, etc.
5.3%Wood
2.6%Other fuel
Population in 1990: 7,550. Population change in the 1990s: +2,620 (+34.7%).
Place of birth for U.S.-born residents:
This state: 11,077
Northeast: 973
Midwest: 507
South: 1,011
West: 300
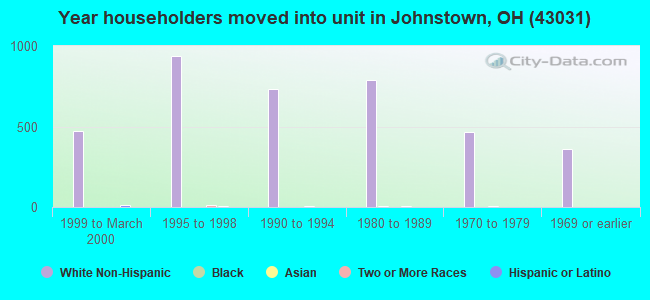
63% of the 43031 zip code residents lived in the same house 5 years ago. Out of people who lived in different houses, 42% lived in this county. Out of people who lived in different counties, 50% lived in Ohio.
92% of the 43031 zip code residents lived in the same house 1 year ago. Out of people who lived in different houses, 26% moved from this county. Out of people who lived in different houses, 63% moved from different county within same state. Out of people who lived in different houses, 16% moved from different state.
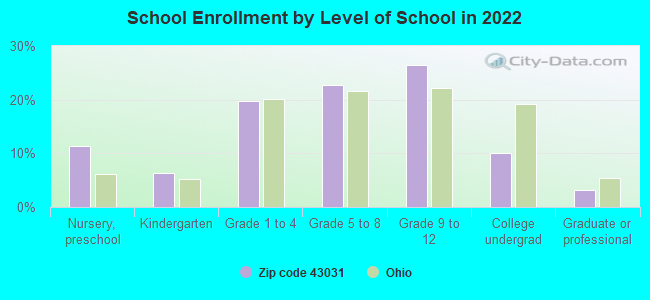
Private vs. public school enrollment:
Students in private schools in grades 1 to 8 (elementary and middle school): 97
Here:
6.9%
Ohio:
16.0%
Students in private schools in grades 9 to 12 (high school): 97
Here:
11.1%
Ohio:
13.1%
Students in private undergraduate colleges: 81
Here:
24.1%
Ohio:
22.3%
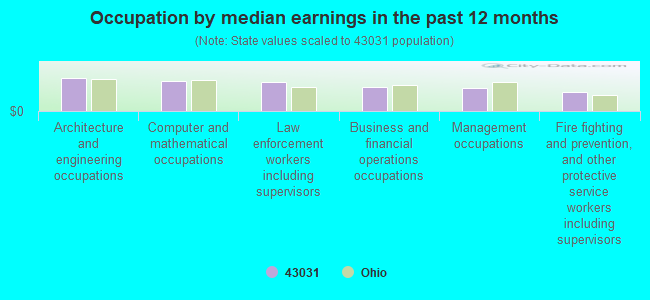
Occupation by median earnings in the past 12 months ($)
122,398Architecture and engineering occupations
110,891Computer and mathematical occupations
106,869Law enforcement workers including supervisors
87,539Business and financial operations occupations
83,626Management occupations
68,229Fire fighting and prevention, and other protective service workers including supervisors
Companies with federal contracts located in this zip code:
TRUFLEX RUBBER PRODUCTS INC (200 E COSHOCTON STREET in JOHNSTOWN, OH; small business) : $139,739 in 26 contractsfrom 2002 to 2005
Contracts for Tire Rebuilding and Tire and Tube Repair Materials, Tires and Tubes, Pneumatic, Except Aircraft by Army Signed by year:2000: $0; 2001: $0; 2002: $6,733; 2003: $54,899; 2004: $42,321; 2005: $35,786; 2006: $0.
Biggest contracts:
$26,776 with Army for Tire Rebuilding and Tire and Tube Repair Materials. Signed on 2004-01-12. Completion date: 2004-05-30.
$17,365, same as above.Signed on 2005-06-15. Completion date: 2005-07-18.
$15,568, same as above.Signed on 2003-10-29. Completion date: 2006-09-24.
$13,778, same as above.Signed on 2005-03-29. Completion date: 2006-09-24.
Top industries in this zip code by the number of employees in 2005:
2002 - 2018 National Fire Incident Reporting System (NFIRS) incidents
Based on the data from the years 2002 - 2018 the average number of fires per year is 79. The highest number of reported fires - 112 took place in 2009, and the least - 48 in 2002. The data has a rising trend.
When looking into fire subcategories, the most incidents belonged to: Structure Fires (56.0%), and Outside Fires (31.8%).
Fire incident types reported to NFIRS in Zip Code 43031


 Nearest zip codes: 43013, 43001, 43011, 43023, 43062, 43054.


 Based on the data from the years 2002 - 2018 the average number of fires per year is 79. The highest number of reported fires - 112 took place in 2009, and the least - 48 in 2002. The data has a rising trend.
 When looking into fire subcategories, the most incidents belonged to: Structure Fires (56.0%), and Outside Fires (31.8%).