Estimated zip code population in 2022: 3,675 Zip code population in 2010: 3,619 Zip code population in 2000: 3,641
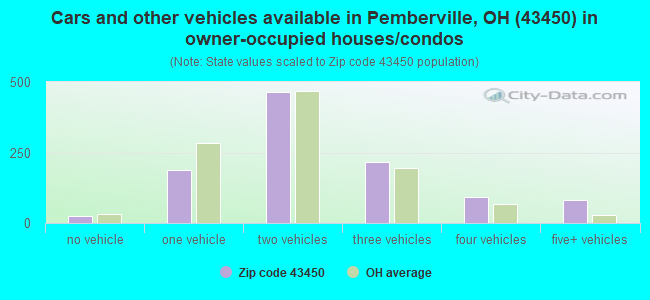
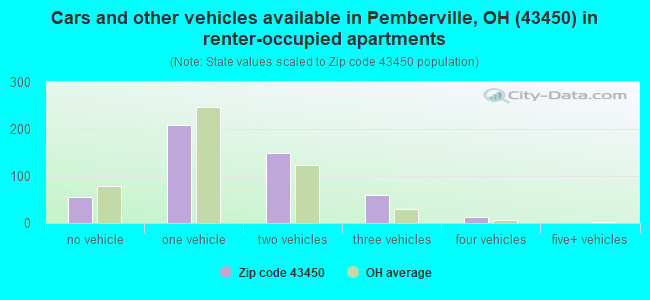
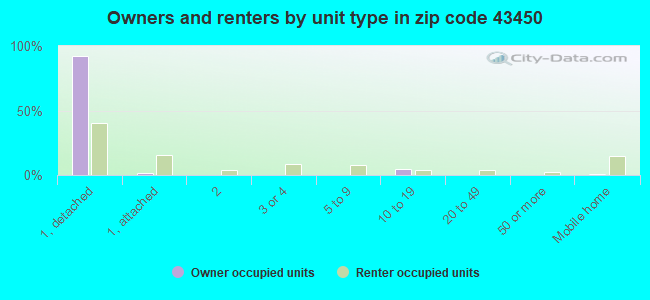
Houses and condos: 1,739 Renter-occupied apartments: 488
% of renters here:
31%
State:
33%
March 2022 cost of living index in zip code 43450: 84.9 (less than average, U.S. average is 100)
Land area: 42.6 sq. mi. Water area: 0.0 sq. mi.
Population density: 86 people per square mile
(very low).
OSM Map
General Map
Google Map
MSN Map
OSM Map
General Map
Google Map
MSN Map
OSM Map
General Map
Google Map
MSN Map
OSM Map
General Map
Google Map
MSN Map
Please wait while loading the map...
Real estate property taxes paid for housing units in 2022:
This zip code:
1.1% ($2,706)
Ohio:
1.3% ($2,639)
Median real estate property taxes paid for housing units with mortgages in 2022: $2,580 (1.1%) Median real estate property taxes paid for housing units with no mortgage in 2022: $2,989 (1.2%)
Business Search- 14 Million verified businesses
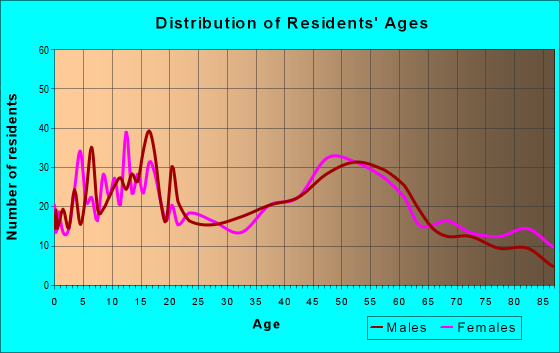
Males: 1,787
(48.6%)
Females: 1,887
(51.4%)
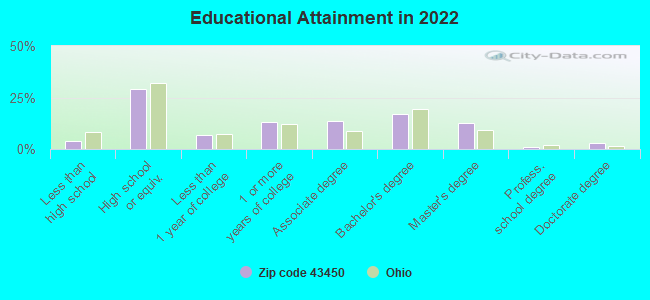
For population 25 years and over in 43450:
High school or higher: 96.2%
Bachelor's degree or higher: 33.3%
Graduate or professional degree: 16.3%
Unemployed: 2.2%
Mean travel time to work (commute): 23.4 minutes
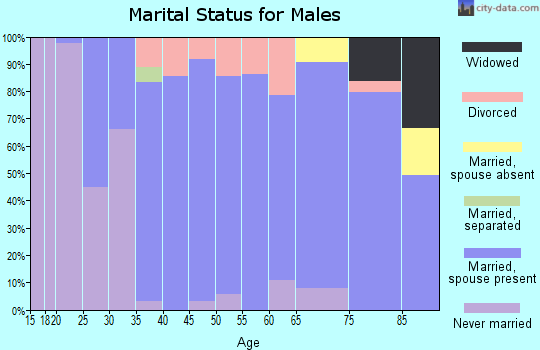
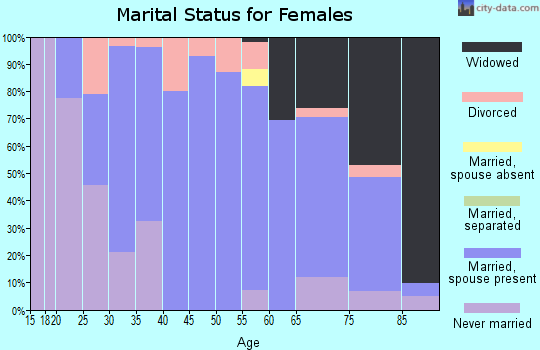
For population 15 years and over in 43450:
Never married: 23.3%
Now married: 59.8%
Separated: 1.0%
Widowed: 5.6%
Divorced: 10.3%
Zip code 43450 compared to state average:
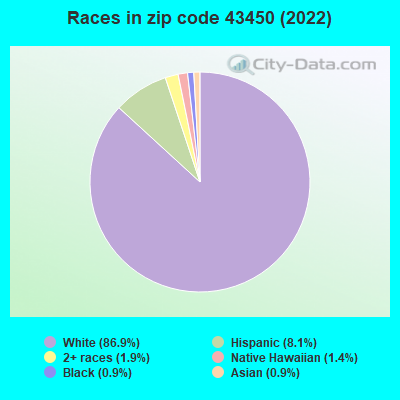
Black race population percentage significantly below state average.
Hispanic race population percentage above state average.
Median age significantly above state average.
Foreign-born population percentage below state average.
Length of stay since moving in significantly above state average.
Estimated median house/condo value in 2022: $242,960
43450:
$242,960
Ohio:
$204,100
According to our research of Ohio and other state lists, there were 7 registered sex offenders living in 43450 zip code as of April 18, 2024. The ratio of all residents to sex offenders in zip code 43450 is 512 to 1. The ratio of registered sex offenders to all residents in this zip code is near the state average.
Median resident age:
This zip code:
48.0 years
Ohio median age:
39.9 years
Average household size:
This zip code:
2.3 people
Ohio:
2.4 people
Averages for the 2020 tax year for zip code 43450, filed in 2021:
Average Adjusted Gross Income (AGI) in 2020: $71,396 (Individual Income Tax Returns)
Here:
$71,396
State:
$67,288
Salary/wage: $59,327 (reported on 76.6% of returns)
Here:
$59,327
State:
$55,628
(% of AGI for various income ranges: 1222.8% for AGIs below $25k, 3597.2% for AGIs $25k-50k, 6193.3% for AGIs $50k-75k, 8155.0% for AGIs $75k-100k, 16832.8% for AGIs $100k-200k)
Taxable interest for individuals: $998 (reported on 36.6% of returns)
This zip code:
$998
Ohio:
$1,518
(% of AGI for various income ranges: 22.0% for AGIs below $25k, 36.6% for AGIs $25k-50k, 44.3% for AGIs $50k-75k, 38.6% for AGIs $75k-100k, 63.3% for AGIs $100k-200k)
Ordinary dividends: $3,024 (reported on 28.6% of returns)
Here:
$3,024
State:
$7,167
(% of AGI for various income ranges: 49.6% for AGIs below $25k, 45.9% for AGIs $25k-50k, 71.9% for AGIs $50k-75k, 151.4% for AGIs $75k-100k, 188.3% for AGIs $100k-200k)
Net capital gain/loss in AGI: +$7,432 (reported on 25.1% of returns)
Here:
+$7,432
State:
+$18,919
(% of AGI for various income ranges: 23.6% for AGIs below $25k, 31.2% for AGIs $25k-50k, 132.4% for AGIs $50k-75k, 200.0% for AGIs $75k-100k, 636.1% for AGIs $100k-200k)
Profit/loss from business: +$10,000 (reported on 13.1% of returns)
Here:
+$10,000
State:
+$13,744
(% of AGI for various income ranges: 45.2% for AGIs below $25k, 91.6% for AGIs $25k-50k, 225.2% for AGIs $50k-75k, 363.6% for AGIs $75k-100k, 506.7% for AGIs $100k-200k)
Taxable individual retirement arrangement distribution: $15,810 (reported on 16.6% of returns)
43450:
$15,810
Ohio:
$18,876
(% of AGI for various income ranges: 152.0% for AGIs below $25k, 138.4% for AGIs $25k-50k, 331.9% for AGIs $50k-75k, 604.3% for AGIs $75k-100k, 1232.8% for AGIs $100k-200k)
Total itemized deductions: $23,880 (reported on 5.7% of returns)
Here:
$23,880
State:
$33,869
(% of AGI for various income ranges: 264.8% for AGIs below $25k, 231.0% for AGIs $50k-75k, 689.4% for AGIs $100k-200k)
Charity contributions: $6,300 (reported on 4.6% of returns)
Here:
$6,300
State:
$14,577
(% of AGI for various income ranges: 64.8% for AGIs $50k-75k, 204.4% for AGIs $100k-200k)
Taxes paid: $5,578 (reported on 5.1% of returns)
43450:
$5,578
State:
$7,681
(% of AGI for various income ranges: 15.2% for AGIs below $25k, 56.2% for AGIs $50k-75k, 192.2% for AGIs $100k-200k)
Earned income credit: $2,327 (reported on 6.3% of returns)
Here:
$2,327
State:
$2,304
(% of AGI for various income ranges: 55.6% for AGIs below $25k, 36.6% for AGIs $25k-50k)
Percentage of individuals using paid preparers for their 2020 taxes: 94.9%
Here:
95%
State:
94%
(% for various income ranges: 92.7% for AGIs below $25k, 95.3% for AGIs $25k-50k, 93.8% for AGIs $50k-75k, 95.5% for AGIs $75k-100k, 96.8% for AGIs $100k-200k, 100.0% for AGIs over 200k)
Averages for the 2012 tax year for zip code 43450, filed in 2013:
Average Adjusted Gross Income (AGI) in 2012: $54,021 (Individual Income Tax Returns)
Here:
$54,021
State:
$54,926
Salary/wage: $45,206 (reported on 79.0% of returns)
Here:
$45,206
State:
$45,869
(% of AGI for various income ranges: 64.3% for AGIs below $25k, 69.4% for AGIs $25k-50k, 69.4% for AGIs $50k-75k, 71.2% for AGIs $75k-100k, 69.1% for AGIs $100k-200k, 38.6% for AGIs over 200k)
Taxable interest for individuals: $1,114 (reported on 39.8% of returns)
This zip code:
$1,114
Ohio:
$1,297
(% of AGI for various income ranges: 2.2% for AGIs below $25k, 1.2% for AGIs $25k-50k, 0.7% for AGIs $50k-75k, 0.6% for AGIs $75k-100k, 0.6% for AGIs $100k-200k, 0.5% for AGIs over 200k)
Ordinary dividends: $2,222 (reported on 27.6% of returns)
Here:
$2,222
State:
$5,821
(% of AGI for various income ranges: 1.5% for AGIs below $25k, 1.6% for AGIs $25k-50k, 1.3% for AGIs $50k-75k, 1.0% for AGIs $75k-100k, 1.2% for AGIs $100k-200k)
Net capital gain/loss in AGI: +$2,795 (reported on 20.4% of returns)
Here:
+$2,795
State:
+$11,232
(% of AGI for various income ranges: 0.8% for AGIs $75k-100k, 3.4% for AGIs $100k-200k)
Profit/loss from business: +$8,585 (reported on 14.4% of returns)
Here:
+$8,585
State:
+$12,773
(% of AGI for various income ranges: 6.0% for AGIs below $25k, 2.5% for AGIs $25k-50k, 1.1% for AGIs $50k-75k, 1.7% for AGIs $75k-100k, 3.1% for AGIs $100k-200k)
Taxable individual retirement arrangement distribution: $11,262 (reported on 14.4% of returns)
43450:
$11,262
Ohio:
$14,511
(% of AGI for various income ranges: 4.7% for AGIs below $25k, 3.2% for AGIs $25k-50k, 3.7% for AGIs $50k-75k, 2.6% for AGIs $75k-100k, 3.3% for AGIs $100k-200k)
Total itemized deductions: $17,916 (20% of AGI, reported on 35.4% of returns)
Here:
$17,916
State:
$21,278
Here:
20.3% of AGI
State:
18.8% of AGI
(% of AGI for various income ranges: 12.7% for AGIs below $25k, 9.1% for AGIs $25k-50k, 11.9% for AGIs $50k-75k, 12.8% for AGIs $75k-100k, 12.7% for AGIs $100k-200k, 10.0% for AGIs over 200k)
Charity contributions: $2,932 (reported on 27.6% of returns)
Here:
$2,932
State:
$3,943
(% of AGI for various income ranges: 1.4% for AGIs below $25k, 1.2% for AGIs $25k-50k, 1.1% for AGIs $50k-75k, 1.7% for AGIs $75k-100k, 2.0% for AGIs $100k-200k, 1.1% for AGIs over 200k)
Taxes paid: $6,841 (reported on 34.8% of returns)
43450:
$6,841
State:
$9,568
(% of AGI for various income ranges: 2.1% for AGIs below $25k, 2.2% for AGIs $25k-50k, 3.8% for AGIs $50k-75k, 4.8% for AGIs $75k-100k, 6.2% for AGIs $100k-200k, 4.8% for AGIs over 200k)
Earned income credit: $1,700 (reported on 10.5% of returns)
Here:
$1,700
State:
$2,285
(% of AGI for various income ranges: 2.9% for AGIs below $25k, 0.7% for AGIs $25k-50k)
Percentage of individuals using paid preparers for their 2012 taxes: 59.1%
Here:
59%
State:
51%
(% for various income ranges: 48.4% for AGIs below $25k, 64.3% for AGIs $25k-50k, 64.5% for AGIs $50k-75k, 60.0% for AGIs $75k-100k, 65.2% for AGIs $100k-200k, 100.0% for AGIs over 200k)
Averages for the 2004 tax year for zip code 43450, filed in 2005:
Average Adjusted Gross Income (AGI) in 2004: $40,798 (Individual Income Tax Returns)
Here:
$40,798
State:
$44,480
Salary/wage: $39,095 (reported on 81.5% of returns)
Here:
$39,095
State:
$39,198
(% of AGI for various income ranges: 88.8% for AGIs below $10k, 61.6% for AGIs $10k-25k, 74.2% for AGIs $25k-50k, 82.7% for AGIs $50k-75k, 87.2% for AGIs $75k-100k, 74.2% for AGIs over 100k)
Taxable interest for individuals: $1,088 (reported on 55.9% of returns)
This zip code:
$1,088
Ohio:
$1,532
(% of AGI for various income ranges: 8.7% for AGIs below $10k, 5.1% for AGIs $10k-25k, 1.9% for AGIs $25k-50k, 0.8% for AGIs $50k-75k, 0.5% for AGIs $75k-100k, 0.5% for AGIs over 100k)
Taxable dividends: $1,260 (reported on 30.5% of returns)
Here:
$1,260
State:
$3,496
(% of AGI for various income ranges: 2.9% for AGIs below $10k, 2.0% for AGIs $10k-25k, 1.0% for AGIs $25k-50k, 0.9% for AGIs $50k-75k, 0.4% for AGIs $75k-100k, 0.7% for AGIs over 100k)
Net capital gain/loss: +$1,935 (reported on 21.8% of returns)
Here:
+$1,935
State:
+$8,582
(% of AGI for various income ranges: -0.8% for AGIs below $10k, 0.1% for AGIs $10k-25k, 0.2% for AGIs $25k-50k, 1.5% for AGIs $50k-75k, 1.2% for AGIs $75k-100k, 1.9% for AGIs over 100k)
Profit/loss from business: +$5,725 (reported on 13.8% of returns)
Here:
+$5,725
State:
+$10,813
(% of AGI for various income ranges: 6.2% for AGIs below $10k, 5.1% for AGIs $10k-25k, 3.4% for AGIs $25k-50k, 0.0% for AGIs $50k-75k, 1.8% for AGIs $75k-100k, 1.0% for AGIs over 100k)
IRA payment deduction: $2,561 (reported on 2.3% of returns)
43450:
$2,561
Ohio:
$2,794
Self-employed pension: $4,562 (reported on 0.9% of returns)
Here:
$4,562
Ohio:
$13,981
Total itemized deductions: $14,171 (22% of AGI, reported on 38.9% of returns)
Here:
$14,171
State:
$17,503
Here:
21.9% of AGI
State:
20.8% of AGI
(% of AGI for various income ranges: 11.4% for AGIs $10k-25k, 12.6% for AGIs $25k-50k, 14.5% for AGIs $50k-75k, 15.1% for AGIs $75k-100k, 13.9% for AGIs over 100k)
Charity contributions deductions: $2,205 (3% of AGI, reported on 32.4% of returns)
Here:
$2,205
State:
$3,087
Here:
3.2% of AGI
State:
3.4% of AGI
(% of AGI for various income ranges: 1.2% for AGIs $10k-25k, 1.4% for AGIs $25k-50k, 2.0% for AGIs $50k-75k, 2.1% for AGIs $75k-100k, 2.0% for AGIs over 100k)
Total tax: $4,734 (reported on 81.7% of returns)
43450:
$4,734
State:
$6,781
(% of AGI for various income ranges: 2.8% for AGIs below $10k, 5.0% for AGIs $10k-25k, 7.8% for AGIs $25k-50k, 8.5% for AGIs $50k-75k, 9.8% for AGIs $75k-100k, 15.8% for AGIs over 100k)
Earned income credit: $1,450 (reported on 6.1% of returns)
Here:
$1,450
State:
$1,696
Percentage of individuals using paid preparers for their 2004 taxes: 57.2%
Here:
57%
State:
55%
(% for various income ranges: 47.2% for AGIs below $10k, 55.3% for AGIs $10k-25k, 65.7% for AGIs $25k-50k, 58.2% for AGIs $50k-75k, 55.0% for AGIs $75k-100k, 55.7% for AGIs over 100k)
Likely homosexual households (counted as self-reported same-sex unmarried-partner households)
Lesbian couples: 0.2% of all households
Gay men: 0.0% of all households
Household received Food Stamps/SNAP in the past 12 months: 113 Household did not receive Food Stamps/SNAP in the past 12 months: 1,451
Women who had a birth in the past 12 months: 17 (14 now married, 3 unmarried) Women who did not have a birth in the past 12 months: 758 (326 now married, 431 unmarried)
Housing units in zip code 43450 with a mortgage: 586 (94 second mortgage, 82 both second mortgage and home equity loan) Houses without a mortgage: 69
Median monthly owner costs for units with a mortgage: $1,442 Median monthly owner costs for units without a mortgage: $652
Residents with income below the poverty level in 2022:
This zip code:
10.0%
Whole state:
13.4%
Residents with income below 50% of the poverty level in 2022:
This zip code:
7.6%
Whole state:
7.0%
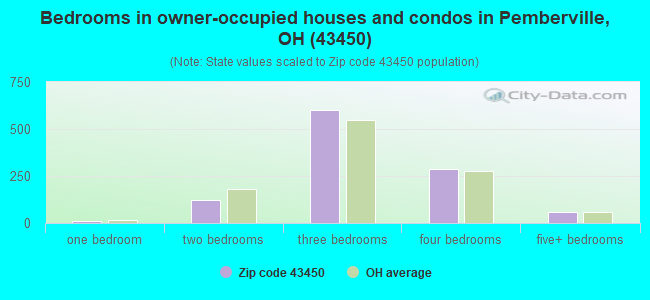
Median number of rooms in houses and condos:
Here:
7.4
State:
6.7
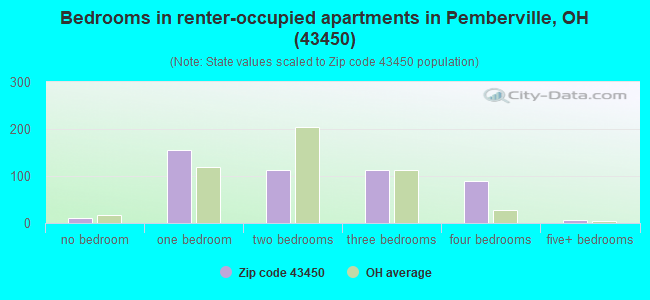
Median number of rooms in apartments:
Here:
4.4
State:
4.4
Notable locations in this zip code not listed on our city pages
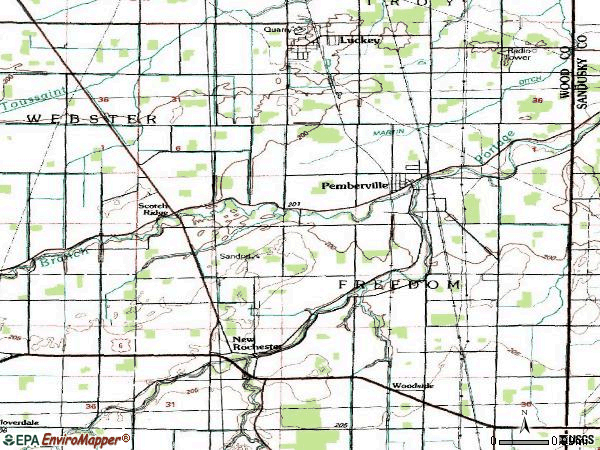
Cemeteries: Brandeberry Cemetery (1), Scotch Ridge Cemetery (2), Myers Cemetery (3), Eisenhour Cemetery (4), Fish Cemetery (5), Pemberville Cemetery (6). Display/hide their locations on the map
Rivers and creeks: North Branch Portage River (A), Middle Branch Portage River (B), Yankey Creek (C), South Branch Portage River (D). Display/hide their locations on the map
In group quarters: 53 (-1 institutionalized population)
Size of family households: 639 2-persons, 181 3-persons, 244 4-persons, 50 5-persons, 20 6-persons, 1 7-or-more-persons
Size of nonfamily households: 349 1-person, 73 2-persons, 2 3-persons
438 married couples with children.
192 single-parent households (7 men, 185 women).
94.1% of residents of 43450 zip code speak English at home.
3.4% of residents speak Spanish at home (82% very well, 17% well, 2% not well).
0.5% of residents speak other Indo-European language at home (100% very well).
2.1% of residents speak Asian or Pacific Island language at home (100% very well).
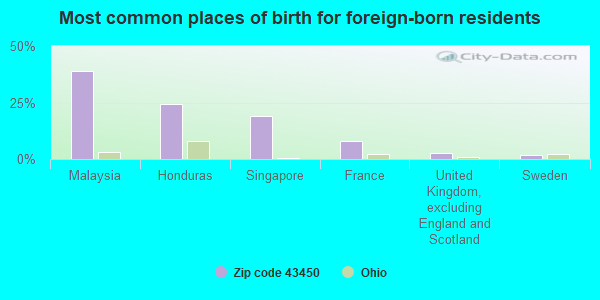
Foreign born population: 116 (3.2%) (87.8% of them are naturalized citizens)
This zip code:
3.2%
Whole state:
5.0%
39%Malaysia
24%Honduras
19%Singapore
8%France
3%United Kingdom, excluding England and Scotland
2%Sweden
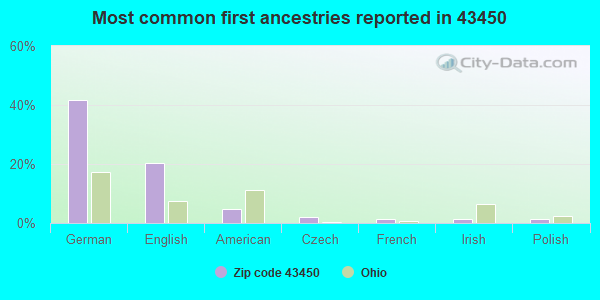
42%German
20%English
5%American
2%Czech
2%French
1%Irish
1%Polish
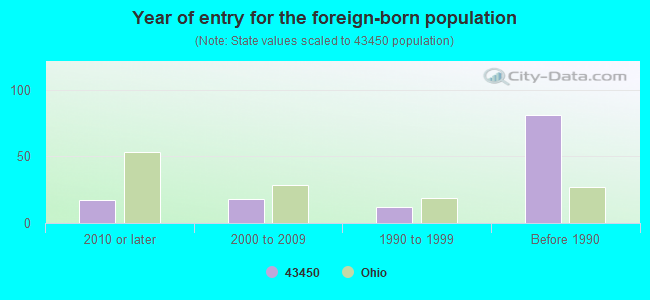
Year of entry for the foreign-born population
172010 or later
182000 to 2009
121990 to 1999
81Before 1990
Facilities with environmental interests located in this zip code:
ALLTEL - SCOTCH RIDGE (7393 ST. RT. 105 in PEMBERVILLE, OH)
(Integrated Compliance Information System) - ICIS-HQ-2000-6004, FORMAL ENFORCEMENT ACTION
Housing units lacking complete kitchen facilities: 3.6%
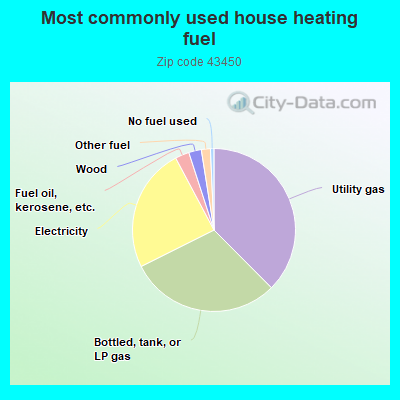
37.7%Utility gas
30.2%Bottled, tank, or LP gas
24.7%Electricity
2.8%Fuel oil, kerosene, etc.
2.5%Wood
1.8%Other fuel
0.7%No fuel used
Population in 1990: 2,569. Population change in the 1990s: +1,072 (+41.7%).
Place of birth for U.S.-born residents:
This state: 3,136
Northeast: 37
Midwest: 154
South: 136
West: 69
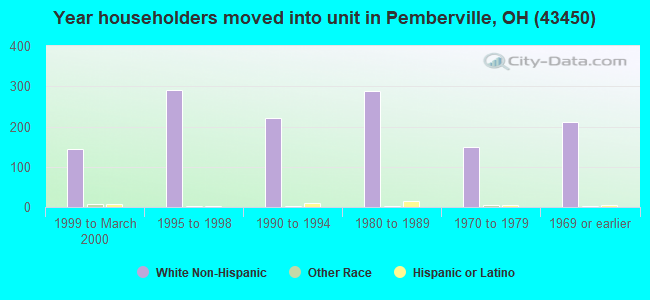
68% of the 43450 zip code residents lived in the same house 5 years ago. Out of people who lived in different houses, 60% lived in this county. Out of people who lived in different counties, 50% lived in Ohio.
82% of the 43450 zip code residents lived in the same house 1 year ago. Out of people who lived in different houses, 48% moved from this county. Out of people who lived in different houses, 36% moved from different county within same state. Out of people who lived in different houses, 11% moved from different state. Out of people who lived in different houses, 1% moved from abroad.
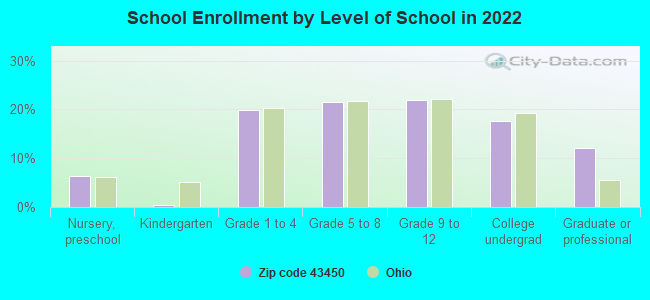
Private vs. public school enrollment:
Students in private schools in grades 1 to 8 (elementary and middle school): 2
Here:
0.6%
Ohio:
16.0%
Students in private schools in grades 9 to 12 (high school): 11
Here:
5.9%
Ohio:
13.1%
Students in private undergraduate colleges: 15
Here:
10.4%
Ohio:
22.3%
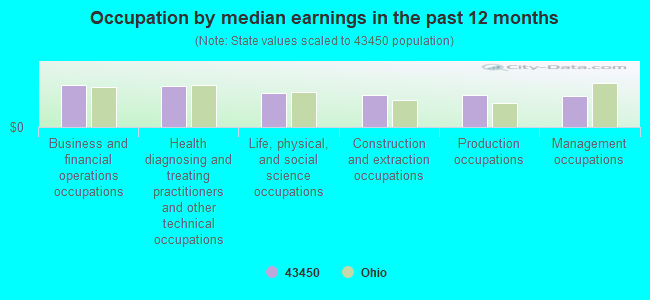
Occupation by median earnings in the past 12 months ($)
107,902Business and financial operations occupations
104,901Health diagnosing and treating practitioners and other technical occupations
86,310Life, physical, and social science occupations
82,492Construction and extraction occupations
81,938Production occupations
80,668Management occupations
Top industries in this zip code by the number of employees in 2005:
Health Care and Social Assistance: Continuing Care Retirement Communities (100-249 employees: 1 establishment)
Accommodation and Food Services: Limited-Service Restaurants (50-99: 1)
Accommodation and Food Services: Full-Service Restaurants (10-19: 2, 1-4: 2)
Other Services (except Public Administration): Coin-Operated Laundries and Drycleaners (20-49: 1)
Wholesale Trade: Grain and Field Bean Merchant Wholesalers (20-49: 1)
People in group quarters in 2010:
42 people in nursing facilities/skilled-nursing facilities
3 people in group homes for juveniles (non-correctional)
People in group quarters in 2000:
107 people in nursing homes
18 people in other types of correctional institutions
Fatal accident statistics in 2012:
Fatal accident count: 1
Vehicles involved in fatal accidents: 2
Fatal accidents caused by drunken drivers: 0
Fatalities: 1
Persons involved in fatal accidents: 2
Pedestrians involved in fatal accidents: 0
Fatal accident statistics in 2011:
Fatal accident count: 1
Vehicles involved in fatal accidents: 1
Fatal accidents caused by drunken drivers: 1
Fatalities: 1
Persons involved in fatal accidents: 1
Pedestrians involved in fatal accidents: 0
Home Mortgage Disclosure Act Aggregated Statistics For Year 2009 (Based on 4 partial tracts)
A) FHA, FSA/RHS & VA Home Purchase Loans
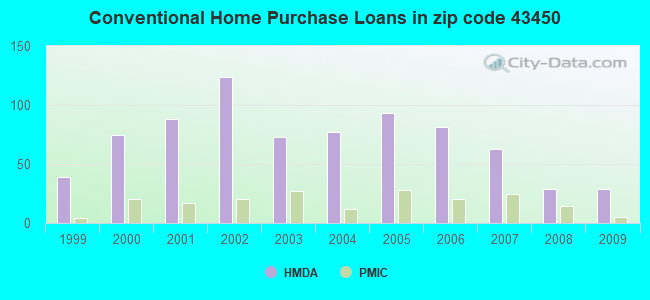
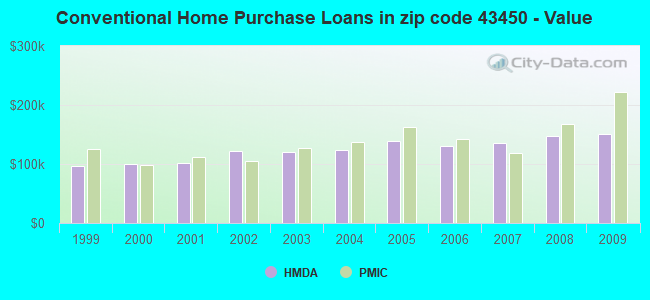
B) Conventional Home Purchase Loans
C) Refinancings
D) Home Improvement Loans
F) Non-occupant Loans on < 5 Family Dwellings (A B C & D)
G) Loans On Manufactured Home Dwelling (A B C & D)
Number
Average Value
Number
Average Value
Number
Average Value
Number
Average Value
Number
Average Value
Number
Average Value
LOANS ORIGINATED
9
$138,247
29
$151,176
128
$141,072
5
$68,336
8
$79,168
0
$0
APPLICATIONS APPROVED, NOT ACCEPTED
1
$134,410
1
$103,740
15
$139,409
3
$15,180
1
$103,740
1
$66,020
APPLICATIONS DENIED
1
$119,860
6
$81,493
47
$172,667
4
$75,342
2
$52,820
1
$43,360
APPLICATIONS WITHDRAWN
0
$0
4
$194,428
26
$152,173
1
$15,610
0
$0
0
$0
FILES CLOSED FOR INCOMPLETENESS
1
$90,030
0
$0
6
$135,372
0
$0
0
$0
0
$0
Aggregated Statistics For Year 2008 (Based on 4 partial tracts)
A) FHA, FSA/RHS & VA Home Purchase Loans
B) Conventional Home Purchase Loans
C) Refinancings
D) Home Improvement Loans
F) Non-occupant Loans on < 5 Family Dwellings (A B C & D)
G) Loans On Manufactured Home Dwelling (A B C & D)
Number
Average Value
Number
Average Value
Number
Average Value
Number
Average Value
Number
Average Value
Number
Average Value
LOANS ORIGINATED
11
$113,853
29
$147,384
65
$134,385
10
$47,332
5
$85,162
4
$69,322
APPLICATIONS APPROVED, NOT ACCEPTED
1
$82,830
6
$57,080
13
$129,975
1
$22,810
1
$100,830
4
$63,875
APPLICATIONS DENIED
0
$0
7
$80,374
50
$141,052
12
$45,339
2
$49,925
5
$85,410
APPLICATIONS WITHDRAWN
2
$94,960
9
$118,544
12
$192,982
0
$0
1
$69,840
1
$146,850
FILES CLOSED FOR INCOMPLETENESS
0
$0
1
$47,720
5
$115,732
1
$51,620
0
$0
0
$0
Aggregated Statistics For Year 2007 (Based on 4 partial tracts)
A) FHA, FSA/RHS & VA Home Purchase Loans
B) Conventional Home Purchase Loans
C) Refinancings
D) Home Improvement Loans
F) Non-occupant Loans on < 5 Family Dwellings (A B C & D)
G) Loans On Manufactured Home Dwelling (A B C & D)
Number
Average Value
Number
Average Value
Number
Average Value
Number
Average Value
Number
Average Value
Number
Average Value
LOANS ORIGINATED
2
$142,885
63
$136,347
72
$113,938
20
$50,171
9
$72,436
2
$43,815
APPLICATIONS APPROVED, NOT ACCEPTED
1
$163,250
5
$92,176
22
$117,678
5
$14,376
2
$112,840
4
$35,612
APPLICATIONS DENIED
1
$147,650
12
$82,036
77
$123,637
11
$89,114
1
$187,260
7
$48,806
APPLICATIONS WITHDRAWN
2
$149,450
3
$151,493
34
$151,657
4
$87,255
2
$187,260
1
$66,020
FILES CLOSED FOR INCOMPLETENESS
0
$0
0
$0
9
$151,759
0
$0
0
$0
0
$0
Aggregated Statistics For Year 2006 (Based on 4 partial tracts)
A) FHA, FSA/RHS & VA Home Purchase Loans
B) Conventional Home Purchase Loans
C) Refinancings
D) Home Improvement Loans
F) Non-occupant Loans on < 5 Family Dwellings (A B C & D)
G) Loans On Manufactured Home Dwelling (A B C & D)
Number
Average Value
Number
Average Value
Number
Average Value
Number
Average Value
Number
Average Value
Number
Average Value
LOANS ORIGINATED
2
$178,095
81
$130,043
98
$114,228
26
$36,141
5
$115,310
5
$54,548
APPLICATIONS APPROVED, NOT ACCEPTED
0
$0
6
$108,685
24
$113,797
5
$26,146
0
$0
2
$16,150
APPLICATIONS DENIED
3
$81,433
16
$111,612
74
$120,349
16
$39,033
1
$80,320
5
$80,644
APPLICATIONS WITHDRAWN
1
$135,650
9
$129,166
39
$136,062
6
$74,565
1
$206,760
1
$37,210
FILES CLOSED FOR INCOMPLETENESS
0
$0
3
$107,623
18
$143,472
0
$0
0
$0
0
$0
Aggregated Statistics For Year 2005 (Based on 4 partial tracts)
A) FHA, FSA/RHS & VA Home Purchase Loans
B) Conventional Home Purchase Loans
C) Refinancings
D) Home Improvement Loans
F) Non-occupant Loans on < 5 Family Dwellings (A B C & D)
G) Loans On Manufactured Home Dwelling (A B C & D)
Number
Average Value
Number
Average Value
Number
Average Value
Number
Average Value
Number
Average Value
Number
Average Value
LOANS ORIGINATED
3
$110,377
93
$138,572
110
$121,667
13
$48,449
10
$83,427
2
$8,365
APPLICATIONS APPROVED, NOT ACCEPTED
0
$0
9
$122,016
23
$115,171
1
$48,560
5
$105,220
2
$17,315
APPLICATIONS DENIED
1
$63,440
17
$105,720
86
$124,608
17
$42,925
4
$94,832
7
$30,099
APPLICATIONS WITHDRAWN
0
$0
12
$142,571
46
$127,895
6
$132,917
3
$132,420
1
$53,040
FILES CLOSED FOR INCOMPLETENESS
0
$0
1
$254,300
11
$124,540
0
$0
0
$0
0
$0
Aggregated Statistics For Year 2004 (Based on 4 partial tracts)
A) FHA, FSA/RHS & VA Home Purchase Loans
B) Conventional Home Purchase Loans
C) Refinancings
D) Home Improvement Loans
F) Non-occupant Loans on < 5 Family Dwellings (A B C & D)
G) Loans On Manufactured Home Dwelling (A B C & D)
Number
Average Value
Number
Average Value
Number
Average Value
Number
Average Value
Number
Average Value
Number
Average Value
LOANS ORIGINATED
2
$128,040
77
$123,663
167
$128,386
16
$50,799
11
$62,427
3
$66,033
APPLICATIONS APPROVED, NOT ACCEPTED
0
$0
4
$94,302
28
$108,638
4
$38,302
1
$67,220
1
$41,320
APPLICATIONS DENIED
0
$0
18
$124,083
91
$135,532
11
$28,062
3
$57,253
3
$33,173
APPLICATIONS WITHDRAWN
1
$150,050
10
$154,873
47
$142,274
3
$13,943
0
$0
1
$12,800
FILES CLOSED FOR INCOMPLETENESS
0
$0
2
$89,810
13
$121,741
0
$0
0
$0
0
$0
Aggregated Statistics For Year 2003 (Based on 4 partial tracts)
A) FHA, FSA/RHS & VA Home Purchase Loans
B) Conventional Home Purchase Loans
C) Refinancings
D) Home Improvement Loans
E) Loans on Dwellings For 5+ Families
F) Non-occupant Loans on < 5 Family Dwellings (A B C & D)
Number
Average Value
Number
Average Value
Number
Average Value
Number
Average Value
Number
Average Value
Number
Average Value
LOANS ORIGINATED
1
$184,210
73
$120,479
343
$113,090
28
$25,325
1
$96,030
17
$80,429
APPLICATIONS APPROVED, NOT ACCEPTED
0
$0
3
$63,707
30
$138,625
2
$12,515
0
$0
0
$0
APPLICATIONS DENIED
0
$0
14
$58,359
85
$141,888
8
$42,096
0
$0
1
$123,350
APPLICATIONS WITHDRAWN
2
$107,510
3
$88,173
66
$123,344
1
$66,060
0
$0
4
$74,298
FILES CLOSED FOR INCOMPLETENESS
0
$0
1
$174,930
13
$106,704
2
$168,055
0
$0
0
$0
Aggregated Statistics For Year 2002 (Based on 4 partial tracts)
A) FHA, FSA/RHS & VA Home Purchase Loans
B) Conventional Home Purchase Loans
C) Refinancings
D) Home Improvement Loans
F) Non-occupant Loans on < 5 Family Dwellings (A B C & D)
Number
Average Value
Number
Average Value
Number
Average Value
Number
Average Value
Number
Average Value
LOANS ORIGINATED
4
$104,735
124
$122,180
232
$120,244
21
$19,280
10
$96,614
APPLICATIONS APPROVED, NOT ACCEPTED
0
$0
12
$73,655
32
$116,205
6
$7,287
0
$0
APPLICATIONS DENIED
0
$0
10
$59,706
56
$107,118
15
$22,745
2
$76,825
APPLICATIONS WITHDRAWN
1
$124,840
6
$112,575
49
$131,447
4
$14,560
0
$0
FILES CLOSED FOR INCOMPLETENESS
0
$0
0
$0
11
$124,802
2
$42,015
0
$0
Aggregated Statistics For Year 2001 (Based on 4 partial tracts)
A) FHA, FSA/RHS & VA Home Purchase Loans
B) Conventional Home Purchase Loans
C) Refinancings
D) Home Improvement Loans
F) Non-occupant Loans on < 5 Family Dwellings (A B C & D)
Number
Average Value
Number
Average Value
Number
Average Value
Number
Average Value
Number
Average Value
LOANS ORIGINATED
0
$0
88
$101,672
238
$106,024
25
$20,827
13
$56,760
APPLICATIONS APPROVED, NOT ACCEPTED
0
$0
5
$99,072
34
$104,174
6
$9,827
0
$0
APPLICATIONS DENIED
1
$157,250
24
$55,655
51
$84,195
16
$13,407
1
$120,040
APPLICATIONS WITHDRAWN
0
$0
4
$124,315
52
$102,394
2
$44,925
0
$0
FILES CLOSED FOR INCOMPLETENESS
0
$0
2
$100,835
11
$95,919
0
$0
0
$0
Aggregated Statistics For Year 2000 (Based on 4 partial tracts)
A) FHA, FSA/RHS & VA Home Purchase Loans
B) Conventional Home Purchase Loans
C) Refinancings
D) Home Improvement Loans
E) Loans on Dwellings For 5+ Families
F) Non-occupant Loans on < 5 Family Dwellings (A B C & D)
Number
Average Value
Number
Average Value
Number
Average Value
Number
Average Value
Number
Average Value
Number
Average Value
LOANS ORIGINATED
4
$85,292
75
$100,494
72
$90,619
23
$16,417
1
$102,030
5
$60,428
APPLICATIONS APPROVED, NOT ACCEPTED
0
$0
17
$48,705
21
$81,795
13
$12,622
0
$0
0
$0
APPLICATIONS DENIED
1
$178,860
30
$59,356
41
$74,011
9
$12,420
0
$0
2
$18,005
APPLICATIONS WITHDRAWN
1
$36,010
8
$97,688
15
$81,862
2
$5,945
0
$0
1
$75,630
FILES CLOSED FOR INCOMPLETENESS
0
$0
1
$145,250
5
$147,606
0
$0
0
$0
0
$0
Aggregated Statistics For Year 1999 (Based on 2 partial tracts)
A) FHA, FSA/RHS & VA Home Purchase Loans
B) Conventional Home Purchase Loans
C) Refinancings
D) Home Improvement Loans
F) Non-occupant Loans on < 5 Family Dwellings (A B C & D)
Detailed PMIC statistics for the following Tracts:0210.00
, 0211.00
2002 - 2018 National Fire Incident Reporting System (NFIRS) incidents
According to the data from the years 2002 - 2018 the average number of fire incidents per year is 20. The highest number of fire incidents - 37 took place in 2017, and the least - 8 in 2018. The data has a decreasing trend.
When looking into fire subcategories, the most incidents belonged to: Structure Fires (41.8%), and Outside Fires (41.5%).
Fire incident types reported to NFIRS in Zip Code 43450


 Nearest zip codes: 43443, 43406, 43466, 43463, 43469, 43551.
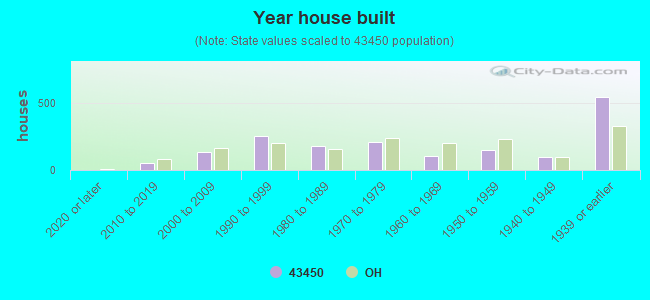


 According to the data from the years 2002 - 2018 the average number of fire incidents per year is 20. The highest number of fire incidents - 37 took place in 2017, and the least - 8 in 2018. The data has a decreasing trend.
 When looking into fire subcategories, the most incidents belonged to: Structure Fires (41.8%), and Outside Fires (41.5%).