Estimated zip code population in 2022: 2,125 Zip code population in 2010: 2,408 Zip code population in 2000: 2,564
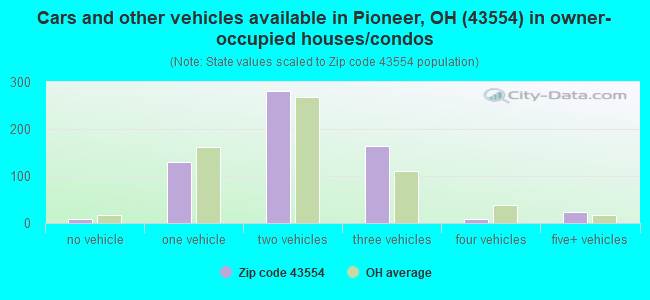
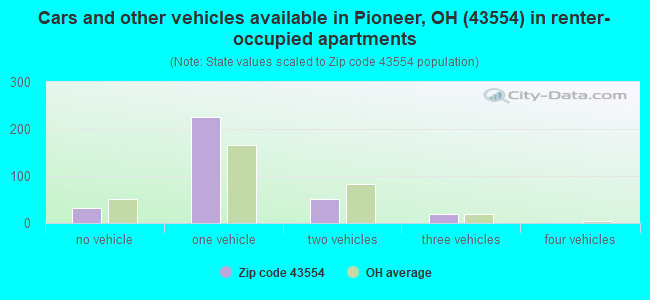
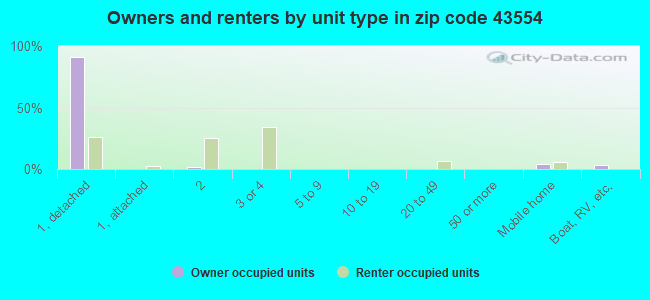
Houses and condos: 1,014 Renter-occupied apartments: 322
% of renters here:
34%
State:
33%
March 2022 cost of living index in zip code 43554: 82.9 (low, U.S. average is 100)
Land area: 34.4 sq. mi. Water area: 0.3 sq. mi.
Population density: 62 people per square mile
(very low).
OSM Map
General Map
Google Map
MSN Map
OSM Map
General Map
Google Map
MSN Map
OSM Map
General Map
Google Map
MSN Map
OSM Map
General Map
Google Map
MSN Map
Please wait while loading the map...
Real estate property taxes paid for housing units in 2022:
This zip code:
0.9% ($1,343)
Ohio:
1.3% ($2,639)
Median real estate property taxes paid for housing units with mortgages in 2022: $1,376 (0.8%) Median real estate property taxes paid for housing units with no mortgage in 2022: $1,263 (1.1%)
Business Search- 14 Million verified businesses
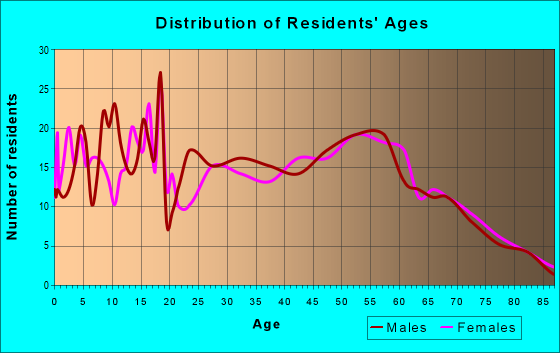
Males: 1,013
(47.7%)
Females: 1,112
(52.3%)
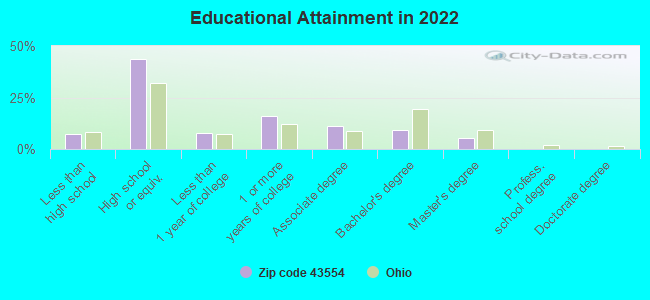
For population 25 years and over in 43554:
High school or higher: 90.8%
Bachelor's degree or higher: 14.3%
Graduate or professional degree: 5.3%
Unemployed: 3.1%
Mean travel time to work (commute): 15.0 minutes
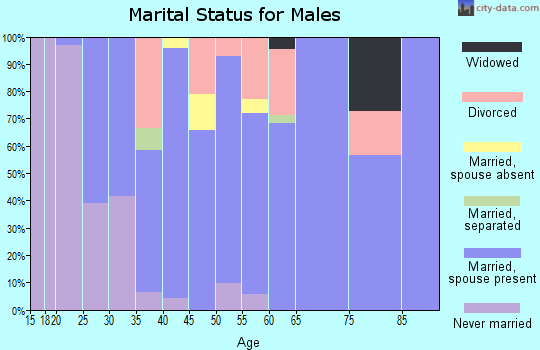
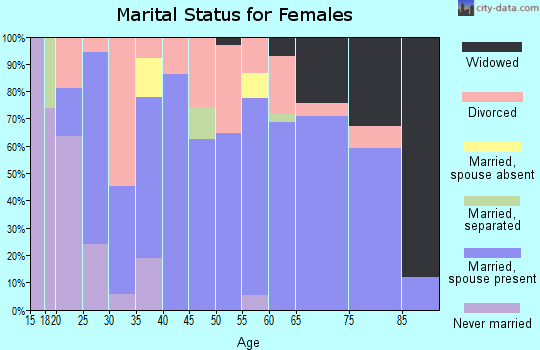
For population 15 years and over in 43554:
Never married: 31.9%
Now married: 48.2%
Separated: 0.2%
Widowed: 6.6%
Divorced: 13.0%
Zip code 43554 compared to state average:
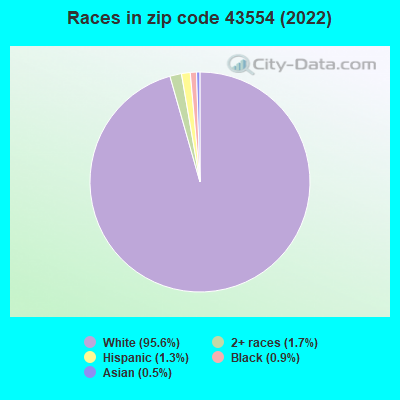
Black race population percentage significantly below state average.
Hispanic race population percentage significantly below state average.
Foreign-born population percentage significantly below state average.
Percentage of population with a bachelor's degree or higher significantly below state average.
Averages for the 2020 tax year for zip code 43554, filed in 2021:
Average Adjusted Gross Income (AGI) in 2020: $49,196 (Individual Income Tax Returns)
Here:
$49,196
State:
$67,288
Salary/wage: $40,965 (reported on 84.6% of returns)
Here:
$40,965
State:
$55,628
(% of AGI for various income ranges: 1091.0% for AGIs below $25k, 3601.2% for AGIs $25k-50k, 6082.4% for AGIs $50k-75k, 9664.3% for AGIs $75k-100k, 15412.5% for AGIs $100k-200k)
Taxable interest for individuals: $967 (reported on 25.4% of returns)
This zip code:
$967
Ohio:
$1,518
(% of AGI for various income ranges: 21.6% for AGIs below $25k, 13.2% for AGIs $25k-50k, 28.2% for AGIs $50k-75k, 44.3% for AGIs $75k-100k, 160.0% for AGIs $100k-200k)
Ordinary dividends: $1,656 (reported on 13.8% of returns)
Here:
$1,656
State:
$7,167
(% of AGI for various income ranges: 14.5% for AGIs below $25k, 7.9% for AGIs $25k-50k, 8.2% for AGIs $50k-75k, 75.7% for AGIs $75k-100k, 198.8% for AGIs $100k-200k)
Net capital gain/loss in AGI: +$5,933 (reported on 11.5% of returns)
Here:
+$5,933
State:
+$18,919
(% of AGI for various income ranges: 11.0% for AGIs below $25k, 57.1% for AGIs $25k-50k, 44.1% for AGIs $50k-75k, 157.1% for AGIs $75k-100k, 596.2% for AGIs $100k-200k)
Profit/loss from business: +$11,031 (reported on 12.3% of returns)
Here:
+$11,031
State:
+$13,744
(% of AGI for various income ranges: 109.4% for AGIs below $25k, 142.1% for AGIs $25k-50k, 174.1% for AGIs $50k-75k, 395.7% for AGIs $75k-100k, 462.5% for AGIs $100k-200k)
Taxable individual retirement arrangement distribution: $11,931 (reported on 10.0% of returns)
43554:
$11,931
Ohio:
$18,876
(% of AGI for various income ranges: 84.2% for AGIs below $25k, 57.9% for AGIs $25k-50k, 253.5% for AGIs $50k-75k, 827.5% for AGIs $100k-200k)
Earned income credit: $2,032 (reported on 16.9% of returns)
Here:
$2,032
State:
$2,304
(% of AGI for various income ranges: 87.7% for AGIs below $25k, 51.5% for AGIs $25k-50k)
Percentage of individuals using paid preparers for their 2020 taxes: 95.4%
Here:
95%
State:
94%
(% for various income ranges: 92.9% for AGIs below $25k, 95.1% for AGIs $25k-50k, 95.5% for AGIs $50k-75k, 100.0% for AGIs $75k-100k, 100.0% for AGIs $100k-200k)
Averages for the 2012 tax year for zip code 43554, filed in 2013:
Average Adjusted Gross Income (AGI) in 2012: $39,106 (Individual Income Tax Returns)
Here:
$39,106
State:
$54,926
Salary/wage: $33,642 (reported on 85.3% of returns)
Here:
$33,642
State:
$45,869
(% of AGI for various income ranges: 73.1% for AGIs below $25k, 83.8% for AGIs $25k-50k, 81.8% for AGIs $50k-75k, 83.2% for AGIs $75k-100k, 45.3% for AGIs $100k-200k)
Taxable interest for individuals: $1,297 (reported on 27.9% of returns)
This zip code:
$1,297
Ohio:
$1,297
(% of AGI for various income ranges: 1.0% for AGIs below $25k, 0.7% for AGIs $25k-50k, 0.9% for AGIs $50k-75k, 0.3% for AGIs $75k-100k, 1.6% for AGIs $100k-200k)
Ordinary dividends: $1,313 (reported on 11.6% of returns)
Here:
$1,313
State:
$5,821
(% of AGI for various income ranges: 0.5% for AGIs below $25k, 0.4% for AGIs $25k-50k, 0.5% for AGIs $50k-75k, 0.3% for AGIs $75k-100k, 0.3% for AGIs $100k-200k)
Net capital gain/loss in AGI: +$5,377 (reported on 10.1% of returns)
Here:
+$5,377
State:
+$11,232
(% of AGI for various income ranges: 0.5% for AGIs below $25k, 1.0% for AGIs $25k-50k, 0.8% for AGIs $50k-75k, 3.8% for AGIs $100k-200k)
Profit/loss from business: +$10,600 (reported on 14.0% of returns)
Here:
+$10,600
State:
+$12,773
(% of AGI for various income ranges: 7.1% for AGIs below $25k, 2.6% for AGIs $25k-50k, 3.6% for AGIs $50k-75k, 9.7% for AGIs $75k-100k)
Taxable individual retirement arrangement distribution: $5,283 (reported on 9.3% of returns)
43554:
$5,283
Ohio:
$14,511
(% of AGI for various income ranges: 2.5% for AGIs below $25k, 1.4% for AGIs $25k-50k, 2.2% for AGIs $50k-75k)
Total itemized deductions: $17,333 (19% of AGI, reported on 14.0% of returns)
Here:
$17,333
State:
$21,278
Here:
19.3% of AGI
State:
18.8% of AGI
(% of AGI for various income ranges: 6.1% for AGIs $25k-50k, 6.6% for AGIs $50k-75k, 6.0% for AGIs $75k-100k, 9.5% for AGIs $100k-200k)
Charity contributions: $4,115 (reported on 10.1% of returns)
Here:
$4,115
State:
$3,943
(% of AGI for various income ranges: 0.8% for AGIs $25k-50k, 1.9% for AGIs $50k-75k, 1.6% for AGIs $100k-200k)
Taxes paid: $5,694 (reported on 14.0% of returns)
43554:
$5,694
State:
$9,568
(% of AGI for various income ranges: 1.2% for AGIs $25k-50k, 1.9% for AGIs $50k-75k, 2.2% for AGIs $75k-100k, 4.2% for AGIs $100k-200k)
Earned income credit: $2,212 (reported on 18.6% of returns)
Here:
$2,212
State:
$2,285
(% of AGI for various income ranges: 5.6% for AGIs below $25k, 1.3% for AGIs $25k-50k)
Percentage of individuals using paid preparers for their 2012 taxes: 60.5%
Here:
60%
State:
51%
(% for various income ranges: 55.6% for AGIs below $25k, 61.5% for AGIs $25k-50k, 61.9% for AGIs $50k-75k, 75.0% for AGIs $75k-100k, 71.4% for AGIs $100k-200k)
Averages for the 2004 tax year for zip code 43554, filed in 2005:
Average Adjusted Gross Income (AGI) in 2004: $34,754 (Individual Income Tax Returns)
Here:
$34,754
State:
$44,480
Salary/wage: $31,258 (reported on 88.7% of returns)
Here:
$31,258
State:
$39,198
(% of AGI for various income ranges: 96.6% for AGIs below $10k, 76.4% for AGIs $10k-25k, 87.6% for AGIs $25k-50k, 88.9% for AGIs $50k-75k, 82.8% for AGIs $75k-100k, 44.1% for AGIs over 100k)
Taxable interest for individuals: $1,026 (reported on 40.7% of returns)
This zip code:
$1,026
Ohio:
$1,532
(% of AGI for various income ranges: 4.3% for AGIs below $10k, 2.6% for AGIs $10k-25k, 0.9% for AGIs $25k-50k, 0.6% for AGIs $50k-75k, 0.9% for AGIs $75k-100k, 1.3% for AGIs over 100k)
Taxable dividends: $972 (reported on 17.0% of returns)
Here:
$972
State:
$3,496
(% of AGI for various income ranges: 2.0% for AGIs below $10k, 1.0% for AGIs $10k-25k, 0.5% for AGIs $25k-50k, 0.1% for AGIs $50k-75k, 0.1% for AGIs $75k-100k, 0.7% for AGIs over 100k)
Net capital gain/loss: +$853 (reported on 12.6% of returns)
Here:
+$853
State:
+$8,582
(% of AGI for various income ranges: -2.0% for AGIs below $10k, -0.1% for AGIs $10k-25k, 0.4% for AGIs $25k-50k, 0.3% for AGIs $50k-75k, -0.2% for AGIs $75k-100k, 1.3% for AGIs over 100k)
Profit/loss from business: +$9,395 (reported on 12.6% of returns)
Here:
+$9,395
State:
+$10,813
(% of AGI for various income ranges: 3.1% for AGIs below $10k, 5.0% for AGIs $10k-25k, 2.7% for AGIs $25k-50k, 2.8% for AGIs $50k-75k, 7.6% for AGIs $75k-100k, 1.5% for AGIs over 100k)
IRA payment deduction: $2,935 (reported on 2.5% of returns)
43554:
$2,935
Ohio:
$2,794
Total itemized deductions: $12,612 (20% of AGI, reported on 22.6% of returns)
Here:
$12,612
State:
$17,503
Here:
20.0% of AGI
State:
20.8% of AGI
(% of AGI for various income ranges: 4.5% for AGIs $10k-25k, 6.9% for AGIs $25k-50k, 9.0% for AGIs $50k-75k, 11.8% for AGIs $75k-100k, 12.0% for AGIs over 100k)
Charity contributions deductions: $2,643 (4% of AGI, reported on 16.7% of returns)
Here:
$2,643
State:
$3,087
Here:
4.0% of AGI
State:
3.4% of AGI
(% of AGI for various income ranges: 0.6% for AGIs $10k-25k, 0.8% for AGIs $25k-50k, 1.7% for AGIs $50k-75k, 2.4% for AGIs $75k-100k, 1.6% for AGIs over 100k)
Total tax: $4,247 (reported on 75.7% of returns)
43554:
$4,247
State:
$6,781
(% of AGI for various income ranges: 2.2% for AGIs below $10k, 4.5% for AGIs $10k-25k, 6.7% for AGIs $25k-50k, 9.0% for AGIs $50k-75k, 11.3% for AGIs $75k-100k, 19.6% for AGIs over 100k)
Earned income credit: $1,548 (reported on 13.5% of returns)
Here:
$1,548
State:
$1,696
Percentage of individuals using paid preparers for their 2004 taxes: 62.6%
Here:
63%
State:
55%
(% for various income ranges: 49.6% for AGIs below $10k, 60.5% for AGIs $10k-25k, 67.5% for AGIs $25k-50k, 63.7% for AGIs $50k-75k, 72.4% for AGIs $75k-100k, 91.2% for AGIs over 100k)
Household received Food Stamps/SNAP in the past 12 months: 156 Household did not receive Food Stamps/SNAP in the past 12 months: 784
Women who had a birth in the past 12 months: 49 (27 now married, 21 unmarried) Women who did not have a birth in the past 12 months: 438 (240 now married, 197 unmarried)
Housing units in zip code 43554 with a mortgage: 378 (46 second mortgage, 47 both second mortgage and home equity loan) Houses without a mortgage: 39
Median monthly owner costs for units with a mortgage: $1,116 Median monthly owner costs for units without a mortgage: $400
Residents with income below the poverty level in 2022:
This zip code:
13.0%
Whole state:
13.4%
Residents with income below 50% of the poverty level in 2022:
This zip code:
5.5%
Whole state:
7.0%
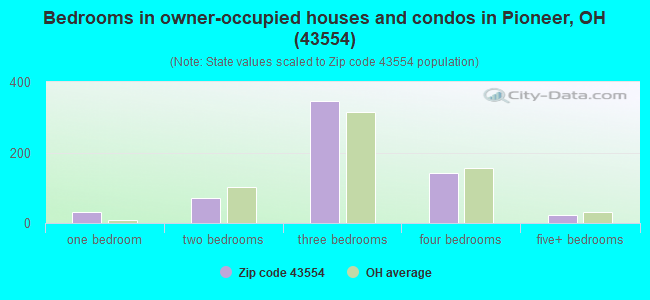
Median number of rooms in houses and condos:
Here:
6.4
State:
6.7
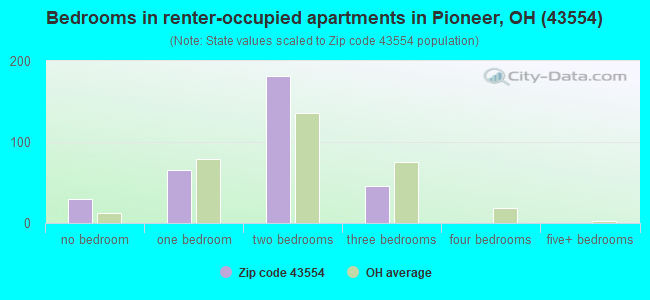
Median number of rooms in apartments:
Here:
3.8
State:
4.4
Notable locations in this zip code not listed on our city pages
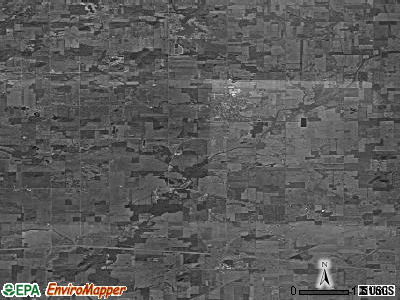
Notable locations in zip code 43554: Hay Jay Community Hall (A), Cummins Farms (B), Hinkle Farms (C), Williams County Emergency Medical Services Medic 7 (D), Pioneer Fire Department (E). Display/hide their locations on the map
Streams, rivers, and creeks: Silver Creek (A), East Branch Saint Joseph River (B), Clear Fork (C), West Branch Saint Joseph River (D). Display/hide their locations on the map
Size of family households: 278 2-persons, 114 3-persons, 50 4-persons, 32 5-persons, 39 6-persons, 10 7-or-more-persons
Size of nonfamily households: 314 1-person, 81 2-persons, 21 3-persons
345 married couples with children.
74 single-parent households (30 men, 44 women).
96.7% of residents of 43554 zip code speak English at home.
0.2% of residents speak Spanish at home (100% well).
2.9% of residents speak other Indo-European language at home (100% very well).
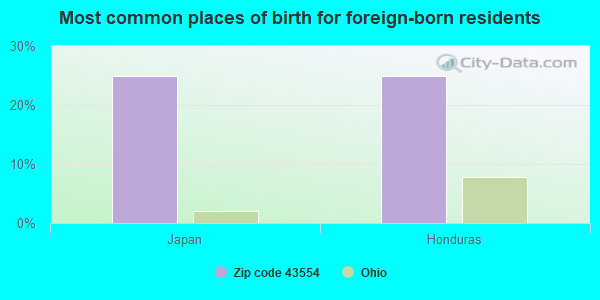
Foreign born population: 16 (0.8%) (100.0% of them are naturalized citizens)
This zip code:
0.8%
Whole state:
5.0%
25%Japan
25%Honduras
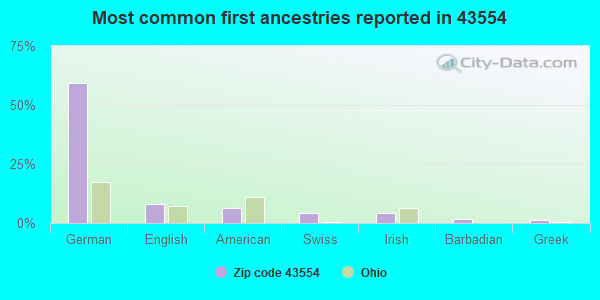
59%German
8%English
7%American
4%Swiss
4%Irish
2%Barbadian
1%Greek
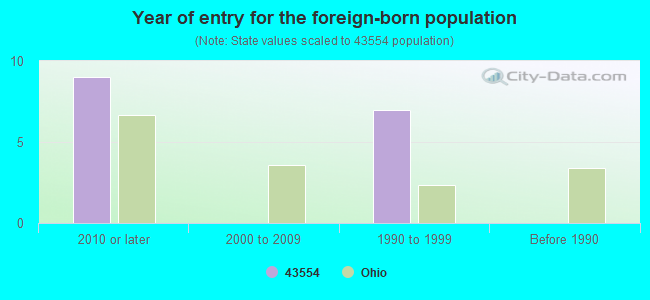
Year of entry for the foreign-born population
92010 or later
02000 to 2009
71990 to 1999
0Before 1990
Facilities with environmental interests located in this zip code:
BOSTROM KUSTOM FIT DIVISION (100 INDUSTRIAL AVE. in PIONEER, OH)
COMPLIANCE ACTIVITY (Tracking inspections of insecticide, fungicide, and rodenticide, and toxic substances) TRI REPORTER (Tracking of toxic chemicals releasing facilities) Business SIC classification: MOTOR VEHICLE PARTS AND ACCESSORIES Alternative names: BOSTROM SEATING
Housing units lacking complete plumbing facilities: 2.6% Housing units lacking complete kitchen facilities: 3.4%
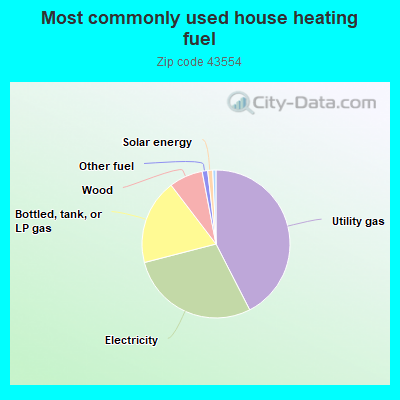
42.6%Utility gas
28.6%Electricity
18.7%Bottled, tank, or LP gas
7.4%Wood
1.2%Other fuel
1.1%Solar energy
0.7%Fuel oil, kerosene, etc.
Population in 1990: 2,350. Population change in the 1990s: +214 (+9.1%).
Place of birth for U.S.-born residents:
This state: 1,490
Northeast: 36
Midwest: 454
South: 89
West: 33
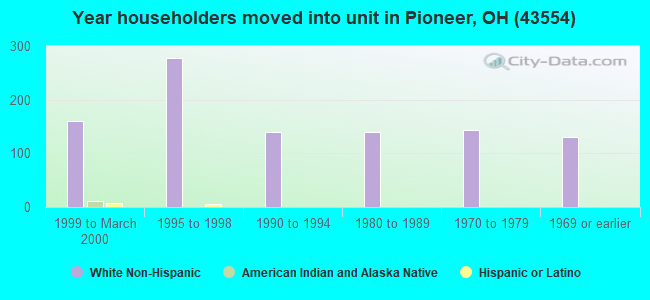
62% of the 43554 zip code residents lived in the same house 5 years ago. Out of people who lived in different houses, 66% lived in this county. Out of people who lived in different counties, 50% lived in Ohio.
89% of the 43554 zip code residents lived in the same house 1 year ago. Out of people who lived in different houses, 48% moved from this county. Out of people who lived in different houses, 25% moved from different county within same state. Out of people who lived in different houses, 25% moved from different state.
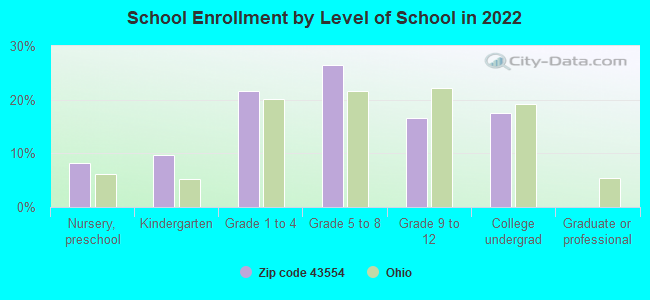
Private vs. public school enrollment:
Students in private schools in grades 1 to 8 (elementary and middle school):
Here:
0.0%
Ohio:
16.0%
Students in private schools in grades 9 to 12 (high school): 3
Here:
4.6%
Ohio:
13.1%
Students in private undergraduate colleges: 20
Here:
30.1%
Ohio:
22.3%
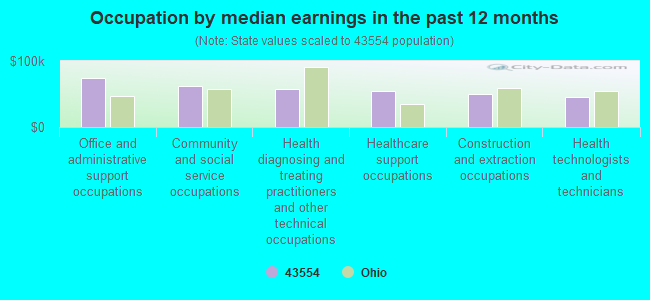
Occupation by median earnings in the past 12 months ($)
74,173Office and administrative support occupations
62,036Community and social service occupations
57,859Health diagnosing and treating practitioners and other technical occupations
54,458Healthcare support occupations
50,182Construction and extraction occupations
45,522Health technologists and technicians
Top industries in this zip code by the number of employees in 2005:
Other Services (except Public Administration): Civic and Social Organizations (10-19: 1, 5-9: 1)
Fatal accident statistics in 2014:
Fatal accident count: 2
Vehicles involved in fatal accidents: 5
Fatal accidents caused by drunken drivers: 1
Fatalities: 2
Persons involved in fatal accidents: 9
Pedestrians involved in fatal accidents: 0
Fatal accident statistics in 2013:
Fatal accident count: 1
Vehicles involved in fatal accidents: 1
Fatal accidents caused by drunken drivers: 1
Fatalities: 1
Persons involved in fatal accidents: 2
Pedestrians involved in fatal accidents: 0
2002 - 2018 National Fire Incident Reporting System (NFIRS) incidents
According to the data from the years 2002 - 2018 the average number of fires per year is 22. The highest number of reported fires - 34 took place in 2011, and the least - 3 in 2002. The data has a growing trend.
When looking into fire subcategories, the most reports belonged to: Outside Fires (46.7%), and Structure Fires (38.7%).
Fire incident types reported to NFIRS in Zip Code 43554


 Nearest zip codes: 43531, 43543, 43501, 49232, 43570, 49288.
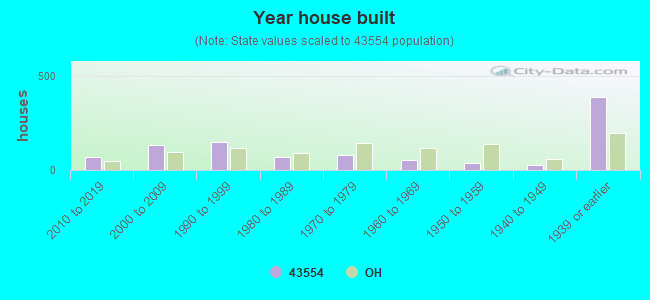


 According to the data from the years 2002 - 2018 the average number of fires per year is 22. The highest number of reported fires - 34 took place in 2011, and the least - 3 in 2002. The data has a growing trend.
 When looking into fire subcategories, the most reports belonged to: Outside Fires (46.7%), and Structure Fires (38.7%).