Estimated zip code population in 2022: 1,414 Zip code population in 2010: 1,620 Zip code population in 2000: 1,798
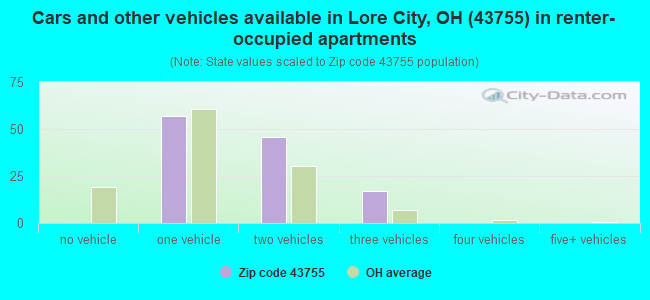
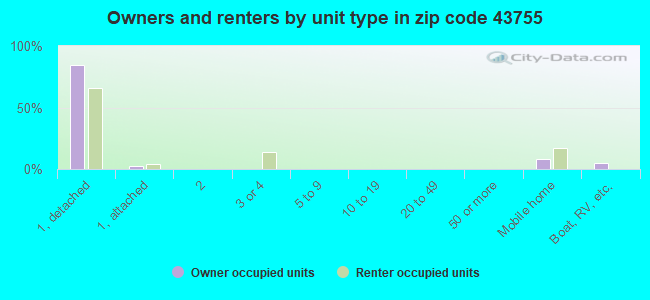
Houses and condos: 767 Renter-occupied apartments: 119
% of renters here:
18%
State:
33%
March 2022 cost of living index in zip code 43755: 83.9 (less than average, U.S. average is 100)
Land area: 35.5 sq. mi. Water area: 0.2 sq. mi.
Population density: 40 people per square mile
(very low).
OSM Map
General Map
Google Map
MSN Map
OSM Map
General Map
Google Map
MSN Map
OSM Map
General Map
Google Map
MSN Map
OSM Map
General Map
Google Map
MSN Map
Please wait while loading the map...
Real estate property taxes paid for housing units in 2022:
This zip code:
0.9% ($1,347)
Ohio:
1.3% ($2,639)
Median real estate property taxes paid for housing units with mortgages in 2022: $1,367 (1.0%) Median real estate property taxes paid for housing units with no mortgage in 2022: $1,308 (0.6%)
Business Search- 14 Million verified businesses
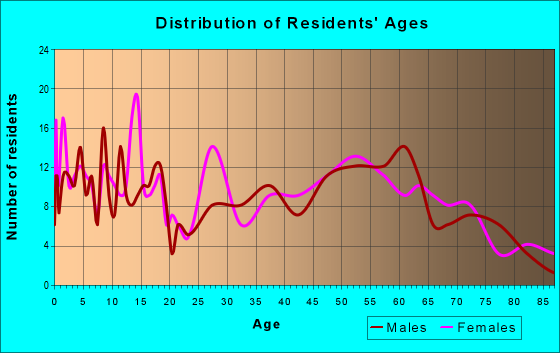
Males: 737
(52.1%)
Females: 677
(47.9%)
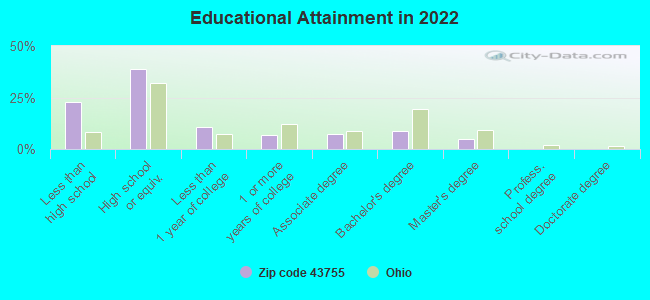
For population 25 years and over in 43755:
High school or higher: 75.5%
Bachelor's degree or higher: 13.5%
Graduate or professional degree: 4.7%
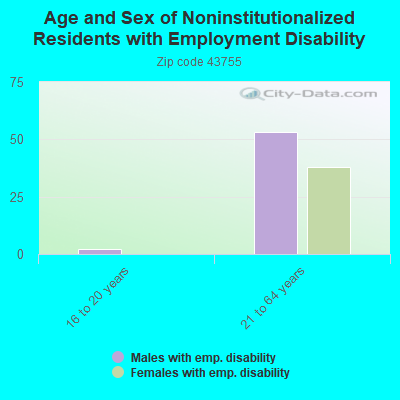
Unemployed: 4.9%
Mean travel time to work (commute): 25.1 minutes
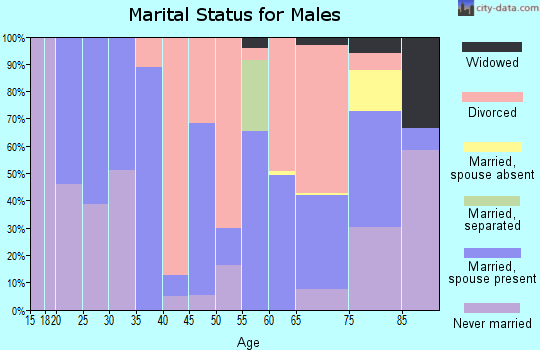
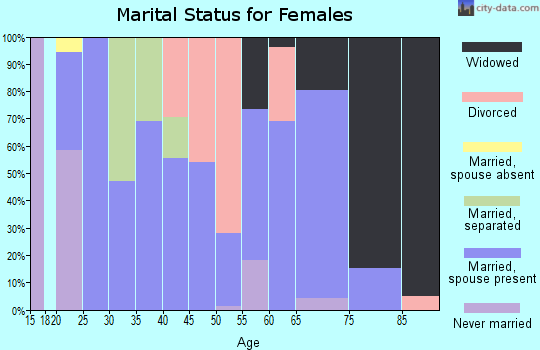
For population 15 years and over in 43755:
Never married: 19.6%
Now married: 56.8%
Separated: 1.3%
Widowed: 5.1%
Divorced: 17.3%
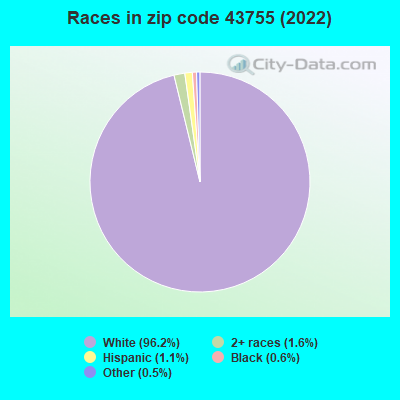
Zip code 43755 compared to state average:
Black race population percentage significantly below state average.
Hispanic race population percentage significantly below state average.
Median age significantly above state average.
Foreign-born population percentage significantly below state average.
Renting percentage below state average.
Length of stay since moving in significantly above state average.
Number of college students significantly below state average.
Percentage of population with a bachelor's degree or higher below state average.
Averages for the 2020 tax year for zip code 43755, filed in 2021:
Average Adjusted Gross Income (AGI) in 2020: $50,301 (Individual Income Tax Returns)
Here:
$50,301
State:
$67,288
Salary/wage: $44,383 (reported on 78.0% of returns)
Here:
$44,383
State:
$55,628
(% of AGI for various income ranges: 1078.5% for AGIs below $25k, 3302.4% for AGIs $25k-50k, 6127.0% for AGIs $50k-75k, 8118.3% for AGIs $75k-100k, 13765.7% for AGIs $100k-200k)
Taxable interest for individuals: $729 (reported on 25.6% of returns)
This zip code:
$729
Ohio:
$1,518
(% of AGI for various income ranges: 10.0% for AGIs below $25k, 31.2% for AGIs $25k-50k, 29.0% for AGIs $50k-75k, 70.0% for AGIs $75k-100k, 12.9% for AGIs $100k-200k)
Ordinary dividends: $2,673 (reported on 13.4% of returns)
Here:
$2,673
State:
$7,167
(% of AGI for various income ranges: 48.2% for AGIs $25k-50k, 152.0% for AGIs $50k-75k, 85.7% for AGIs $100k-200k)
Net capital gain/loss in AGI: +$6,827 (reported on 13.4% of returns)
Here:
+$6,827
State:
+$18,919
(% of AGI for various income ranges: 17.6% for AGIs $25k-50k, 99.0% for AGIs $50k-75k, 888.6% for AGIs $100k-200k)
Profit/loss from business: +$3,909 (reported on 13.4% of returns)
Here:
+$3,909
State:
+$13,744
(% of AGI for various income ranges: 51.5% for AGIs below $25k, 102.9% for AGIs $25k-50k, 68.0% for AGIs $50k-75k, 140.0% for AGIs $75k-100k)
Taxable individual retirement arrangement distribution: $12,086 (reported on 8.5% of returns)
43755:
$12,086
Ohio:
$18,876
(% of AGI for various income ranges: 77.0% for AGIs below $25k, 142.9% for AGIs $25k-50k, 449.0% for AGIs $50k-75k)
Earned income credit: $1,964 (reported on 17.1% of returns)
Here:
$1,964
State:
$2,304
(% of AGI for various income ranges: 84.0% for AGIs below $25k, 62.9% for AGIs $25k-50k)
Percentage of individuals using paid preparers for their 2020 taxes: 95.1%
Here:
95%
State:
94%
(% for various income ranges: 96.3% for AGIs below $25k, 95.5% for AGIs $25k-50k, 92.9% for AGIs $50k-75k, 100.0% for AGIs $75k-100k, 90.0% for AGIs $100k-200k)
Averages for the 2012 tax year for zip code 43755, filed in 2013:
Average Adjusted Gross Income (AGI) in 2012: $57,009 (Individual Income Tax Returns)
Here:
$57,009
State:
$54,926
Salary/wage: $34,832 (reported on 77.5% of returns)
Here:
$34,832
State:
$45,869
(% of AGI for various income ranges: 64.8% for AGIs below $25k, 73.0% for AGIs $25k-50k, 65.5% for AGIs $50k-75k, 72.4% for AGIs $75k-100k, 49.1% for AGIs $100k-200k, 11.9% for AGIs over 200k)
Taxable interest for individuals: $641 (reported on 27.5% of returns)
This zip code:
$641
Ohio:
$1,297
(% of AGI for various income ranges: 2.1% for AGIs below $25k, 0.3% for AGIs $25k-50k, 0.2% for AGIs $50k-75k, 0.1% for AGIs $75k-100k, 0.2% for AGIs $100k-200k)
Ordinary dividends: $2,522 (reported on 11.2% of returns)
Here:
$2,522
State:
$5,821
(% of AGI for various income ranges: 0.2% for AGIs below $25k, 0.2% for AGIs $25k-50k, 1.0% for AGIs $50k-75k, 2.9% for AGIs $75k-100k)
Net capital gain/loss in AGI: +$9,150 (reported on 7.5% of returns)
Here:
+$9,150
State:
+$11,232
(% of AGI for various income ranges: 0.5% for AGIs below $25k, 8.0% for AGIs $50k-75k)
Profit/loss from business: +$6,115 (reported on 16.2% of returns)
Here:
+$6,115
State:
+$12,773
(% of AGI for various income ranges: 5.5% for AGIs below $25k, 3.8% for AGIs $25k-50k, 4.4% for AGIs $50k-75k)
Taxable individual retirement arrangement distribution: $7,357 (reported on 8.8% of returns)
43755:
$7,357
Ohio:
$14,511
(% of AGI for various income ranges: 4.0% for AGIs below $25k, 2.2% for AGIs $25k-50k, 2.7% for AGIs $50k-75k)
Total itemized deductions: $18,186 (13% of AGI, reported on 17.5% of returns)
Here:
$18,186
State:
$21,278
Here:
13.3% of AGI
State:
18.8% of AGI
(% of AGI for various income ranges: 8.2% for AGIs $25k-50k, 5.4% for AGIs $50k-75k, 10.9% for AGIs $75k-100k, 14.0% for AGIs $100k-200k)
Charity contributions: $2,900 (reported on 10.0% of returns)
Here:
$2,900
State:
$3,943
(% of AGI for various income ranges: 0.7% for AGIs $25k-50k, 1.4% for AGIs $75k-100k, 1.5% for AGIs $100k-200k)
Taxes paid: $5,914 (reported on 17.5% of returns)
43755:
$5,914
State:
$9,568
(% of AGI for various income ranges: 1.8% for AGIs $25k-50k, 1.9% for AGIs $50k-75k, 3.0% for AGIs $75k-100k, 5.7% for AGIs $100k-200k)
Earned income credit: $2,121 (reported on 17.5% of returns)
Here:
$2,121
State:
$2,285
(% of AGI for various income ranges: 5.6% for AGIs below $25k, 0.9% for AGIs $25k-50k)
Percentage of individuals using paid preparers for their 2012 taxes: 52.5%
Here:
52%
State:
51%
(% for various income ranges: 40.6% for AGIs below $25k, 54.5% for AGIs $25k-50k, 54.5% for AGIs $50k-75k, 66.7% for AGIs $75k-100k, 66.7% for AGIs $100k-200k, 100.0% for AGIs over 200k)
Averages for the 2004 tax year for zip code 43755, filed in 2005:
Average Adjusted Gross Income (AGI) in 2004: $29,703 (Individual Income Tax Returns)
Here:
$29,703
State:
$44,480
Salary/wage: $28,544 (reported on 82.6% of returns)
Here:
$28,544
State:
$39,198
(% of AGI for various income ranges: 79.8% for AGIs below $10k, 71.1% for AGIs $10k-25k, 83.7% for AGIs $25k-50k, 82.2% for AGIs $50k-75k, 89.6% for AGIs $75k-100k, 62.1% for AGIs over 100k)
Taxable interest for individuals: $678 (reported on 36.7% of returns)
This zip code:
$678
Ohio:
$1,532
(% of AGI for various income ranges: 2.3% for AGIs below $10k, 2.3% for AGIs $10k-25k, 0.7% for AGIs $25k-50k, 0.3% for AGIs $50k-75k, 0.0% for AGIs $75k-100k, 0.0% for AGIs over 100k)
Taxable dividends: $417 (reported on 14.4% of returns)
Here:
$417
State:
$3,496
(% of AGI for various income ranges: 0.6% for AGIs below $10k, 0.4% for AGIs $10k-25k, 0.2% for AGIs $25k-50k, 0.1% for AGIs $50k-75k, 0.3% for AGIs $75k-100k)
Net capital gain/loss: +$328 (reported on 8.5% of returns)
Here:
+$328
State:
+$8,582
Profit/loss from business: +$3,520 (reported on 13.3% of returns)
Here:
+$3,520
State:
+$10,813
(% of AGI for various income ranges: 14.6% for AGIs below $10k, 4.1% for AGIs $10k-25k, 0.6% for AGIs $25k-50k, 0.5% for AGIs $50k-75k)
Total itemized deductions: $13,583 (22% of AGI, reported on 15.3% of returns)
Here:
$13,583
State:
$17,503
Here:
22.1% of AGI
State:
20.8% of AGI
(% of AGI for various income ranges: 3.8% for AGIs $10k-25k, 5.9% for AGIs $25k-50k, 8.7% for AGIs $50k-75k, 12.0% for AGIs $75k-100k, 10.0% for AGIs over 100k)
Charity contributions deductions: $2,329 (3% of AGI, reported on 10.5% of returns)
Here:
$2,329
State:
$3,087
Here:
3.3% of AGI
State:
3.4% of AGI
(% of AGI for various income ranges: 0.6% for AGIs $25k-50k, 1.3% for AGIs $50k-75k, 0.5% for AGIs $75k-100k, 2.6% for AGIs over 100k)
Total tax: $3,226 (reported on 74.2% of returns)
43755:
$3,226
State:
$6,781
(% of AGI for various income ranges: 3.9% for AGIs below $10k, 4.0% for AGIs $10k-25k, 7.0% for AGIs $25k-50k, 8.5% for AGIs $50k-75k, 10.6% for AGIs $75k-100k, 17.1% for AGIs over 100k)
Earned income credit: $1,677 (reported on 16.9% of returns)
Here:
$1,677
State:
$1,696
Percentage of individuals using paid preparers for their 2004 taxes: 59.2%
Here:
59%
State:
55%
(% for various income ranges: 59.7% for AGIs below $10k, 58.5% for AGIs $10k-25k, 59.4% for AGIs $25k-50k, 55.0% for AGIs $50k-75k, 64.3% for AGIs $75k-100k, 73.3% for AGIs over 100k)
Household received Food Stamps/SNAP in the past 12 months: 63 Household did not receive Food Stamps/SNAP in the past 12 months: 606
Women who had a birth in the past 12 months: 1 (2 now married, 0 unmarried) Women who did not have a birth in the past 12 months: 185 (105 now married, 79 unmarried)
Housing units in zip code 43755 with a mortgage: 320 (16 second mortgage, 14 both second mortgage and home equity loan) Houses without a mortgage: 3
Median monthly owner costs for units with a mortgage: $1,048 Median monthly owner costs for units without a mortgage: $418
Residents with income below the poverty level in 2022:
This zip code:
11.3%
Whole state:
13.4%
Residents with income below 50% of the poverty level in 2022:
This zip code:
2.3%
Whole state:
7.0%
Median number of rooms in houses and condos:
Here:
6.0
State:
6.7
Median number of rooms in apartments:
Here:
5.9
State:
4.4
Notable locations in this zip code not listed on our city pages
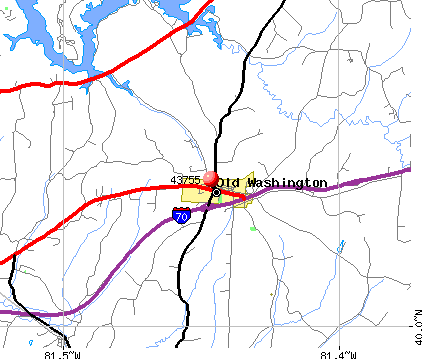
Notable locations in zip code 43755: Butternut Dairy (A), Chumney Farms (B), Hendershot Farm (C), Lore City Fire Department (D). Display/hide their locations on the map
In group quarters: 39 (-1 institutionalized population)
Size of family households: 244 2-persons, 43 3-persons, 80 4-persons, 20 5-persons, 6 6-persons
Size of nonfamily households: 236 1-person, 28 2-persons, 12 3-persons
196 married couples with children.
58 single-parent households (58 men).
97.8% of residents of 43755 zip code speak English at home.
1.1% of residents speak Spanish at home (64% very well, 36% not well).
1.6% of residents speak other Indo-European language at home (100% very well).
Foreign born population: 19 (1.4%) (100.0% of them are naturalized citizens)
This zip code:
1.4%
Whole state:
5.0%
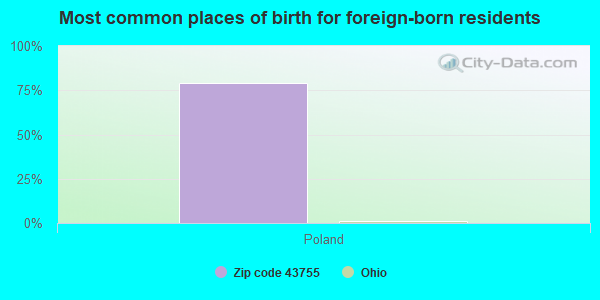
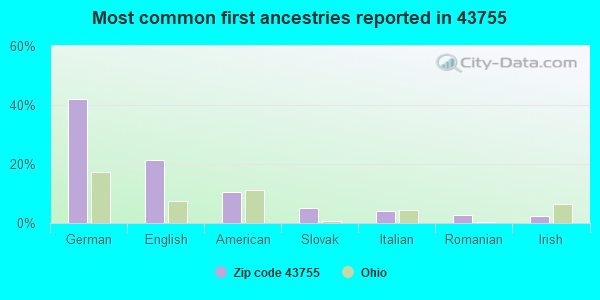
79%Poland
42%German
21%English
10%American
5%Slovak
4%Italian
3%Romanian
2%Irish
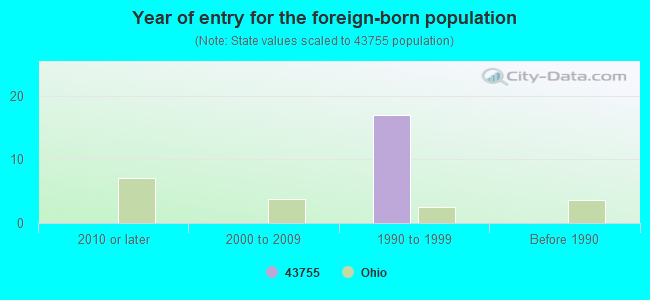
Year of entry for the foreign-born population
02010 or later
02000 to 2009
171990 to 1999
0Before 1990
Facilities with environmental interests located in this zip code:
BUCKEYE TRAIL HIGH SCHOOL (65555 WINTERGREEN RD in LORE CITY, OH)
(Geographic Names Information System) (National Center for Education Statistics) - STATE ID-042564 Organizations: EAST GUERNSEY LOCAL SD (SCHOOL DISTRICT)
Housing units lacking complete plumbing facilities: 0.6% Housing units lacking complete kitchen facilities: 1.9%
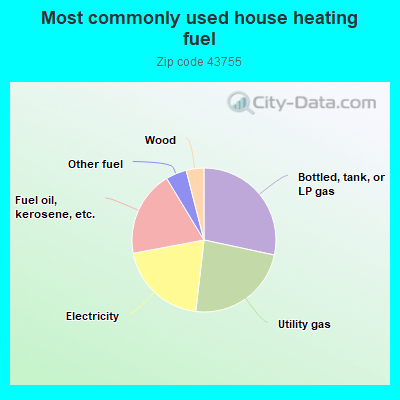
28.5%Bottled, tank, or LP gas
23.6%Utility gas
20.3%Electricity
19.4%Fuel oil, kerosene, etc.
4.7%Other fuel
4.0%Wood
Population in 1990: 1,487. Population change in the 1990s: +311 (+20.9%).
Place of birth for U.S.-born residents:
This state: 1,255
Northeast: 18
Midwest: 13
South: 103
West: 2
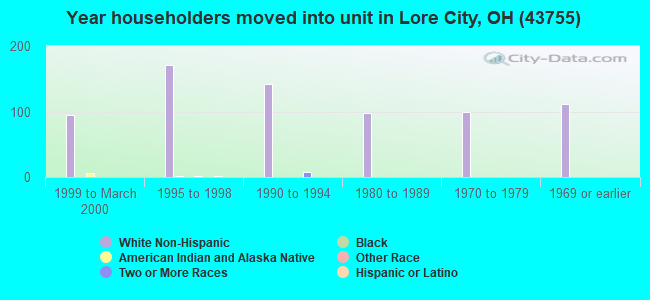
67% of the 43755 zip code residents lived in the same house 5 years ago. Out of people who lived in different houses, 60% lived in this county. Out of people who lived in different counties, 50% lived in Ohio.
94% of the 43755 zip code residents lived in the same house 1 year ago. Out of people who lived in different houses, 69% moved from this county. Out of people who lived in different houses, 30% moved from different county within same state. Out of people who lived in different houses, 3% moved from different state.
Private vs. public school enrollment:
Students in private schools in grades 1 to 8 (elementary and middle school):
Here:
0.0%
Ohio:
16.0%
Students in private schools in grades 9 to 12 (high school):
Here:
0.0%
Ohio:
13.1%
Students in private undergraduate colleges:
Here:
0.0%
Ohio:
22.3%
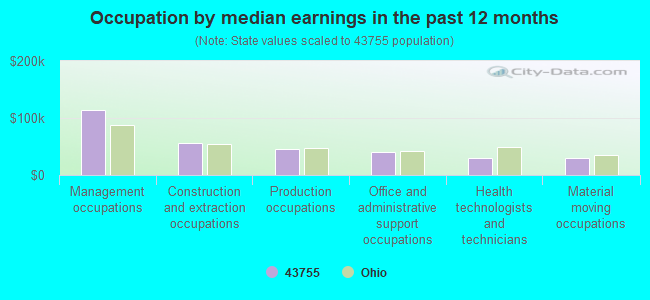
Occupation by median earnings in the past 12 months ($)
113,616Management occupations
55,494Construction and extraction occupations
45,970Production occupations
40,203Office and administrative support occupations
29,847Health technologists and technicians
29,059Material moving occupations
Top industries in this zip code by the number of employees in 2005:
Health Care and Social Assistance: Child Day Care Services (5-9 employees: 1 establishment, 1-4 employees: 1 establishment)
Other Services (except Public Administration): Beauty Salons (5-9: 1)
Construction: Oil and Gas Pipeline and Related Structures Construction (5-9: 1)
Accommodation and Food Services: Drinking Places (Alcoholic Beverages) (5-9: 1)
Construction: Commercial and Institutional Building Construction (5-9: 1)
Mining: Crude Petroleum and Natural Gas Extraction (1-4: 1)
Other Services (except Public Administration): Car Washes (1-4: 1)
People in group quarters in 2010:
31 people in nursing facilities/skilled-nursing facilities
Fatal accident statistics in 2014:
Fatal accident count: 1
Vehicles involved in fatal accidents: 2
Fatal accidents caused by drunken drivers: 0
Fatalities: 1
Persons involved in fatal accidents: 2
Pedestrians involved in fatal accidents: 0
Fatal accident statistics in 2013:
Fatal accident count: 1
Vehicles involved in fatal accidents: 1
Fatal accidents caused by drunken drivers: 1
Fatalities: 2
Persons involved in fatal accidents: 3
Pedestrians involved in fatal accidents: 0
2002 - 2018 National Fire Incident Reporting System (NFIRS) incidents
Based on the data from the years 2002 - 2018 the average number of fire incidents per year is 13. The highest number of reported fire incidents - 35 took place in 2008, and the least - 2 in 2013. The data has a rising trend.
When looking into fire subcategories, the most reports belonged to: Structure Fires (56.1%), and Outside Fires (24.4%).
Fire incident types reported to NFIRS in Zip Code 43755


 Nearest zip codes: 43768, 43778, 43750, 43723, 43780, 43773.


 Based on the data from the years 2002 - 2018 the average number of fire incidents per year is 13. The highest number of reported fire incidents - 35 took place in 2008, and the least - 2 in 2013. The data has a rising trend.
 When looking into fire subcategories, the most reports belonged to: Structure Fires (56.1%), and Outside Fires (24.4%).