Estimated zip code population in 2022: 12,027 Zip code population in 2010: 11,553 Zip code population in 2000: 10,958
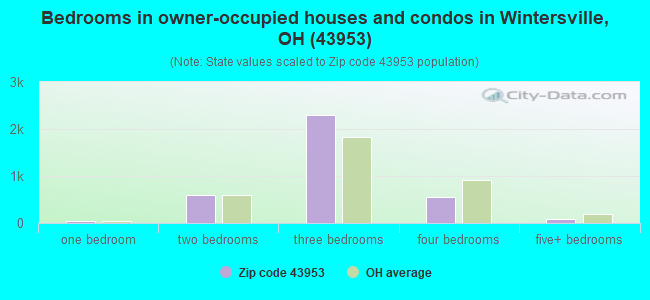
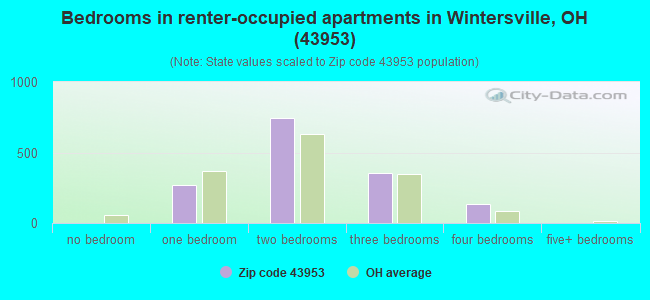
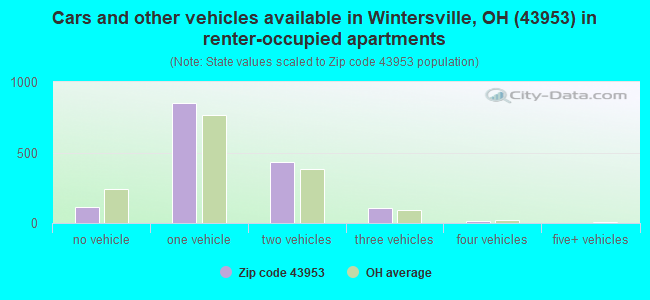
Houses and condos: 5,338 Renter-occupied apartments: 1,503
% of renters here:
29%
State:
33%
March 2022 cost of living index in zip code 43953: 88.3 (less than average, U.S. average is 100)
Land area: 18.1 sq. mi. Water area: 0.0 sq. mi.
Population density: 664 people per square mile
(low).
OSM Map
General Map
Google Map
MSN Map
OSM Map
General Map
Google Map
MSN Map
OSM Map
General Map
Google Map
MSN Map
OSM Map
General Map
Google Map
MSN Map
Please wait while loading the map...
Real estate property taxes paid for housing units in 2022:
This zip code:
1.0% ($1,486)
Ohio:
1.3% ($2,639)
Median real estate property taxes paid for housing units with mortgages in 2022: $1,474 (1.0%) Median real estate property taxes paid for housing units with no mortgage in 2022: $1,514 (1.2%)
Business Search- 14 Million verified businesses
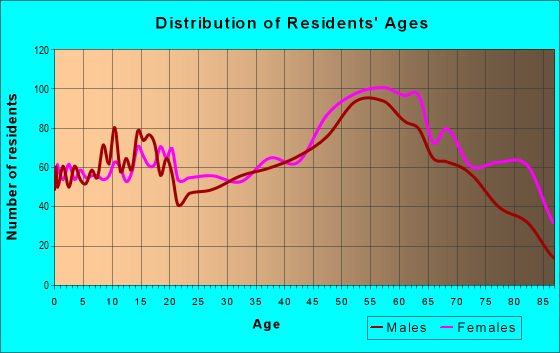
Males: 5,888
(49.0%)
Females: 6,139
(51.0%)
For population 25 years and over in 43953:
High school or higher: 94.3%
Bachelor's degree or higher: 31.2%
Graduate or professional degree: 12.9%
Unemployed: 2.4%
Mean travel time to work (commute): 23.6 minutes
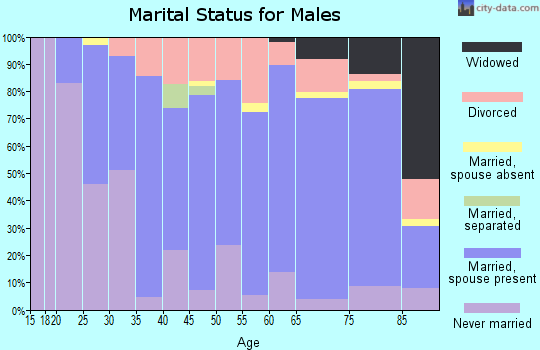
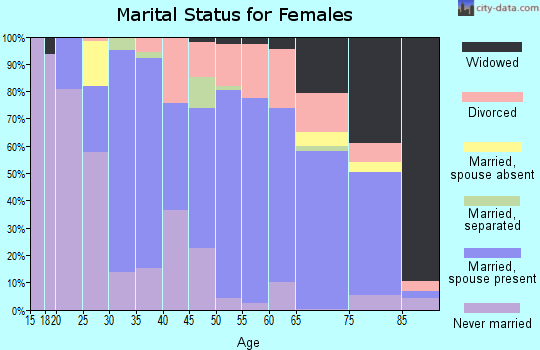
For population 15 years and over in 43953:
Never married: 26.6%
Now married: 48.2%
Separated: 1.5%
Widowed: 9.6%
Divorced: 14.2%
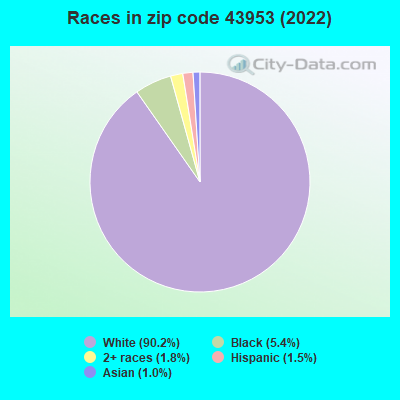
Zip code 43953 compared to state average:
Black race population percentage below state average.
Hispanic race population percentage below state average.
Median age above state average.
Foreign-born population percentage significantly below state average.
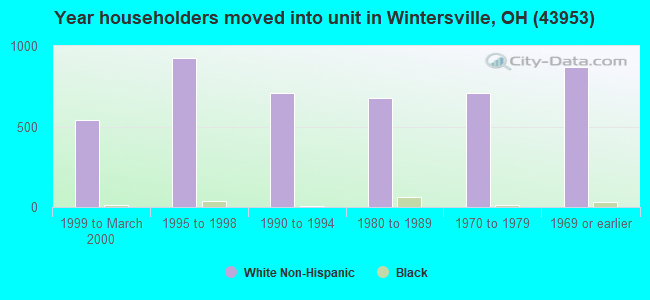
Length of stay since moving in significantly above state average.
Estimated median house/condo value in 2022: $143,193
43953:
$143,193
Ohio:
$204,100
According to our research of Ohio and other state lists, there were 12 registered sex offenders living in 43953 zip code as of April 23, 2024. The ratio of all residents to sex offenders in zip code 43953 is 967 to 1. The ratio of registered sex offenders to all residents in this zip code is lower than the state average.
Median resident age:
This zip code:
47.6 years
Ohio median age:
39.9 years
Average household size:
This zip code:
2.3 people
Ohio:
2.4 people
Averages for the 2020 tax year for zip code 43953, filed in 2021:
Average Adjusted Gross Income (AGI) in 2020: $59,353 (Individual Income Tax Returns)
Here:
$59,353
State:
$67,288
Salary/wage: $50,388 (reported on 77.0% of returns)
Here:
$50,388
State:
$55,628
(% of AGI for various income ranges: 1036.7% for AGIs below $25k, 3131.5% for AGIs $25k-50k, 5724.3% for AGIs $50k-75k, 8819.3% for AGIs $75k-100k, 16072.3% for AGIs $100k-200k, 66986.0% for AGIs over 200k)
Taxable interest for individuals: $1,444 (reported on 26.9% of returns)
This zip code:
$1,444
Ohio:
$1,518
(% of AGI for various income ranges: 13.3% for AGIs below $25k, 23.0% for AGIs $25k-50k, 45.2% for AGIs $50k-75k, 86.0% for AGIs $75k-100k, 90.8% for AGIs $100k-200k, 1522.0% for AGIs over 200k)
Ordinary dividends: $5,907 (reported on 18.2% of returns)
Here:
$5,907
State:
$7,167
(% of AGI for various income ranges: 24.4% for AGIs below $25k, 39.3% for AGIs $25k-50k, 87.7% for AGIs $50k-75k, 115.2% for AGIs $75k-100k, 269.5% for AGIs $100k-200k, 6476.0% for AGIs over 200k)
Net capital gain/loss in AGI: +$10,025 (reported on 14.7% of returns)
Here:
+$10,025
State:
+$18,919
(% of AGI for various income ranges: 9.9% for AGIs below $25k, 20.7% for AGIs $25k-50k, 86.6% for AGIs $50k-75k, 120.2% for AGIs $75k-100k, 644.6% for AGIs $100k-200k, 8914.0% for AGIs over 200k)
Profit/loss from business: +$10,878 (reported on 10.5% of returns)
Here:
+$10,878
State:
+$13,744
(% of AGI for various income ranges: 54.7% for AGIs below $25k, 74.0% for AGIs $25k-50k, 156.9% for AGIs $50k-75k, 243.8% for AGIs $75k-100k, 554.6% for AGIs $100k-200k, 1402.0% for AGIs over 200k)
Taxable individual retirement arrangement distribution: $15,307 (reported on 12.4% of returns)
43953:
$15,307
Ohio:
$18,876
(% of AGI for various income ranges: 69.7% for AGIs below $25k, 140.5% for AGIs $25k-50k, 240.8% for AGIs $50k-75k, 319.5% for AGIs $75k-100k, 868.2% for AGIs $100k-200k, 3896.0% for AGIs over 200k)
Total itemized deductions: $36,670 (reported on 3.5% of returns)
Here:
$36,670
State:
$33,869
(% of AGI for various income ranges: 96.8% for AGIs $25k-50k, 96.3% for AGIs $50k-75k, 275.5% for AGIs $75k-100k, 473.8% for AGIs $100k-200k, 5044.0% for AGIs over 200k)
Charity contributions: $13,438 (reported on 2.8% of returns)
Here:
$13,438
State:
$14,577
(% of AGI for various income ranges: 15.0% for AGIs $25k-50k, 47.4% for AGIs $75k-100k, 161.5% for AGIs $100k-200k, 2276.0% for AGIs over 200k)
Taxes paid: $6,435 (reported on 3.5% of returns)
43953:
$6,435
State:
$7,681
(% of AGI for various income ranges: 7.5% for AGIs $25k-50k, 15.7% for AGIs $50k-75k, 47.9% for AGIs $75k-100k, 106.9% for AGIs $100k-200k, 950.0% for AGIs over 200k)
Earned income credit: $2,113 (reported on 13.3% of returns)
Here:
$2,113
State:
$2,304
(% of AGI for various income ranges: 76.1% for AGIs below $25k, 49.9% for AGIs $25k-50k)
Percentage of individuals using paid preparers for their 2020 taxes: 93.2%
Here:
93%
State:
94%
(% for various income ranges: 91.2% for AGIs below $25k, 94.2% for AGIs $25k-50k, 93.5% for AGIs $50k-75k, 93.4% for AGIs $75k-100k, 95.5% for AGIs $100k-200k, 93.3% for AGIs over 200k)
Averages for the 2012 tax year for zip code 43953, filed in 2013:
Average Adjusted Gross Income (AGI) in 2012: $51,475 (Individual Income Tax Returns)
Here:
$51,475
State:
$54,926
Salary/wage: $42,364 (reported on 80.4% of returns)
Here:
$42,364
State:
$45,869
(% of AGI for various income ranges: 66.6% for AGIs below $25k, 71.3% for AGIs $25k-50k, 71.8% for AGIs $50k-75k, 71.7% for AGIs $75k-100k, 70.7% for AGIs $100k-200k, 45.6% for AGIs over 200k)
Taxable interest for individuals: $1,218 (reported on 35.4% of returns)
This zip code:
$1,218
Ohio:
$1,297
(% of AGI for various income ranges: 1.3% for AGIs below $25k, 0.7% for AGIs $25k-50k, 0.7% for AGIs $50k-75k, 0.8% for AGIs $75k-100k, 0.7% for AGIs $100k-200k, 1.1% for AGIs over 200k)
Ordinary dividends: $2,884 (reported on 21.2% of returns)
Here:
$2,884
State:
$5,821
(% of AGI for various income ranges: 1.8% for AGIs below $25k, 0.8% for AGIs $25k-50k, 1.0% for AGIs $50k-75k, 0.8% for AGIs $75k-100k, 0.9% for AGIs $100k-200k, 2.1% for AGIs over 200k)
Net capital gain/loss in AGI: +$5,461 (reported on 13.1% of returns)
Here:
+$5,461
State:
+$11,232
(% of AGI for various income ranges: 0.5% for AGIs $50k-75k, 0.5% for AGIs $75k-100k, 1.5% for AGIs $100k-200k, 5.0% for AGIs over 200k)
Profit/loss from business: +$14,874 (reported on 11.5% of returns)
Here:
+$14,874
State:
+$12,773
(% of AGI for various income ranges: 3.3% for AGIs below $25k, 1.8% for AGIs $25k-50k, 1.6% for AGIs $50k-75k, 2.9% for AGIs $75k-100k, 5.1% for AGIs $100k-200k, 5.0% for AGIs over 200k)
Taxable individual retirement arrangement distribution: $10,740 (reported on 12.7% of returns)
43953:
$10,740
Ohio:
$14,511
(% of AGI for various income ranges: 4.2% for AGIs below $25k, 2.7% for AGIs $25k-50k, 2.2% for AGIs $50k-75k, 3.4% for AGIs $75k-100k, 2.4% for AGIs $100k-200k, 1.9% for AGIs over 200k)
Self-employment retirement plans: $17,150 (reported on 0.4% of returns)
43953:
$17,150
Ohio:
$20,257
(% of AGI for various income ranges: 0.7% for AGIs $75k-100k)
Total itemized deductions: $19,131 (17% of AGI, reported on 20.4% of returns)
Here:
$19,131
State:
$21,278
Here:
16.5% of AGI
State:
18.8% of AGI
(% of AGI for various income ranges: 5.4% for AGIs below $25k, 5.1% for AGIs $25k-50k, 6.0% for AGIs $50k-75k, 7.5% for AGIs $75k-100k, 10.9% for AGIs $100k-200k, 9.3% for AGIs over 200k)
Charity contributions: $3,348 (reported on 16.3% of returns)
Here:
$3,348
State:
$3,943
(% of AGI for various income ranges: 0.4% for AGIs below $25k, 0.6% for AGIs $25k-50k, 0.9% for AGIs $50k-75k, 1.0% for AGIs $75k-100k, 1.8% for AGIs $100k-200k, 1.1% for AGIs over 200k)
Taxes paid: $7,763 (reported on 20.4% of returns)
43953:
$7,763
State:
$9,568
(% of AGI for various income ranges: 0.7% for AGIs below $25k, 1.2% for AGIs $25k-50k, 1.9% for AGIs $50k-75k, 2.5% for AGIs $75k-100k, 4.5% for AGIs $100k-200k, 6.3% for AGIs over 200k)
Earned income credit: $2,014 (reported on 14.3% of returns)
Here:
$2,014
State:
$2,285
(% of AGI for various income ranges: 4.6% for AGIs below $25k, 0.7% for AGIs $25k-50k)
Percentage of individuals using paid preparers for their 2012 taxes: 56.5%
Here:
56%
State:
51%
(% for various income ranges: 50.7% for AGIs below $25k, 56.3% for AGIs $25k-50k, 58.1% for AGIs $50k-75k, 64.8% for AGIs $75k-100k, 65.9% for AGIs $100k-200k, 83.3% for AGIs over 200k)
Averages for the 2004 tax year for zip code 43953, filed in 2005:
Average Adjusted Gross Income (AGI) in 2004: $40,822 (Individual Income Tax Returns)
Here:
$40,822
State:
$44,480
Salary/wage: $35,831 (reported on 80.4% of returns)
Here:
$35,831
State:
$39,198
(% of AGI for various income ranges: 88.0% for AGIs below $10k, 64.3% for AGIs $10k-25k, 72.3% for AGIs $25k-50k, 80.3% for AGIs $50k-75k, 80.0% for AGIs $75k-100k, 57.5% for AGIs over 100k)
Taxable interest for individuals: $1,684 (reported on 52.1% of returns)
This zip code:
$1,684
Ohio:
$1,532
(% of AGI for various income ranges: 7.2% for AGIs below $10k, 4.1% for AGIs $10k-25k, 2.3% for AGIs $25k-50k, 1.3% for AGIs $50k-75k, 1.2% for AGIs $75k-100k, 2.1% for AGIs over 100k)
Taxable dividends: $2,212 (reported on 26.1% of returns)
Here:
$2,212
State:
$3,496
(% of AGI for various income ranges: 4.4% for AGIs below $10k, 1.5% for AGIs $10k-25k, 1.0% for AGIs $25k-50k, 1.0% for AGIs $50k-75k, 1.3% for AGIs $75k-100k, 1.9% for AGIs over 100k)
Net capital gain/loss: +$5,701 (reported on 20.2% of returns)
Here:
+$5,701
State:
+$8,582
(% of AGI for various income ranges: -2.8% for AGIs below $10k, -0.6% for AGIs $10k-25k, 0.2% for AGIs $25k-50k, 0.5% for AGIs $50k-75k, 0.7% for AGIs $75k-100k, 9.8% for AGIs over 100k)
Profit/loss from business: +$18,066 (reported on 11.1% of returns)
Here:
+$18,066
State:
+$10,813
(% of AGI for various income ranges: 4.0% for AGIs below $10k, 2.8% for AGIs $10k-25k, 2.0% for AGIs $25k-50k, 2.0% for AGIs $50k-75k, 3.6% for AGIs $75k-100k, 11.3% for AGIs over 100k)
IRA payment deduction: $2,791 (reported on 2.4% of returns)
43953:
$2,791
Ohio:
$2,794
(% of AGI for various income ranges: 0.2% for AGIs $10k-25k, 0.2% for AGIs $25k-50k, 0.2% for AGIs $50k-75k, 0.2% for AGIs $75k-100k, 0.1% for AGIs over 100k)
Self-employed pension: $17,806 (reported on 0.6% of returns)
Here:
$17,806
Ohio:
$13,981
Total itemized deductions: $15,281 (18% of AGI, reported on 22.1% of returns)
Here:
$15,281
State:
$17,503
Here:
17.5% of AGI
State:
20.8% of AGI
(% of AGI for various income ranges: 5.0% for AGIs below $10k, 4.2% for AGIs $10k-25k, 6.5% for AGIs $25k-50k, 7.4% for AGIs $50k-75k, 10.1% for AGIs $75k-100k, 11.4% for AGIs over 100k)
Charity contributions deductions: $2,317 (3% of AGI, reported on 19.5% of returns)
Here:
$2,317
State:
$3,087
Here:
2.6% of AGI
State:
3.4% of AGI
(% of AGI for various income ranges: 0.4% for AGIs below $10k, 0.4% for AGIs $10k-25k, 0.9% for AGIs $25k-50k, 1.0% for AGIs $50k-75k, 1.5% for AGIs $75k-100k, 1.5% for AGIs over 100k)
Total tax: $6,134 (reported on 76.1% of returns)
43953:
$6,134
State:
$6,781
(% of AGI for various income ranges: 2.0% for AGIs below $10k, 3.9% for AGIs $10k-25k, 7.8% for AGIs $25k-50k, 9.7% for AGIs $50k-75k, 11.0% for AGIs $75k-100k, 19.9% for AGIs over 100k)
Earned income credit: $1,489 (reported on 11.9% of returns)
Here:
$1,489
State:
$1,696
Percentage of individuals using paid preparers for their 2004 taxes: 58.1%
Here:
58%
State:
55%
(% for various income ranges: 50.7% for AGIs below $10k, 56.9% for AGIs $10k-25k, 59.7% for AGIs $25k-50k, 58.3% for AGIs $50k-75k, 61.6% for AGIs $75k-100k, 78.0% for AGIs over 100k)
Likely homosexual households (counted as self-reported same-sex unmarried-partner households)
Lesbian couples: 0.0% of all households
Gay men: 0.2% of all households
Household received Food Stamps/SNAP in the past 12 months: 501 Household did not receive Food Stamps/SNAP in the past 12 months: 4,593
Women who had a birth in the past 12 months: 10 (11 now married, 0 unmarried) Women who did not have a birth in the past 12 months: 2,035 (831 now married, 1,203 unmarried)
Housing units in zip code 43953 with a mortgage: 2,071 (158 second mortgage, 143 both second mortgage and home equity loan) Houses without a mortgage: 327
Median monthly owner costs for units with a mortgage: $1,119 Median monthly owner costs for units without a mortgage: $481
Residents with income below the poverty level in 2022:
This zip code:
12.4%
Whole state:
13.4%
Residents with income below 50% of the poverty level in 2022:
This zip code:
7.4%
Whole state:
7.0%
Median number of rooms in houses and condos:
Here:
6.3
State:
6.7
Median number of rooms in apartments:
Here:
4.5
State:
4.4
Notable locations in this zip code not listed on our city pages
Notable locations in zip code 43953: Steubenville Country Club (A), Winter Drive-In Theatre (B), Wintersville Wastewater Treatment Plant (C), Wintersville Fire Department (D), Wintersville Municipal Building (E), Cross Creek Memorial Building (F), Buchanan Building (G). Display/hide their locations on the map
Churches in zip code 43953 include: Starkdale Presbyterian Church (A), Wintersville Baptist Temple (B), Wintersville United Methodist Church (C), Saint James Church (D), Two Ridges Church (E). Display/hide their locations on the map
Cemeteries: Fort Steuben Burial Estates (1), Saint James Cemetery (2), Cross Creek Presbyterian Cemetery (3), Wintersville Methodist Cemetery (4). Display/hide their locations on the map
In group quarters: 344 (-1 institutionalized population)
Size of family households: 1,667 2-persons, 887 3-persons, 447 4-persons, 111 5-persons, 143 6-persons, 28 7-or-more-persons
Size of nonfamily households: 1,729 1-person, 75 2-persons, 3 3-persons
1,457 married couples with children.
962 single-parent households (326 men, 636 women).
97.5% of residents of 43953 zip code speak English at home.
0.6% of residents speak Spanish at home (88% very well, 12% well).
1.8% of residents speak other Indo-European language at home (94% very well, 6% well).
0.5% of residents speak Asian or Pacific Island language at home (31% very well, 69% well).
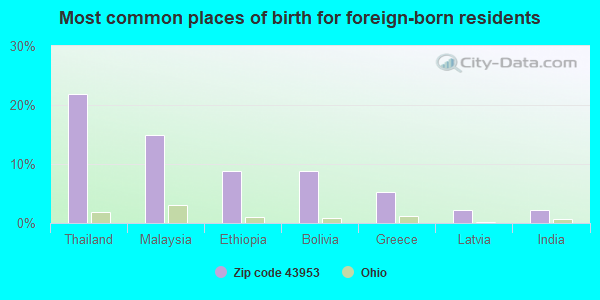
Foreign born population: 229 (1.9%) (69.6% of them are naturalized citizens)
This zip code:
1.9%
Whole state:
5.0%
22%Thailand
15%Malaysia
9%Ethiopia
9%Bolivia
5%Greece
2%Latvia
2%India
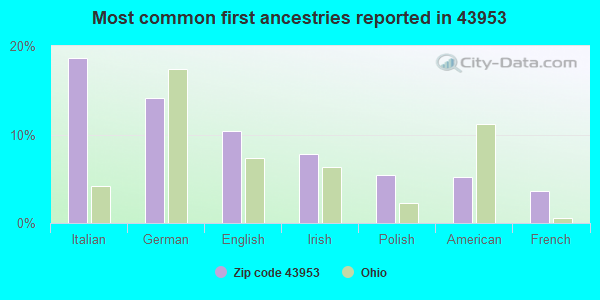
19%Italian
14%German
10%English
8%Irish
5%Polish
5%American
4%French
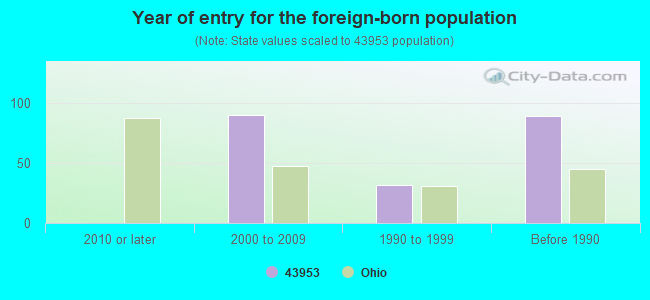
Year of entry for the foreign-born population
02010 or later
902000 to 2009
321990 to 1999
89Before 1990
Facilities with environmental interests located in this zip code:
BANTAM RIDGE ELEMENTARY SCHOOL (587 BANTAM RIDGE RD in WINTERSVILLE, OH)
(Geographic Names Information System) (National Center for Education Statistics) - STATE ID-140327 Organizations: INDIAN CREEK (SCHOOL DISTRICT)
AIRPARK SOCCER FIELDS (AIRPARK DR in WINTERSVILLE, OH)
(Resource Conservation and Recovery Act (tracking hazardous waste)) Organizations: JEFFERSON COUNTY AIRPARK (CONTACT/OWNER)
Housing units lacking complete plumbing facilities: 0.9% Housing units lacking complete kitchen facilities: 2.2%
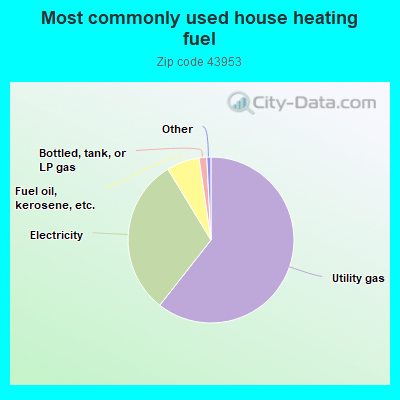
60.6%Utility gas
30.7%Electricity
6.4%Fuel oil, kerosene, etc.
1.5%Bottled, tank, or LP gas
Place of birth for U.S.-born residents:
This state: 8,126
Northeast: 844
Midwest: 381
South: 2,166
West: 241
73% of the 43953 zip code residents lived in the same house 5 years ago. Out of people who lived in different houses, 70% lived in this county. Out of people who lived in different counties, 50% lived in Ohio.
95% of the 43953 zip code residents lived in the same house 1 year ago. Out of people who lived in different houses, 38% moved from this county. Out of people who lived in different houses, 18% moved from different county within same state. Out of people who lived in different houses, 55% moved from different state.
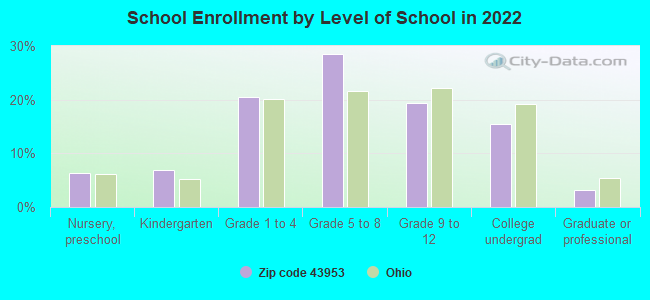
Private vs. public school enrollment:
Students in private schools in grades 1 to 8 (elementary and middle school): 448
Here:
30.1%
Ohio:
16.0%
Students in private schools in grades 9 to 12 (high school): 169
Here:
28.9%
Ohio:
13.1%
Students in private undergraduate colleges: 158
Here:
34.0%
Ohio:
22.3%
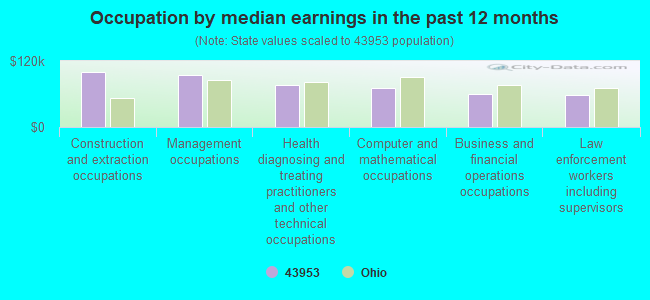
Occupation by median earnings in the past 12 months ($)
99,582Construction and extraction occupations
93,719Management occupations
75,870Health diagnosing and treating practitioners and other technical occupations
71,012Computer and mathematical occupations
60,015Business and financial operations occupations
57,945Law enforcement workers including supervisors
Companies with federal contracts located in this zip code:
PROACTIVE TECHNOLOGIES LLC (201 LURAY DRIVE in STEUBENVILLE, OH; small business) : $14,428,978 in 28 contractsfrom 2001 to 2006
Contracts for Maintenance, Repair and Rebuilding of Equipment -- Training Aids and Devices, ADP Central Processing Unit (CPU, Computer), Analog, Miscellaneous Aircraft Accessories and Components by Air Force, Navy Signed by year:2000: $0; 2001: $763,795; 2002: $1,293,412; 2003: $853,078; 2004: $1,612,280; 2005: $9,781,173; 2006: $125,240.
Biggest contracts:
$3,794,165 with Air Force for Maintenance, Repair and Rebuilding of Equipment -- Training Aids and Devices. Signed on 2005-03-31. Completion date: 2007-04-30.
$1,648,167, same as above.Signed on 2005-05-05. Completion date: 2006-10-30.
$1,051,475, same as above.Signed on 2005-09-22. Completion date: 2006-09-29.
$1,033,144, same as above.Signed on 2005-09-27. Completion date: 2006-09-29.
GIL THERMES FENCE COMPANY INC (224 CANTON ROAD in STEUBENVILLE, OH; small business)
$21,510 with Navy for Machine Tool Accessories. Signed on 2003-10-01. Completion date: 2004-09-30.
Top industries in this zip code by the number of employees in 2005:
Health Care and Social Assistance: Nursing Care Facilities (100-249 employees: 1 establishment, 50-99 employees: 1 establishment, 1-4 employees: 1 establishment)
Health Care and Social Assistance: Home Health Care Services (100-249: 1, 10-19: 2, 1-4: 1)
2002 - 2018 National Fire Incident Reporting System (NFIRS) incidents
Based on the data from the years 2002 - 2018 the average number of fire incidents per year is 27. The highest number of reported fires - 42 took place in 2008, and the least - 6 in 2004. The data has a rising trend.
When looking into fire subcategories, the most reports belonged to: Structure Fires (49.4%), and Outside Fires (29.3%).
Fire incident types reported to NFIRS in Zip Code 43953
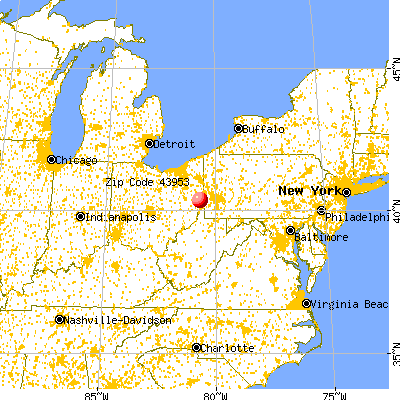


 Nearest zip codes: 43938, 43952, 43944, 43913, 43948, 26037.


 Based on the data from the years 2002 - 2018 the average number of fire incidents per year is 27. The highest number of reported fires - 42 took place in 2008, and the least - 6 in 2004. The data has a rising trend.
 When looking into fire subcategories, the most reports belonged to: Structure Fires (49.4%), and Outside Fires (29.3%).