Estimated zip code population in 2022: 1,359 Zip code population in 2010: 1,825 Zip code population in 2000: 1,873
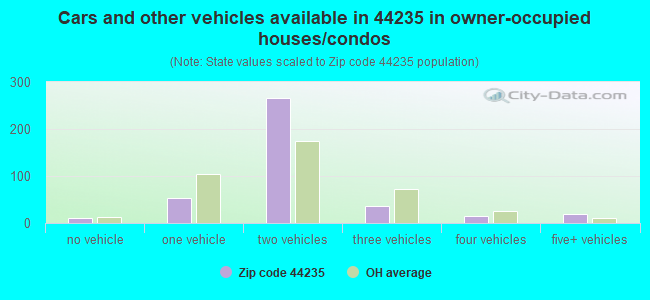
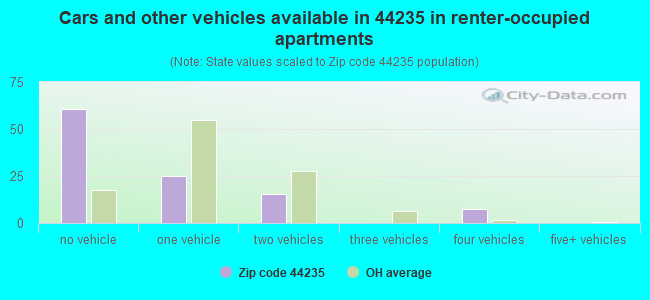
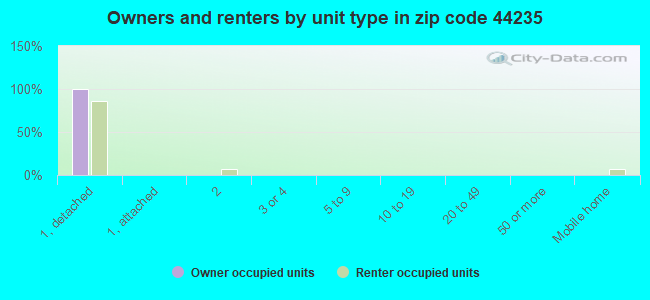
Houses and condos: 525 Renter-occupied apartments: 111
% of renters here:
22%
State:
33%
March 2022 cost of living index in zip code 44235: 86.4 (less than average, U.S. average is 100)
Land area: 25.0 sq. mi. Water area: 0.0 sq. mi.
Population density: 54 people per square mile
(very low).
OSM Map
General Map
Google Map
MSN Map
OSM Map
General Map
Google Map
MSN Map
OSM Map
General Map
Google Map
MSN Map
OSM Map
General Map
Google Map
MSN Map
Please wait while loading the map...
Real estate property taxes paid for housing units in 2022:
This zip code:
1.1% ($3,374)
Ohio:
1.3% ($2,639)
Median real estate property taxes paid for housing units with mortgages in 2022: $3,310 (1.1%) Median real estate property taxes paid for housing units with no mortgage in 2022: $3,779 (1.4%)
Business Search- 14 Million verified businesses
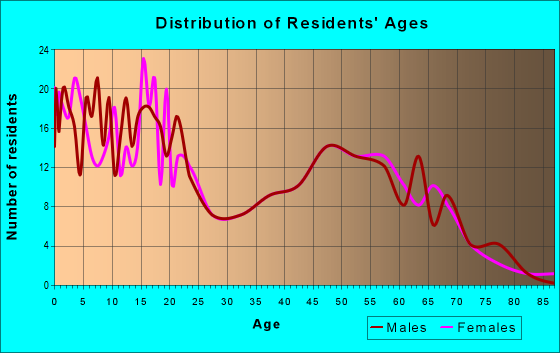
Males: 695
(51.1%)
Females: 664
(48.9%)
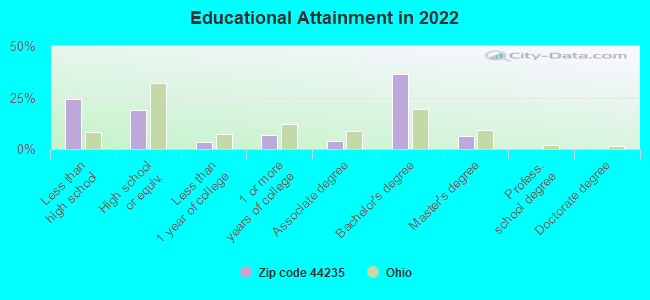
For population 25 years and over in 44235:
High school or higher: 75.3%
Bachelor's degree or higher: 42.2%
Graduate or professional degree: 6.2%
Unemployed: 1.3%
Mean travel time to work (commute): 29.4 minutes
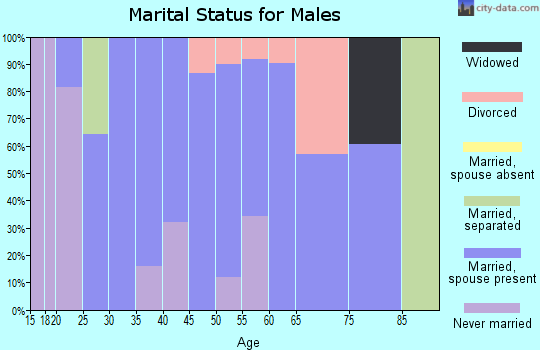
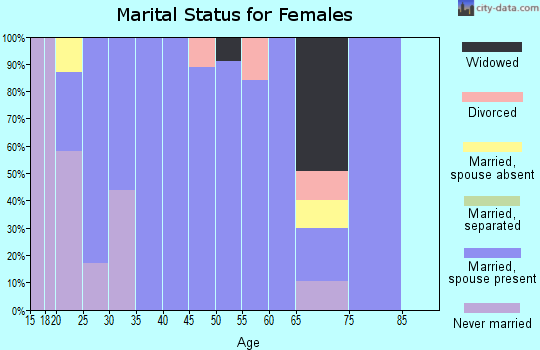
For population 15 years and over in 44235:
Never married: 17.2%
Now married: 70.1%
Separated: 0.0%
Widowed: 4.6%
Divorced: 8.1%
Zip code 44235 compared to state average:
Unemployed percentage significantly below state average.
Black race population percentage significantly below state average.
Hispanic race population percentage significantly below state average.
Foreign-born population percentage significantly below state average.
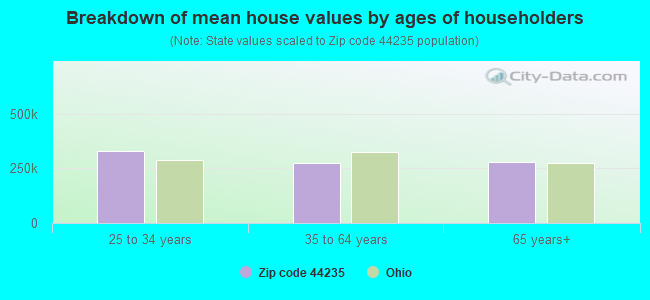
Estimated median house/condo value in 2022: $300,972
44235:
$300,972
Ohio:
$204,100
Median resident age:
This zip code:
43.6 years
Ohio median age:
39.9 years
Average household size:
This zip code:
2.7 people
Ohio:
2.4 people
Averages for the 2020 tax year for zip code 44235, filed in 2021:
Average Adjusted Gross Income (AGI) in 2020: $58,358 (Individual Income Tax Returns)
Here:
$58,358
State:
$67,288
Salary/wage: $52,992 (reported on 77.6% of returns)
Here:
$52,992
State:
$55,628
(% of AGI for various income ranges: 1137.5% for AGIs below $25k, 3460.8% for AGIs $25k-50k, 6354.4% for AGIs $50k-75k, 10088.0% for AGIs $75k-100k, 18791.7% for AGIs $100k-200k)
Taxable interest for individuals: $818 (reported on 32.8% of returns)
This zip code:
$818
Ohio:
$1,518
(% of AGI for various income ranges: 8.3% for AGIs below $25k, 57.5% for AGIs $25k-50k, 27.8% for AGIs $50k-75k, 82.0% for AGIs $75k-100k, 58.3% for AGIs $100k-200k)
Ordinary dividends: $2,100 (reported on 16.4% of returns)
Here:
$2,100
State:
$7,167
(% of AGI for various income ranges: 18.3% for AGIs below $25k, 52.5% for AGIs $25k-50k, 81.1% for AGIs $50k-75k, 121.7% for AGIs $100k-200k)
Net capital gain/loss in AGI: +$2,967 (reported on 13.4% of returns)
Here:
+$2,967
State:
+$18,919
(% of AGI for various income ranges: 15.0% for AGIs $25k-50k, 73.3% for AGIs $50k-75k, 305.0% for AGIs $100k-200k)
Profit/loss from business: +$10,470 (reported on 14.9% of returns)
Here:
+$10,470
State:
+$13,744
(% of AGI for various income ranges: 100.0% for AGIs below $25k, 281.7% for AGIs $25k-50k, 345.6% for AGIs $50k-75k, 463.3% for AGIs $100k-200k)
Taxable individual retirement arrangement distribution: $14,943 (reported on 10.4% of returns)
44235:
$14,943
Ohio:
$18,876
(% of AGI for various income ranges: 330.0% for AGIs below $25k, 1300.0% for AGIs $75k-100k)
Earned income credit: $1,617 (reported on 9.0% of returns)
Here:
$1,617
State:
$2,304
(% of AGI for various income ranges: 26.7% for AGIs below $25k, 54.2% for AGIs $25k-50k)
Percentage of individuals using paid preparers for their 2020 taxes: 89.6%
Here:
90%
State:
94%
(% for various income ranges: 84.2% for AGIs below $25k, 94.1% for AGIs $25k-50k, 84.6% for AGIs $50k-75k, 100.0% for AGIs $75k-100k, 90.9% for AGIs $100k-200k)
Averages for the 2012 tax year for zip code 44235, filed in 2013:
Average Adjusted Gross Income (AGI) in 2012: $49,740 (Individual Income Tax Returns)
Here:
$49,740
State:
$54,926
Salary/wage: $42,768 (reported on 80.6% of returns)
Here:
$42,768
State:
$45,869
(% of AGI for various income ranges: 59.8% for AGIs below $25k, 72.1% for AGIs $25k-50k, 71.6% for AGIs $50k-75k, 80.0% for AGIs $75k-100k, 62.1% for AGIs $100k-200k)
Taxable interest for individuals: $519 (reported on 41.9% of returns)
This zip code:
$519
Ohio:
$1,297
(% of AGI for various income ranges: 1.0% for AGIs below $25k, 0.5% for AGIs $25k-50k, 0.4% for AGIs $50k-75k, 0.4% for AGIs $75k-100k, 0.3% for AGIs $100k-200k)
Ordinary dividends: $1,491 (reported on 17.7% of returns)
Here:
$1,491
State:
$5,821
(% of AGI for various income ranges: 1.3% for AGIs below $25k, 0.6% for AGIs $25k-50k, 0.8% for AGIs $50k-75k, 0.7% for AGIs $75k-100k)
Net capital gain/loss in AGI: +$717 (reported on 9.7% of returns)
Here:
+$717
State:
+$11,232
(% of AGI for various income ranges: 0.6% for AGIs $25k-50k)
Profit/loss from business: +$6,910 (reported on 16.1% of returns)
Here:
+$6,910
State:
+$12,773
(% of AGI for various income ranges: 10.6% for AGIs below $25k, 3.5% for AGIs $25k-50k, 3.1% for AGIs $50k-75k)
Taxable individual retirement arrangement distribution: $9,457 (reported on 11.3% of returns)
44235:
$9,457
Ohio:
$14,511
(% of AGI for various income ranges: 5.3% for AGIs below $25k, 3.3% for AGIs $25k-50k, 5.0% for AGIs $75k-100k)
Total itemized deductions: $16,690 (21% of AGI, reported on 32.3% of returns)
Here:
$16,690
State:
$21,278
Here:
21.2% of AGI
State:
18.8% of AGI
(% of AGI for various income ranges: 10.9% for AGIs below $25k, 8.9% for AGIs $25k-50k, 9.8% for AGIs $50k-75k, 13.1% for AGIs $75k-100k, 11.1% for AGIs $100k-200k)
Charity contributions: $2,353 (reported on 24.2% of returns)
Here:
$2,353
State:
$3,943
(% of AGI for various income ranges: 1.3% for AGIs $25k-50k, 1.2% for AGIs $50k-75k, 1.7% for AGIs $75k-100k, 1.0% for AGIs $100k-200k)
Taxes paid: $6,230 (reported on 32.3% of returns)
44235:
$6,230
State:
$9,568
(% of AGI for various income ranges: 2.4% for AGIs below $25k, 3.1% for AGIs $25k-50k, 3.1% for AGIs $50k-75k, 4.8% for AGIs $75k-100k, 5.2% for AGIs $100k-200k)
Earned income credit: $1,912 (reported on 12.9% of returns)
Here:
$1,912
State:
$2,285
(% of AGI for various income ranges: 3.6% for AGIs below $25k, 0.9% for AGIs $25k-50k)
Percentage of individuals using paid preparers for their 2012 taxes: 59.7%
Here:
60%
State:
51%
(% for various income ranges: 50.0% for AGIs below $25k, 62.5% for AGIs $25k-50k, 60.0% for AGIs $50k-75k, 71.4% for AGIs $75k-100k, 71.4% for AGIs $100k-200k)
Averages for the 2004 tax year for zip code 44235, filed in 2005:
Average Adjusted Gross Income (AGI) in 2004: $40,461 (Individual Income Tax Returns)
Here:
$40,461
State:
$44,480
Salary/wage: $37,696 (reported on 85.9% of returns)
Here:
$37,696
State:
$39,198
(% of AGI for various income ranges: 88.2% for AGIs below $10k, 61.0% for AGIs $10k-25k, 80.7% for AGIs $25k-50k, 87.6% for AGIs $50k-75k, 85.2% for AGIs $75k-100k, 67.2% for AGIs over 100k)
Taxable interest for individuals: $935 (reported on 50.2% of returns)
This zip code:
$935
Ohio:
$1,532
(% of AGI for various income ranges: 4.8% for AGIs below $10k, 3.3% for AGIs $10k-25k, 1.4% for AGIs $25k-50k, 0.3% for AGIs $50k-75k, 1.2% for AGIs $75k-100k, 0.6% for AGIs over 100k)
Taxable dividends: $1,338 (reported on 20.1% of returns)
Here:
$1,338
State:
$3,496
(% of AGI for various income ranges: 1.0% for AGIs below $10k, 1.6% for AGIs $10k-25k, 0.5% for AGIs $25k-50k, 0.3% for AGIs $50k-75k, 0.2% for AGIs $75k-100k, 1.7% for AGIs over 100k)
Net capital gain/loss: +$3,171 (reported on 12.7% of returns)
Here:
+$3,171
State:
+$8,582
(% of AGI for various income ranges: 0.5% for AGIs $10k-25k, 0.3% for AGIs $25k-50k, 0.2% for AGIs $50k-75k, 4.4% for AGIs $75k-100k)
Profit/loss from business: +$5,495 (reported on 15.3% of returns)
Here:
+$5,495
State:
+$10,813
(% of AGI for various income ranges: 14.5% for AGIs below $10k, 12.3% for AGIs $10k-25k, 3.7% for AGIs $25k-50k, 0.1% for AGIs $50k-75k, -1.9% for AGIs $75k-100k)
IRA payment deduction: $2,100 (reported on 1.5% of returns)
44235:
$2,100
Ohio:
$2,794
Total itemized deductions: $14,943 (24% of AGI, reported on 40.6% of returns)
Here:
$14,943
State:
$17,503
Here:
24.0% of AGI
State:
20.8% of AGI
(% of AGI for various income ranges: 14.9% for AGIs $10k-25k, 12.4% for AGIs $25k-50k, 16.1% for AGIs $50k-75k, 16.3% for AGIs $75k-100k, 18.5% for AGIs over 100k)
Charity contributions deductions: $1,914 (3% of AGI, reported on 30.4% of returns)
Here:
$1,914
State:
$3,087
Here:
3.0% of AGI
State:
3.4% of AGI
(% of AGI for various income ranges: 0.4% for AGIs $10k-25k, 1.2% for AGIs $25k-50k, 1.1% for AGIs $50k-75k, 1.3% for AGIs $75k-100k, 3.7% for AGIs over 100k)
Total tax: $4,355 (reported on 79.6% of returns)
44235:
$4,355
State:
$6,781
(% of AGI for various income ranges: 2.3% for AGIs below $10k, 4.9% for AGIs $10k-25k, 7.4% for AGIs $25k-50k, 8.5% for AGIs $50k-75k, 9.1% for AGIs $75k-100k, 13.5% for AGIs over 100k)
Earned income credit: $1,262 (reported on 6.5% of returns)
Here:
$1,262
State:
$1,696
Percentage of individuals using paid preparers for their 2004 taxes: 59.7%
Here:
60%
State:
55%
(% for various income ranges: 43.4% for AGIs below $10k, 68.2% for AGIs $10k-25k, 61.9% for AGIs $25k-50k, 57.9% for AGIs $50k-75k, 60.7% for AGIs $75k-100k, 76.9% for AGIs over 100k)
Cemeteries: Vanderhoef Cemetery (1), Voorhees Cemetery (2), Munson Cemetery (3), East Homerville Reformed Cemetery (4), Homer Lutheran Cemetery (5). Display/hide their locations on the map
Size of family households: 177 2-persons, 40 3-persons, 118 4-persons, 4 5-persons, 7 6-persons, 26 7-or-more-persons
Size of nonfamily households: 111 1-person, 19 2-persons
348 married couples with children.
16 single-parent households (16 women).
85.5% of residents of 44235 zip code speak English at home.
16.4% of residents speak other Indo-European language at home (36% very well, 58% well, 6% not at all).
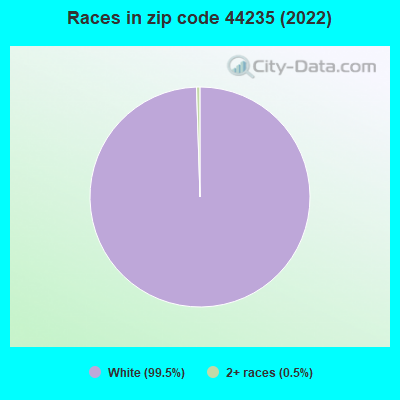
Foreign born population: 0 (0.0%)
:
0.0%
Whole state:
5.0%
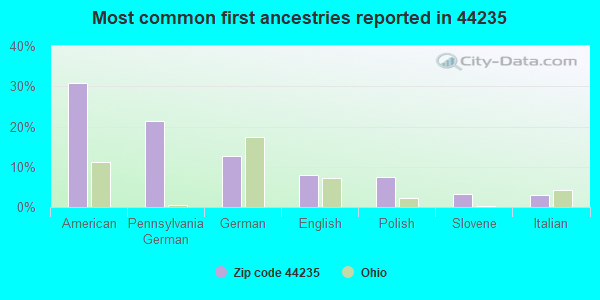
31%American
21%Pennsylvania German
13%German
8%English
8%Polish
3%Slovene
3%Italian
Housing units lacking complete plumbing facilities: 12.6% Housing units lacking complete kitchen facilities: 13.3%
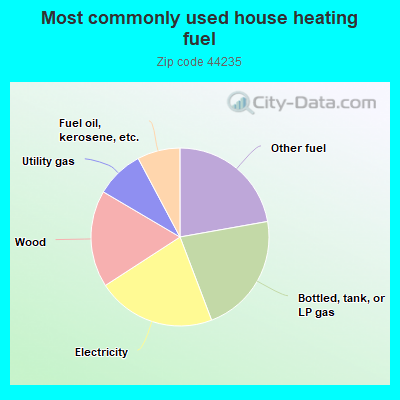
22.3%Other fuel
22.1%Bottled, tank, or LP gas
21.7%Electricity
17.7%Wood
8.8%Utility gas
7.8%Fuel oil, kerosene, etc.
Population in 1990: 1,196. Population change in the 1990s: +677 (+56.6%).
Place of birth for U.S.-born residents:
This state: 1,226
Northeast: 19
Midwest: 60
South: 42
West: 9
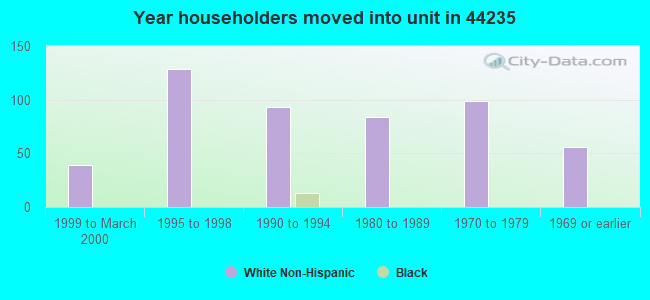
74% of the 44235 zip code residents lived in the same house 5 years ago. Out of people who lived in different houses, 44% lived in this county. Out of people who lived in different counties, 50% lived in Ohio.
94% of the 44235 zip code residents lived in the same house 1 year ago. Out of people who lived in different houses, 72% moved from this county. Out of people who lived in different houses, 30% moved from different county within same state.
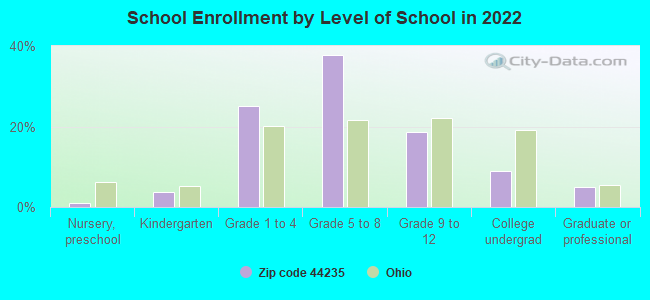
Private vs. public school enrollment:
Students in private schools in grades 1 to 8 (elementary and middle school): 10
Here:
4.1%
Ohio:
16.0%
Students in private schools in grades 9 to 12 (high school):
Here:
0.0%
Ohio:
13.1%
Students in private undergraduate colleges: 8
Here:
20.9%
Ohio:
22.3%
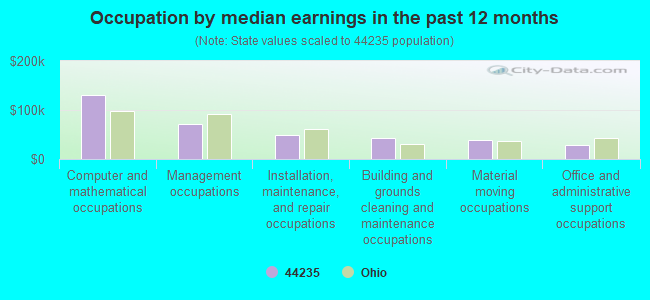
Occupation by median earnings in the past 12 months ($)
130,742Computer and mathematical occupations
72,016Management occupations
48,327Installation, maintenance, and repair occupations
43,164Building and grounds cleaning and maintenance occupations
37,888Material moving occupations
28,474Office and administrative support occupations
Top industries in this zip code by the number of employees in 2005:
Other Services (except Public Administration): Religious Organizations (5-9 employees: 1 establishment)
Professional, Scientific, and Technical Services: Offices of Certified Public Accountants (1-4: 1)
Other Services (except Public Administration): Reupholstery and Furniture Repair (1-4: 1)
Construction: Painting and Wall Covering Contractors (1-4: 1)
Accommodation and Food Services: RV (Recreational Vehicle) Parks and Campgrounds (1-4: 1)
Fatal accident statistics in 2014:
Fatal accident count: 1
Vehicles involved in fatal accidents: 1
Fatal accidents caused by drunken drivers: 0
Fatalities: 2
Persons involved in fatal accidents: 2
Pedestrians involved in fatal accidents: 0
Fatal accident statistics in 2013:
Fatal accident count: 1
Vehicles involved in fatal accidents: 1
Fatal accidents caused by drunken drivers: 0
Fatalities: 1
Persons involved in fatal accidents: 1
Pedestrians involved in fatal accidents: 1
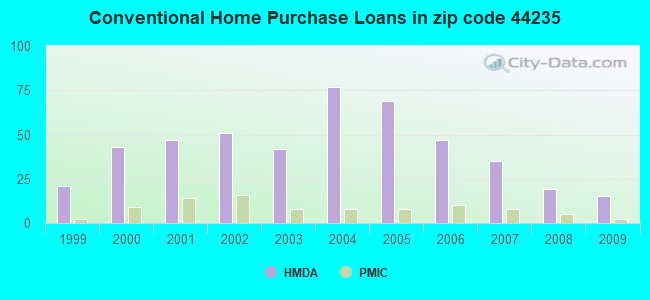
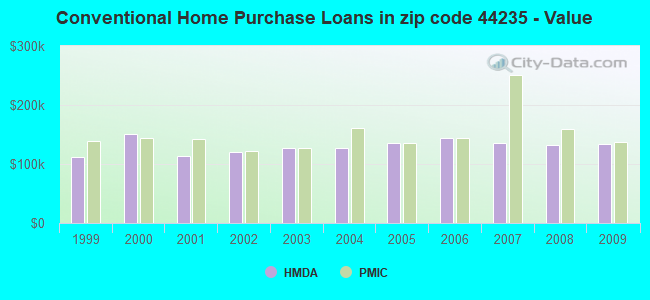
Home Mortgage Disclosure Act Aggregated Statistics For Year 2009 (Based on 2 partial tracts)
A) FHA, FSA/RHS & VA Home Purchase Loans
B) Conventional Home Purchase Loans
C) Refinancings
D) Home Improvement Loans
E) Loans on Dwellings For 5+ Families
F) Non-occupant Loans on < 5 Family Dwellings (A B C & D)
Number
Average Value
Number
Average Value
Number
Average Value
Number
Average Value
Number
Average Value
Number
Average Value
LOANS ORIGINATED
12
$125,171
15
$133,713
63
$135,497
3
$8,543
1
$126,160
2
$67,515
APPLICATIONS APPROVED, NOT ACCEPTED
0
$0
0
$0
2
$124,680
0
$0
0
$0
0
$0
APPLICATIONS DENIED
6
$71,457
1
$68,010
34
$135,462
6
$67,185
0
$0
2
$57,165
APPLICATIONS WITHDRAWN
0
$0
2
$61,600
11
$171,584
0
$0
0
$0
0
$0
FILES CLOSED FOR INCOMPLETENESS
0
$0
0
$0
8
$158,805
0
$0
0
$0
1
$225,700
Aggregated Statistics For Year 2008 (Based on 2 partial tracts)
A) FHA, FSA/RHS & VA Home Purchase Loans
B) Conventional Home Purchase Loans
C) Refinancings
D) Home Improvement Loans
E) Loans on Dwellings For 5+ Families
F) Non-occupant Loans on < 5 Family Dwellings (A B C & D)
G) Loans On Manufactured Home Dwelling (A B C & D)
Number
Average Value
Number
Average Value
Number
Average Value
Number
Average Value
Number
Average Value
Number
Average Value
Number
Average Value
LOANS ORIGINATED
10
$158,780
19
$132,174
38
$133,912
7
$21,401
0
$0
2
$54,210
3
$98,230
APPLICATIONS APPROVED, NOT ACCEPTED
2
$105,950
4
$119,505
2
$28,090
0
$0
0
$0
0
$0
1
$25,630
APPLICATIONS DENIED
2
$133,055
4
$86,732
41
$159,956
4
$49,280
1
$133,060
1
$92,650
1
$36,470
APPLICATIONS WITHDRAWN
0
$0
1
$208,950
18
$142,638
2
$67,515
0
$0
0
$0
0
$0
FILES CLOSED FOR INCOMPLETENESS
0
$0
0
$0
2
$171,495
0
$0
0
$0
0
$0
0
$0
Aggregated Statistics For Year 2007 (Based on 2 partial tracts)
A) FHA, FSA/RHS & VA Home Purchase Loans
B) Conventional Home Purchase Loans
C) Refinancings
D) Home Improvement Loans
F) Non-occupant Loans on < 5 Family Dwellings (A B C & D)
G) Loans On Manufactured Home Dwelling (A B C & D)
Number
Average Value
Number
Average Value
Number
Average Value
Number
Average Value
Number
Average Value
Number
Average Value
LOANS ORIGINATED
2
$90,180
35
$136,266
75
$112,082
7
$83,494
4
$96,590
4
$71,702
APPLICATIONS APPROVED, NOT ACCEPTED
0
$0
4
$34,002
12
$109,566
0
$0
1
$138,970
2
$53,220
APPLICATIONS DENIED
0
$0
7
$86,733
63
$127,737
11
$60,749
2
$109,400
2
$29,570
APPLICATIONS WITHDRAWN
0
$0
4
$114,082
19
$123,459
4
$68,500
3
$111,373
1
$39,420
FILES CLOSED FOR INCOMPLETENESS
0
$0
0
$0
6
$160,160
0
$0
0
$0
0
$0
Aggregated Statistics For Year 2006 (Based on 2 partial tracts)
A) FHA, FSA/RHS & VA Home Purchase Loans
B) Conventional Home Purchase Loans
C) Refinancings
D) Home Improvement Loans
F) Non-occupant Loans on < 5 Family Dwellings (A B C & D)
G) Loans On Manufactured Home Dwelling (A B C & D)
Number
Average Value
Number
Average Value
Number
Average Value
Number
Average Value
Number
Average Value
Number
Average Value
LOANS ORIGINATED
4
$98,312
47
$143,352
103
$112,588
12
$28,500
4
$221,268
3
$96,260
APPLICATIONS APPROVED, NOT ACCEPTED
0
$0
1
$97,570
29
$109,606
0
$0
3
$130,427
0
$0
APPLICATIONS DENIED
1
$75,890
13
$109,402
87
$140,420
10
$57,066
2
$125,665
0
$0
APPLICATIONS WITHDRAWN
1
$129,110
4
$139,710
42
$135,450
5
$86,930
4
$195,642
1
$129,110
FILES CLOSED FOR INCOMPLETENESS
0
$0
4
$145,622
10
$149,713
1
$20,700
1
$145,870
0
$0
Aggregated Statistics For Year 2005 (Based on 2 partial tracts)
A) FHA, FSA/RHS & VA Home Purchase Loans
B) Conventional Home Purchase Loans
C) Refinancings
D) Home Improvement Loans
E) Loans on Dwellings For 5+ Families
F) Non-occupant Loans on < 5 Family Dwellings (A B C & D)
G) Loans On Manufactured Home Dwelling (A B C & D)
Number
Average Value
Number
Average Value
Number
Average Value
Number
Average Value
Number
Average Value
Number
Average Value
Number
Average Value
LOANS ORIGINATED
7
$142,209
69
$134,941
109
$133,183
25
$53,696
1
$782,570
2
$110,385
2
$84,270
APPLICATIONS APPROVED, NOT ACCEPTED
0
$0
9
$116,191
19
$119,828
2
$102,500
0
$0
1
$145,870
0
$0
APPLICATIONS DENIED
0
$0
11
$91,303
70
$134,281
18
$33,511
0
$0
1
$91,660
1
$133,060
APPLICATIONS WITHDRAWN
0
$0
10
$116,991
59
$135,294
9
$118,162
0
$0
2
$110,385
1
$89,690
FILES CLOSED FOR INCOMPLETENESS
0
$0
0
$0
9
$150,578
0
$0
0
$0
0
$0
0
$0
Aggregated Statistics For Year 2004 (Based on 2 partial tracts)
A) FHA, FSA/RHS & VA Home Purchase Loans
B) Conventional Home Purchase Loans
C) Refinancings
D) Home Improvement Loans
E) Loans on Dwellings For 5+ Families
F) Non-occupant Loans on < 5 Family Dwellings (A B C & D)
G) Loans On Manufactured Home Dwelling (A B C & D)
Number
Average Value
Number
Average Value
Number
Average Value
Number
Average Value
Number
Average Value
Number
Average Value
Number
Average Value
LOANS ORIGINATED
3
$129,770
77
$127,654
98
$128,329
23
$56,993
2
$102,500
4
$90,675
0
$0
APPLICATIONS APPROVED, NOT ACCEPTED
0
$0
9
$116,629
20
$138,280
1
$3,940
0
$0
1
$3,940
0
$0
APPLICATIONS DENIED
0
$0
10
$91,267
77
$142,259
11
$48,564
0
$0
1
$92,650
2
$104,965
APPLICATIONS WITHDRAWN
1
$91,660
9
$107,321
50
$149,062
7
$70,119
0
$0
2
$34,990
1
$22,670
FILES CLOSED FOR INCOMPLETENESS
0
$0
6
$193,998
11
$172,749
0
$0
0
$0
0
$0
0
$0
Aggregated Statistics For Year 2003 (Based on 2 partial tracts)
A) FHA, FSA/RHS & VA Home Purchase Loans
B) Conventional Home Purchase Loans
C) Refinancings
D) Home Improvement Loans
E) Loans on Dwellings For 5+ Families
F) Non-occupant Loans on < 5 Family Dwellings (A B C & D)
Number
Average Value
Number
Average Value
Number
Average Value
Number
Average Value
Number
Average Value
Number
Average Value
LOANS ORIGINATED
7
$149,951
42
$127,635
186
$125,134
13
$25,853
1
$122,210
7
$102,361
APPLICATIONS APPROVED, NOT ACCEPTED
0
$0
5
$103,686
22
$111,059
2
$16,260
0
$0
0
$0
APPLICATIONS DENIED
1
$164,600
4
$118,765
98
$135,731
8
$12,812
0
$0
0
$0
APPLICATIONS WITHDRAWN
0
$0
6
$149,812
69
$134,413
3
$31,867
0
$0
2
$47,310
FILES CLOSED FOR INCOMPLETENESS
0
$0
1
$83,780
14
$139,955
3
$28,253
0
$0
0
$0
Aggregated Statistics For Year 2002 (Based on 2 partial tracts)
A) FHA, FSA/RHS & VA Home Purchase Loans
B) Conventional Home Purchase Loans
C) Refinancings
D) Home Improvement Loans
E) Loans on Dwellings For 5+ Families
F) Non-occupant Loans on < 5 Family Dwellings (A B C & D)
Number
Average Value
Number
Average Value
Number
Average Value
Number
Average Value
Number
Average Value
Number
Average Value
LOANS ORIGINATED
3
$107,430
51
$120,707
155
$112,072
10
$20,106
1
$59,140
0
$0
APPLICATIONS APPROVED, NOT ACCEPTED
1
$85,750
5
$141,138
26
$105,118
1
$4,930
0
$0
0
$0
APPLICATIONS DENIED
1
$76,880
2
$101,025
66
$114,359
5
$19,120
0
$0
1
$49,280
APPLICATIONS WITHDRAWN
1
$110,390
1
$82,790
53
$131,103
2
$21,190
0
$0
0
$0
FILES CLOSED FOR INCOMPLETENESS
0
$0
0
$0
13
$96,437
0
$0
0
$0
0
$0
Aggregated Statistics For Year 2001 (Based on 2 partial tracts)
A) FHA, FSA/RHS & VA Home Purchase Loans
B) Conventional Home Purchase Loans
C) Refinancings
D) Home Improvement Loans
F) Non-occupant Loans on < 5 Family Dwellings (A B C & D)
Number
Average Value
Number
Average Value
Number
Average Value
Number
Average Value
Number
Average Value
LOANS ORIGINATED
10
$112,851
47
$114,288
142
$104,522
15
$20,961
2
$60,120
APPLICATIONS APPROVED, NOT ACCEPTED
0
$0
3
$79,177
18
$76,220
3
$36,797
0
$0
APPLICATIONS DENIED
2
$64,555
6
$83,612
65
$95,755
6
$30,718
1
$17,740
APPLICATIONS WITHDRAWN
1
$71,950
2
$105,950
44
$105,101
6
$37,125
0
$0
FILES CLOSED FOR INCOMPLETENESS
0
$0
0
$0
4
$133,302
1
$76,880
0
$0
Aggregated Statistics For Year 2000 (Based on 2 partial tracts)
A) FHA, FSA/RHS & VA Home Purchase Loans
B) Conventional Home Purchase Loans
C) Refinancings
D) Home Improvement Loans
F) Non-occupant Loans on < 5 Family Dwellings (A B C & D)
Number
Average Value
Number
Average Value
Number
Average Value
Number
Average Value
Number
Average Value
LOANS ORIGINATED
7
$104,896
43
$151,255
53
$85,264
12
$30,964
4
$127,635
APPLICATIONS APPROVED, NOT ACCEPTED
0
$0
3
$97,903
24
$85,131
6
$19,877
0
$0
APPLICATIONS DENIED
0
$0
4
$109,895
54
$94,818
12
$20,369
1
$20,700
APPLICATIONS WITHDRAWN
0
$0
4
$176,670
19
$90,208
1
$97,570
2
$107,430
FILES CLOSED FOR INCOMPLETENESS
0
$0
1
$114,330
6
$100,695
0
$0
0
$0
Aggregated Statistics For Year 1999 (Based on 1 partial tract)
A) FHA, FSA/RHS & VA Home Purchase Loans
B) Conventional Home Purchase Loans
C) Refinancings
D) Home Improvement Loans
F) Non-occupant Loans on < 5 Family Dwellings (A B C & D)
Detailed PMIC statistics for the following Tracts:4100.00
2003 - 2018 National Fire Incident Reporting System (NFIRS) incidents
According to the data from the years 2003 - 2018 the average number of fires per year is 6. The highest number of fire incidents - 14 took place in 2014, and the least - 0 in 2004. The data has a decreasing trend.
When looking into fire subcategories, the most incidents belonged to: Structure Fires (49.0%), and Outside Fires (37.0%).
Fire incident types reported to NFIRS in Zip Code 44235


 Nearest zip codes: 44275, 44287, 44254, 44880, 44866, 44214.


 According to the data from the years 2003 - 2018 the average number of fires per year is 6. The highest number of fire incidents - 14 took place in 2014, and the least - 0 in 2004. The data has a decreasing trend.
 When looking into fire subcategories, the most incidents belonged to: Structure Fires (49.0%), and Outside Fires (37.0%).