Estimated zip code population in 2022: 1,487 Zip code population in 2010: 1,624 Zip code population in 2000: 1,703
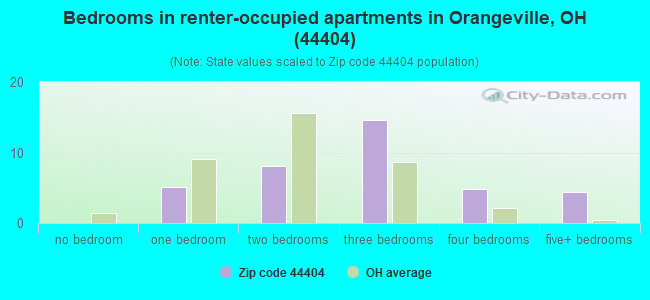
Houses and condos: 564 Renter-occupied apartments: 38
% of renters here:
7%
State:
33%
March 2022 cost of living index in zip code 44404: 83.6 (less than average, U.S. average is 100)
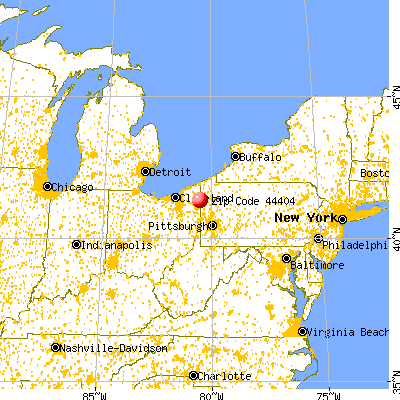
Land area: 17.0 sq. mi. Water area: 0.6 sq. mi.
Population density: 87 people per square mile
(very low).
OSM Map
General Map
Google Map
MSN Map
OSM Map
General Map
Google Map
MSN Map
OSM Map
General Map
Google Map
MSN Map
OSM Map
General Map
Google Map
MSN Map
Please wait while loading the map...
Real estate property taxes paid for housing units in 2022:
This zip code:
1.1% ($1,918)
Ohio:
1.3% ($2,639)
Median real estate property taxes paid for housing units with mortgages in 2022: $1,488 (1.2%) Median real estate property taxes paid for housing units with no mortgage in 2022: $2,319 (1.3%)
Business Search- 14 Million verified businesses
Males: 726
(48.8%)
Females: 761
(51.2%)
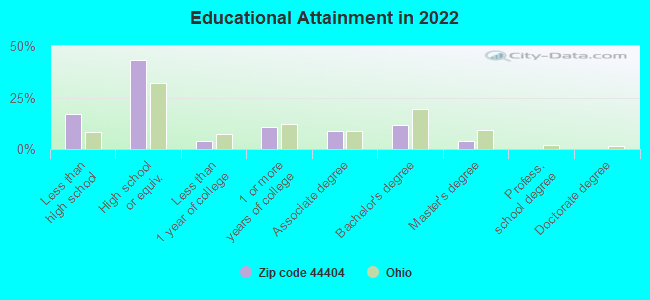
For population 25 years and over in 44404:
High school or higher: 81.3%
Bachelor's degree or higher: 15.9%
Graduate or professional degree: 4.2%
Unemployed: 4.4%
Mean travel time to work (commute): 32.6 minutes
For population 15 years and over in 44404:
Never married: 14.7%
Now married: 62.1%
Separated: 0.5%
Widowed: 11.9%
Divorced: 10.8%
Zip code 44404 compared to state average:
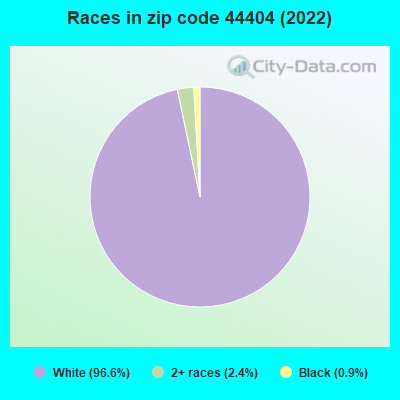
Black race population percentage significantly below state average.
Hispanic race population percentage significantly below state average.
Median age above state average.
Foreign-born population percentage significantly below state average.
Renting percentage significantly below state average.
Length of stay since moving in significantly above state average.
House age above state average.
Number of college students below state average.
Percentage of population with a bachelor's degree or higher below state average.
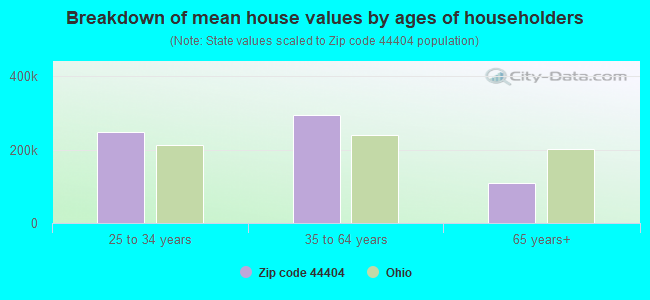
Estimated median house/condo value in 2022: $173,925
44404:
$173,925
Ohio:
$204,100
According to our research of Ohio and other state lists, there were 2 registered sex offenders living in 44404 zip code as of April 25, 2024. The ratio of all residents to sex offenders in zip code 44404 is 888 to 1. The ratio of registered sex offenders to all residents in this zip code is lower than the state average.
Median resident age:
This zip code:
46.9 years
Ohio median age:
39.9 years
Average household size:
This zip code:
2.8 people
Ohio:
2.4 people
Averages for the 2020 tax year for zip code 44404, filed in 2021:
Average Adjusted Gross Income (AGI) in 2020: $52,648 (Individual Income Tax Returns)
Here:
$52,648
State:
$67,288
Salary/wage: $44,509 (reported on 79.1% of returns)
Here:
$44,509
State:
$55,628
(% of AGI for various income ranges: 1012.1% for AGIs below $25k, 3478.0% for AGIs $25k-50k, 6123.8% for AGIs $50k-75k, 9050.0% for AGIs $75k-100k, 15064.0% for AGIs $100k-200k)
Taxable interest for individuals: $805 (reported on 29.9% of returns)
This zip code:
$805
Ohio:
$1,518
(% of AGI for various income ranges: 12.1% for AGIs below $25k, 24.0% for AGIs $25k-50k, 16.2% for AGIs $50k-75k, 10.0% for AGIs $75k-100k, 180.0% for AGIs $100k-200k)
Ordinary dividends: $2,164 (reported on 16.4% of returns)
Here:
$2,164
State:
$7,167
(% of AGI for various income ranges: 22.1% for AGIs below $25k, 32.7% for AGIs $25k-50k, 157.5% for AGIs $50k-75k, 64.0% for AGIs $100k-200k)
Net capital gain/loss in AGI: +$1,744 (reported on 13.4% of returns)
Here:
+$1,744
State:
+$18,919
(% of AGI for various income ranges: 8.0% for AGIs $25k-50k, 56.2% for AGIs $50k-75k, 200.0% for AGIs $75k-100k)
Profit/loss from business: +$5,771 (reported on 10.4% of returns)
Here:
+$5,771
State:
+$13,744
(% of AGI for various income ranges: 105.0% for AGIs below $25k, 96.0% for AGIs $25k-50k, 226.0% for AGIs $75k-100k)
Taxable individual retirement arrangement distribution: $15,038 (reported on 11.9% of returns)
44404:
$15,038
Ohio:
$18,876
(% of AGI for various income ranges: 84.3% for AGIs below $25k, 252.7% for AGIs $25k-50k, 1412.0% for AGIs $75k-100k)
Earned income credit: $2,011 (reported on 13.4% of returns)
Here:
$2,011
State:
$2,304
(% of AGI for various income ranges: 75.0% for AGIs below $25k, 50.7% for AGIs $25k-50k)
Percentage of individuals using paid preparers for their 2020 taxes: 95.5%
Here:
96%
State:
94%
(% for various income ranges: 95.0% for AGIs below $25k, 95.0% for AGIs $25k-50k, 91.7% for AGIs $50k-75k, 100.0% for AGIs $75k-100k, 100.0% for AGIs $100k-200k)
Averages for the 2012 tax year for zip code 44404, filed in 2013:
Average Adjusted Gross Income (AGI) in 2012: $59,896 (Individual Income Tax Returns)
Here:
$59,896
State:
$54,926
Salary/wage: $41,744 (reported on 77.5% of returns)
Here:
$41,744
State:
$45,869
(% of AGI for various income ranges: 68.1% for AGIs below $25k, 67.1% for AGIs $25k-50k, 66.2% for AGIs $50k-75k, 72.4% for AGIs $75k-100k, 77.2% for AGIs $100k-200k)
Taxable interest for individuals: $564 (reported on 35.2% of returns)
This zip code:
$564
Ohio:
$1,297
(% of AGI for various income ranges: 1.1% for AGIs below $25k, 0.4% for AGIs $25k-50k, 0.4% for AGIs $50k-75k, 0.2% for AGIs $100k-200k, 0.3% for AGIs over 200k)
Ordinary dividends: $1,292 (reported on 16.9% of returns)
Here:
$1,292
State:
$5,821
(% of AGI for various income ranges: 1.1% for AGIs $25k-50k, 0.8% for AGIs $50k-75k, 0.3% for AGIs $100k-200k)
Net capital gain/loss in AGI: +$114 (reported on 9.9% of returns)
Here:
+$114
State:
+$11,232
(% of AGI for various income ranges: 0.3% for AGIs $100k-200k)
Profit/loss from business: +$1,729 (reported on 9.9% of returns)
Here:
+$1,729
State:
+$12,773
(% of AGI for various income ranges: 1.6% for AGIs below $25k, 1.0% for AGIs $50k-75k)
Taxable individual retirement arrangement distribution: $9,600 (reported on 11.3% of returns)
44404:
$9,600
Ohio:
$14,511
(% of AGI for various income ranges: 2.6% for AGIs $25k-50k, 4.0% for AGIs $50k-75k, 3.3% for AGIs $100k-200k)
Total itemized deductions: $19,133 (14% of AGI, reported on 16.9% of returns)
Here:
$19,133
State:
$21,278
Here:
13.9% of AGI
State:
18.8% of AGI
(% of AGI for various income ranges: 8.4% for AGIs $50k-75k, 6.8% for AGIs $75k-100k, 13.0% for AGIs $100k-200k)
Charity contributions: $2,450 (reported on 11.3% of returns)
Here:
$2,450
State:
$3,943
(% of AGI for various income ranges: 1.1% for AGIs $50k-75k, 1.2% for AGIs $100k-200k)
Taxes paid: $8,025 (reported on 16.9% of returns)
44404:
$8,025
State:
$9,568
(% of AGI for various income ranges: 1.9% for AGIs $50k-75k, 2.4% for AGIs $75k-100k, 7.1% for AGIs $100k-200k)
Earned income credit: $1,722 (reported on 12.7% of returns)
Here:
$1,722
State:
$2,285
(% of AGI for various income ranges: 3.0% for AGIs below $25k, 1.1% for AGIs $25k-50k)
Percentage of individuals using paid preparers for their 2012 taxes: 56.3%
Here:
56%
State:
51%
(% for various income ranges: 50.0% for AGIs below $25k, 56.2% for AGIs $25k-50k, 53.8% for AGIs $50k-75k, 62.5% for AGIs $75k-100k, 71.4% for AGIs $100k-200k, 66.7% for AGIs over 200k)
Averages for the 2004 tax year for zip code 44404, filed in 2005:
Average Adjusted Gross Income (AGI) in 2004: $37,374 (Individual Income Tax Returns)
Here:
$37,374
State:
$44,480
Salary/wage: $33,681 (reported on 87.1% of returns)
Here:
$33,681
State:
$39,198
(% of AGI for various income ranges: 84.9% for AGIs below $10k, 66.5% for AGIs $10k-25k, 74.2% for AGIs $25k-50k, 84.7% for AGIs $50k-75k, 86.6% for AGIs $75k-100k, 73.4% for AGIs over 100k)
Taxable interest for individuals: $663 (reported on 49.7% of returns)
This zip code:
$663
Ohio:
$1,532
(% of AGI for various income ranges: 1.8% for AGIs below $10k, 3.0% for AGIs $10k-25k, 1.0% for AGIs $25k-50k, 0.6% for AGIs $50k-75k, 0.2% for AGIs $75k-100k, 0.2% for AGIs over 100k)
Taxable dividends: $810 (reported on 22.4% of returns)
Here:
$810
State:
$3,496
(% of AGI for various income ranges: 0.6% for AGIs below $10k, 1.4% for AGIs $10k-25k, 0.3% for AGIs $25k-50k, 0.5% for AGIs $50k-75k, 0.1% for AGIs $75k-100k, 0.6% for AGIs over 100k)
Net capital gain/loss: +$1,568 (reported on 12.1% of returns)
Here:
+$1,568
State:
+$8,582
(% of AGI for various income ranges: 0.3% for AGIs $10k-25k, -0.2% for AGIs $25k-50k, 0.6% for AGIs $50k-75k, 2.7% for AGIs over 100k)
Profit/loss from business: +$1,757 (reported on 10.2% of returns)
Here:
+$1,757
State:
+$10,813
(% of AGI for various income ranges: 6.9% for AGIs below $10k, 3.2% for AGIs $10k-25k, 0.1% for AGIs $25k-50k, -0.1% for AGIs $50k-75k)
IRA payment deduction: $3,105 (reported on 2.6% of returns)
44404:
$3,105
Ohio:
$2,794
Total itemized deductions: $13,625 (20% of AGI, reported on 22.0% of returns)
Here:
$13,625
State:
$17,503
Here:
19.9% of AGI
State:
20.8% of AGI
(% of AGI for various income ranges: 7.6% for AGIs $25k-50k, 8.7% for AGIs $50k-75k, 9.6% for AGIs $75k-100k, 12.5% for AGIs over 100k)
Charity contributions deductions: $2,109 (3% of AGI, reported on 17.7% of returns)
Here:
$2,109
State:
$3,087
Here:
2.9% of AGI
State:
3.4% of AGI
(% of AGI for various income ranges: 0.5% for AGIs $25k-50k, 1.3% for AGIs $50k-75k, 1.1% for AGIs $75k-100k, 2.2% for AGIs over 100k)
Total tax: $4,351 (reported on 77.1% of returns)
44404:
$4,351
State:
$6,781
(% of AGI for various income ranges: 1.8% for AGIs below $10k, 4.0% for AGIs $10k-25k, 7.1% for AGIs $25k-50k, 8.6% for AGIs $50k-75k, 10.3% for AGIs $75k-100k, 16.8% for AGIs over 100k)
Earned income credit: $1,558 (reported on 10.6% of returns)
Here:
$1,558
State:
$1,696
Percentage of individuals using paid preparers for their 2004 taxes: 53.6%
Here:
54%
State:
55%
(% for various income ranges: 33.3% for AGIs below $10k, 59.7% for AGIs $10k-25k, 59.6% for AGIs $25k-50k, 53.2% for AGIs $50k-75k, 56.0% for AGIs $75k-100k, 73.1% for AGIs over 100k)
Likely homosexual households (counted as self-reported same-sex unmarried-partner households)
Lesbian couples: 1.2% of all households
Gay men: 0.0% of all households
Household received Food Stamps/SNAP in the past 12 months: 52 Household did not receive Food Stamps/SNAP in the past 12 months: 484
Women who had a birth in the past 12 months: 36 (34 now married, 2 unmarried) Women who did not have a birth in the past 12 months: 216 (116 now married, 99 unmarried)
Housing units in zip code 44404 with a mortgage: 201 (17 second mortgage, 17 both second mortgage and home equity loan) Houses without a mortgage: 63
Median monthly owner costs for units with a mortgage: $928 Median monthly owner costs for units without a mortgage: $507
Residents with income below the poverty level in 2022:
This zip code:
22.8%
Whole state:
13.4%
Residents with income below 50% of the poverty level in 2022:
This zip code:
18.5%
Whole state:
7.0%
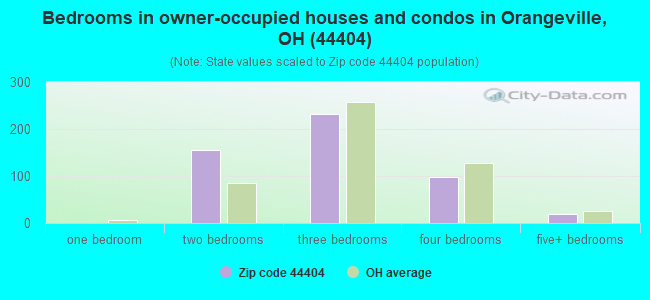
Median number of rooms in houses and condos:
Here:
6.6
State:
6.7
Median number of rooms in apartments:
Here:
5.7
State:
4.4
Notable locations in this zip code not listed on our city pages
Notable locations in zip code 44404: Sharon Speedway (A), Storeyland Christmas Tree Farm (B), Orangeville Volunteer Fire Department (C), Hartford Township Volunteer Fire Department (D). Display/hide their locations on the map
Size of family households: 243 2-persons, 80 3-persons, 41 4-persons, 5 5-persons, 24 6-persons, 23 7-or-more-persons
Size of nonfamily households: 105 1-person, 12 2-persons
104 married couples with children.
64 single-parent households (20 men, 44 women).
99.3% of residents of 44404 zip code speak English at home.
0.3% of residents speak Spanish at home (50% very well, 50% not well).
0.7% of residents speak Asian or Pacific Island language at home (100% very well).
Foreign born population: 0 (0.0%)
:
0.0%
Whole state:
5.0%
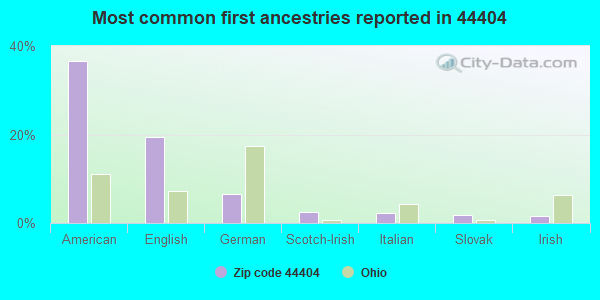
37%American
19%English
7%German
2%Scotch-Irish
2%Italian
2%Slovak
2%Irish
Housing units lacking complete plumbing facilities: 0.6%
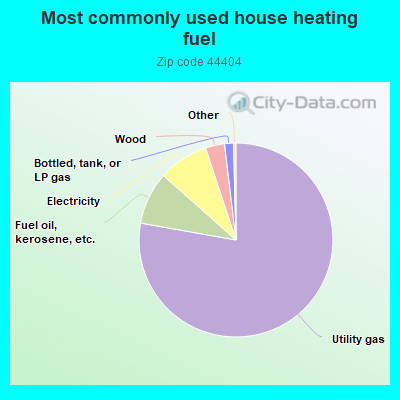
78.2%Utility gas
8.8%Fuel oil, kerosene, etc.
8.4%Electricity
3.2%Wood
1.5%Bottled, tank, or LP gas
Population in 1990: 802. Population change in the 1990s: +901 (+112.3%).
Place of birth for U.S.-born residents:
This state: 575
Northeast: 797
Midwest: 26
South: 77
West: 21
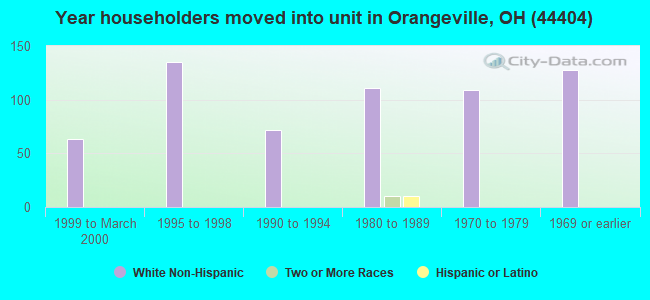
70% of the 44404 zip code residents lived in the same house 5 years ago. Out of people who lived in different houses, 65% lived in this county. Out of people who lived in different counties, 50% lived in Ohio.
95% of the 44404 zip code residents lived in the same house 1 year ago. Out of people who lived in different houses, 39% moved from this county. Out of people who lived in different houses, 9% moved from different county within same state. Out of people who lived in different houses, 61% moved from different state.
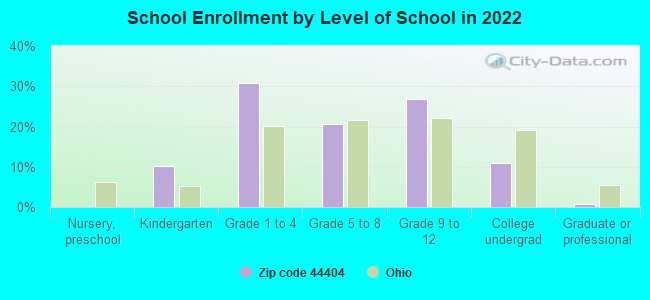
Private vs. public school enrollment:
Students in private schools in grades 1 to 8 (elementary and middle school): 27
Here:
21.4%
Ohio:
16.0%
Students in private schools in grades 9 to 12 (high school):
Here:
0.0%
Ohio:
13.1%
Students in private undergraduate colleges: 12
Here:
44.7%
Ohio:
22.3%
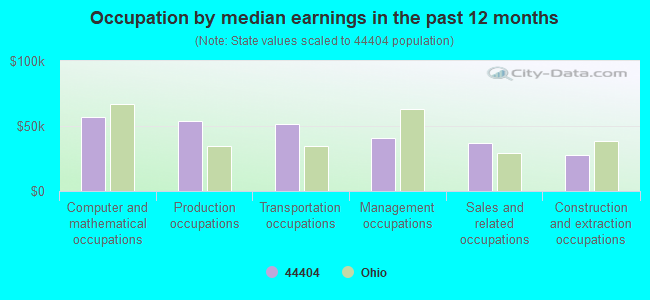
Occupation by median earnings in the past 12 months ($)
56,741Computer and mathematical occupations
53,872Production occupations
51,167Transportation occupations
40,596Management occupations
37,047Sales and related occupations
27,605Construction and extraction occupations
Top industries in this zip code by the number of employees in 2005:
Construction: New Single-Family Housing Construction (except Operative Builders) (5-9 employees: 1 establishment, 1-4 employees: 1 establishment)
Administrative and Support and Waste Management and Remediation Services: Solid Waste Collection (5-9: 1)
Accommodation and Food Services: Drinking Places (Alcoholic Beverages) (1-4: 1)
Construction: Structural Steel and Precast Concrete Contractors (1-4: 1)
Administrative and Support and Waste Management and Remediation Services: Janitorial Services (1-4: 1)
Administrative and Support and Waste Management and Remediation Services: Professional Employer Organizations (1-4: 1)
Information: Data Processing, Hosting, and Related Services (1-4: 1)
Home Mortgage Disclosure Act Aggregated Statistics For Year 2009 (Based on 2 partial tracts)
A) FHA, FSA/RHS & VA Home Purchase Loans
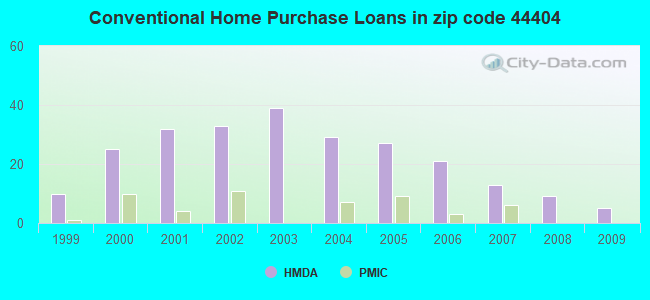
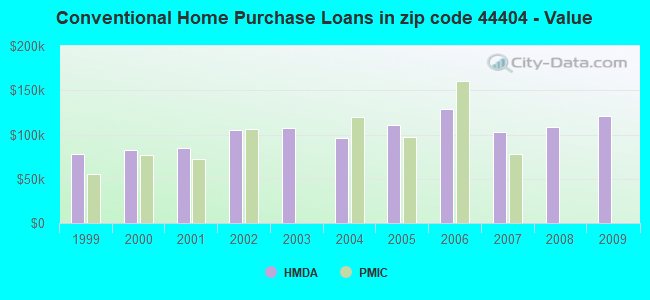
B) Conventional Home Purchase Loans
C) Refinancings
D) Home Improvement Loans
F) Non-occupant Loans on < 5 Family Dwellings (A B C & D)
G) Loans On Manufactured Home Dwelling (A B C & D)
Number
Average Value
Number
Average Value
Number
Average Value
Number
Average Value
Number
Average Value
Number
Average Value
LOANS ORIGINATED
2
$117,500
5
$121,056
42
$111,576
7
$22,429
3
$75,370
1
$57,270
APPLICATIONS APPROVED, NOT ACCEPTED
0
$0
0
$0
6
$81,297
1
$5,920
0
$0
1
$5,920
APPLICATIONS DENIED
1
$53,320
1
$82,940
24
$103,265
5
$26,462
1
$34,560
1
$70,110
APPLICATIONS WITHDRAWN
1
$46,410
2
$43,445
9
$85,356
1
$2,960
0
$0
0
$0
FILES CLOSED FOR INCOMPLETENESS
0
$0
0
$0
2
$173,290
0
$0
0
$0
0
$0
Aggregated Statistics For Year 2008 (Based on 2 partial tracts)
A) FHA, FSA/RHS & VA Home Purchase Loans
B) Conventional Home Purchase Loans
C) Refinancings
D) Home Improvement Loans
F) Non-occupant Loans on < 5 Family Dwellings (A B C & D)
G) Loans On Manufactured Home Dwelling (A B C & D)
Number
Average Value
Number
Average Value
Number
Average Value
Number
Average Value
Number
Average Value
Number
Average Value
LOANS ORIGINATED
2
$64,675
9
$107,956
36
$86,672
3
$245,203
3
$98,740
1
$64,180
APPLICATIONS APPROVED, NOT ACCEPTED
1
$84,920
1
$83,930
7
$77,581
1
$15,800
1
$7,900
0
$0
APPLICATIONS DENIED
0
$0
4
$98,492
35
$105,003
6
$32,748
3
$44,433
4
$71,340
APPLICATIONS WITHDRAWN
1
$140,210
1
$128,360
4
$98,492
1
$15,800
1
$63,190
0
$0
FILES CLOSED FOR INCOMPLETENESS
0
$0
0
$0
0
$0
0
$0
0
$0
0
$0
Aggregated Statistics For Year 2007 (Based on 2 partial tracts)
A) FHA, FSA/RHS & VA Home Purchase Loans
B) Conventional Home Purchase Loans
C) Refinancings
D) Home Improvement Loans
F) Non-occupant Loans on < 5 Family Dwellings (A B C & D)
G) Loans On Manufactured Home Dwelling (A B C & D)
Number
Average Value
Number
Average Value
Number
Average Value
Number
Average Value
Number
Average Value
Number
Average Value
LOANS ORIGINATED
1
$131,320
13
$102,614
41
$78,727
8
$24,439
3
$93,143
0
$0
APPLICATIONS APPROVED, NOT ACCEPTED
0
$0
1
$101,700
5
$27,252
2
$72,080
1
$15,800
0
$0
APPLICATIONS DENIED
0
$0
2
$133,300
21
$109,319
6
$39,002
1
$24,680
2
$24,190
APPLICATIONS WITHDRAWN
1
$76,030
1
$246,850
4
$106,885
1
$39,500
0
$0
0
$0
FILES CLOSED FOR INCOMPLETENESS
1
$116,510
1
$95,780
4
$126,140
0
$0
0
$0
0
$0
Aggregated Statistics For Year 2006 (Based on 2 partial tracts)
A) FHA, FSA/RHS & VA Home Purchase Loans
B) Conventional Home Purchase Loans
C) Refinancings
D) Home Improvement Loans
F) Non-occupant Loans on < 5 Family Dwellings (A B C & D)
G) Loans On Manufactured Home Dwelling (A B C & D)
Number
Average Value
Number
Average Value
Number
Average Value
Number
Average Value
Number
Average Value
Number
Average Value
LOANS ORIGINATED
3
$76,030
21
$128,738
61
$92,330
16
$28,573
3
$103,020
3
$39,167
APPLICATIONS APPROVED, NOT ACCEPTED
0
$0
1
$271,530
14
$74,901
2
$14,810
1
$49,370
0
$0
APPLICATIONS DENIED
0
$0
2
$120,955
36
$101,592
8
$12,836
0
$0
1
$31,600
APPLICATIONS WITHDRAWN
0
$0
0
$0
21
$98,599
3
$47,397
2
$67,145
0
$0
FILES CLOSED FOR INCOMPLETENESS
0
$0
0
$0
4
$93,555
0
$0
0
$0
0
$0
Aggregated Statistics For Year 2005 (Based on 2 partial tracts)
A) FHA, FSA/RHS & VA Home Purchase Loans
B) Conventional Home Purchase Loans
C) Refinancings
D) Home Improvement Loans
F) Non-occupant Loans on < 5 Family Dwellings (A B C & D)
G) Loans On Manufactured Home Dwelling (A B C & D)
Number
Average Value
Number
Average Value
Number
Average Value
Number
Average Value
Number
Average Value
Number
Average Value
LOANS ORIGINATED
0
$0
27
$110,845
62
$86,382
22
$45,914
5
$131,916
3
$133,627
APPLICATIONS APPROVED, NOT ACCEPTED
1
$90,840
1
$124,410
15
$90,380
1
$44,430
0
$0
0
$0
APPLICATIONS DENIED
1
$49,370
7
$100,714
47
$100,610
8
$42,829
2
$33,570
8
$89,112
APPLICATIONS WITHDRAWN
0
$0
4
$61,220
34
$110,705
4
$138,978
1
$63,190
1
$204,390
FILES CLOSED FOR INCOMPLETENESS
0
$0
0
$0
6
$159,137
0
$0
0
$0
0
$0
Aggregated Statistics For Year 2004 (Based on 2 partial tracts)
A) FHA, FSA/RHS & VA Home Purchase Loans
B) Conventional Home Purchase Loans
C) Refinancings
D) Home Improvement Loans
F) Non-occupant Loans on < 5 Family Dwellings (A B C & D)
G) Loans On Manufactured Home Dwelling (A B C & D)
Number
Average Value
Number
Average Value
Number
Average Value
Number
Average Value
Number
Average Value
Number
Average Value
LOANS ORIGINATED
2
$75,040
29
$95,506
53
$89,909
20
$43,594
1
$24,680
3
$83,600
APPLICATIONS APPROVED, NOT ACCEPTED
0
$0
7
$76,171
18
$126,936
2
$48,875
0
$0
2
$88,865
APPLICATIONS DENIED
0
$0
7
$65,874
43
$88,200
7
$30,750
2
$83,930
5
$107,824
APPLICATIONS WITHDRAWN
0
$0
2
$65,170
25
$107,350
1
$9,870
0
$0
0
$0
FILES CLOSED FOR INCOMPLETENESS
0
$0
0
$0
10
$90,841
1
$122,440
0
$0
0
$0
Aggregated Statistics For Year 2003 (Based on 2 partial tracts)
B) Conventional Home Purchase Loans
C) Refinancings
D) Home Improvement Loans
F) Non-occupant Loans on < 5 Family Dwellings (A B C & D)
Number
Average Value
Number
Average Value
Number
Average Value
Number
Average Value
LOANS ORIGINATED
39
$106,943
140
$89,268
17
$26,892
4
$56,775
APPLICATIONS APPROVED, NOT ACCEPTED
2
$121,450
22
$97,259
2
$61,220
0
$0
APPLICATIONS DENIED
5
$89,854
49
$93,501
3
$11,850
1
$31,600
APPLICATIONS WITHDRAWN
10
$84,028
33
$88,507
0
$0
2
$47,890
FILES CLOSED FOR INCOMPLETENESS
2
$177,730
8
$117,624
0
$0
0
$0
Aggregated Statistics For Year 2002 (Based on 2 partial tracts)
A) FHA, FSA/RHS & VA Home Purchase Loans
B) Conventional Home Purchase Loans
C) Refinancings
D) Home Improvement Loans
F) Non-occupant Loans on < 5 Family Dwellings (A B C & D)
Number
Average Value
Number
Average Value
Number
Average Value
Number
Average Value
Number
Average Value
LOANS ORIGINATED
2
$105,160
33
$105,053
99
$84,717
13
$27,039
4
$49,370
APPLICATIONS APPROVED, NOT ACCEPTED
1
$53,320
4
$172,795
16
$74,240
3
$10,533
0
$0
APPLICATIONS DENIED
1
$120,460
4
$35,548
42
$78,992
6
$18,432
1
$20,740
APPLICATIONS WITHDRAWN
0
$0
3
$138,893
19
$94,427
1
$34,560
0
$0
FILES CLOSED FOR INCOMPLETENESS
0
$0
0
$0
5
$86,102
0
$0
0
$0
Aggregated Statistics For Year 2001 (Based on 2 partial tracts)
A) FHA, FSA/RHS & VA Home Purchase Loans
B) Conventional Home Purchase Loans
C) Refinancings
D) Home Improvement Loans
F) Non-occupant Loans on < 5 Family Dwellings (A B C & D)
Number
Average Value
Number
Average Value
Number
Average Value
Number
Average Value
Number
Average Value
LOANS ORIGINATED
5
$60,034
32
$84,423
69
$84,086
18
$14,866
5
$64,576
APPLICATIONS APPROVED, NOT ACCEPTED
0
$0
2
$84,915
18
$73,507
2
$22,710
0
$0
APPLICATIONS DENIED
0
$0
14
$49,299
27
$69,264
8
$18,760
2
$55,790
APPLICATIONS WITHDRAWN
0
$0
5
$39,102
25
$90,248
3
$53,650
2
$61,715
FILES CLOSED FOR INCOMPLETENESS
0
$0
1
$49,370
2
$108,615
0
$0
0
$0
Aggregated Statistics For Year 2000 (Based on 2 partial tracts)
A) FHA, FSA/RHS & VA Home Purchase Loans
B) Conventional Home Purchase Loans
C) Refinancings
D) Home Improvement Loans
F) Non-occupant Loans on < 5 Family Dwellings (A B C & D)
Number
Average Value
Number
Average Value
Number
Average Value
Number
Average Value
Number
Average Value
LOANS ORIGINATED
1
$90,840
25
$82,626
28
$68,942
17
$22,245
2
$54,800
APPLICATIONS APPROVED, NOT ACCEPTED
0
$0
1
$104,660
12
$67,883
2
$56,775
0
$0
APPLICATIONS DENIED
0
$0
2
$62,205
36
$70,462
5
$15,008
1
$59,240
APPLICATIONS WITHDRAWN
0
$0
3
$68,460
15
$65,497
3
$40,153
1
$37,520
FILES CLOSED FOR INCOMPLETENESS
0
$0
0
$0
5
$71,882
1
$9,870
0
$0
Aggregated Statistics For Year 1999 (Based on 1 partial tract)
B) Conventional Home Purchase Loans
C) Refinancings
D) Home Improvement Loans
F) Non-occupant Loans on < 5 Family Dwellings (A B C & D)
Detailed PMIC statistics for the following Tracts:9301.02
2002 - 2018 National Fire Incident Reporting System (NFIRS) incidents
According to the data from the years 2002 - 2018 the average number of fires per year is 7. The highest number of reported fire incidents - 16 took place in 2006, and the least - 2 in 2004. The data has a decreasing trend.
When looking into fire subcategories, the most reports belonged to: Structure Fires (68.7%), and Outside Fires (19.1%).
Fire incident types reported to NFIRS in Zip Code 44404


 Nearest zip codes: 44418, 44403, 44438, 16146, 16150, 44428.
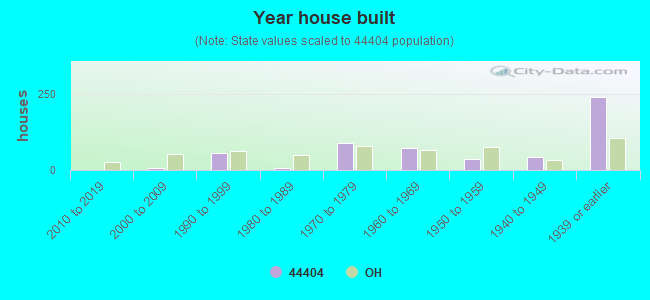


 According to the data from the years 2002 - 2018 the average number of fires per year is 7. The highest number of reported fire incidents - 16 took place in 2006, and the least - 2 in 2004. The data has a decreasing trend.
 When looking into fire subcategories, the most reports belonged to: Structure Fires (68.7%), and Outside Fires (19.1%).