Estimated zip code population in 2022: 4,773 Zip code population in 2010: 4,874 Zip code population in 2000: 5,320
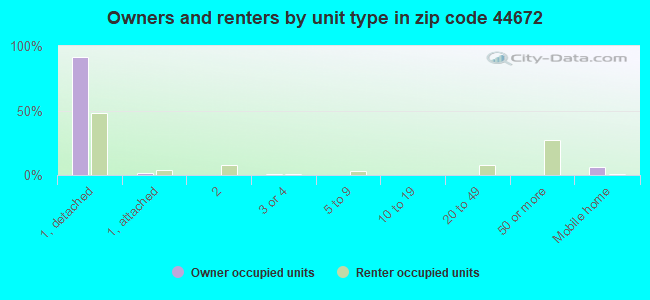
Houses and condos: 2,658 Renter-occupied apartments: 1,079
% of renters here:
47%
State:
33%
March 2022 cost of living index in zip code 44672: 90.1 (less than average, U.S. average is 100)
Land area: 3.3 sq. mi. Water area: 0.0 sq. mi.
Population density: 1,459 people per square mile
(low).
OSM Map
General Map
Google Map
MSN Map
OSM Map
General Map
Google Map
MSN Map
OSM Map
General Map
Google Map
MSN Map
OSM Map
General Map
Google Map
MSN Map
Please wait while loading the map...
Real estate property taxes paid for housing units in 2022:
This zip code:
1.1% ($1,026)
Ohio:
1.3% ($2,639)
Median real estate property taxes paid for housing units with mortgages in 2022: $1,007 (1.1%) Median real estate property taxes paid for housing units with no mortgage in 2022: $1,088 (0.8%)
Business Search- 14 Million verified businesses
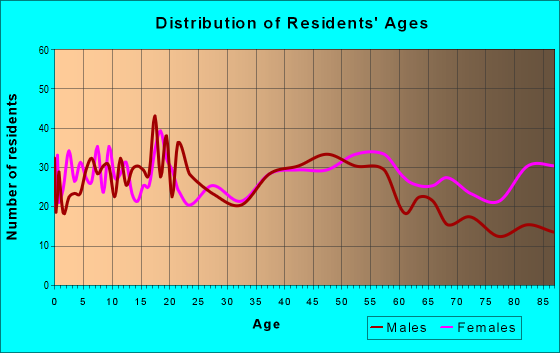
Males: 2,381
(49.9%)
Females: 2,392
(50.1%)
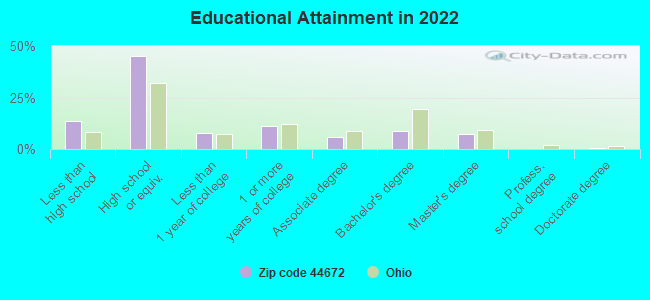
For population 25 years and over in 44672:
High school or higher: 85.0%
Bachelor's degree or higher: 16.6%
Graduate or professional degree: 7.8%
Unemployed: 7.4%
Mean travel time to work (commute): 26.7 minutes
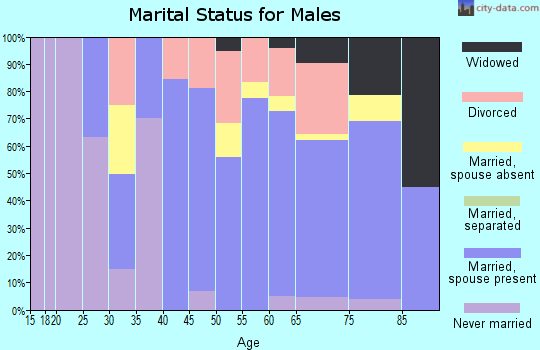
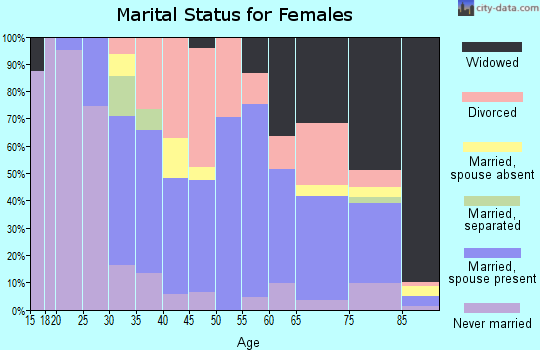
For population 15 years and over in 44672:
Never married: 26.1%
Now married: 46.9%
Separated: 2.0%
Widowed: 12.7%
Divorced: 12.3%
Zip code 44672 compared to state average:
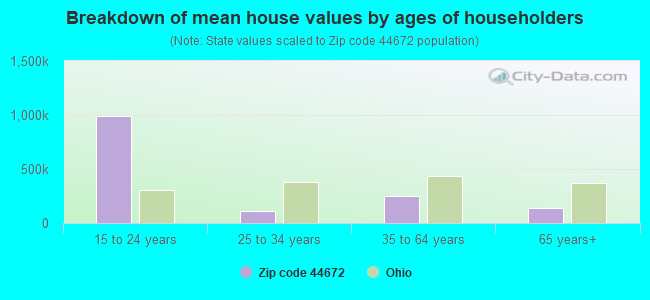
Median house value below state average.
Unemployed percentage above state average.
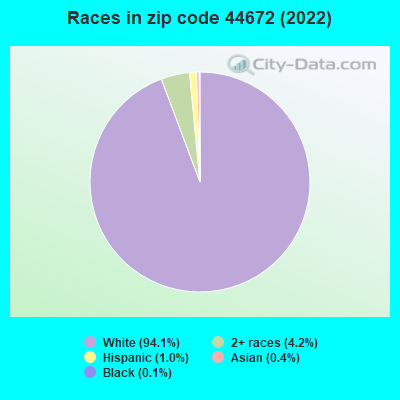
Black race population percentage significantly below state average.
Hispanic race population percentage significantly below state average.
Median age significantly above state average.
Foreign-born population percentage significantly below state average.
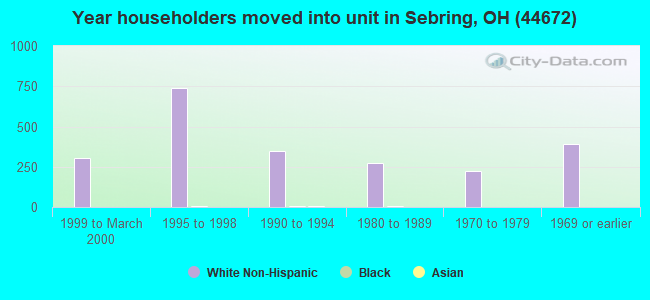
Length of stay since moving in significantly above state average.
Number of rooms per house below state average.
Number of college students below state average.
Percentage of population with a bachelor's degree or higher below state average.
Averages for the 2020 tax year for zip code 44672, filed in 2021:
Average Adjusted Gross Income (AGI) in 2020: $40,208 (Individual Income Tax Returns)
Here:
$40,208
State:
$67,288
Salary/wage: $35,586 (reported on 75.0% of returns)
Here:
$35,586
State:
$55,628
(% of AGI for various income ranges: 1065.8% for AGIs below $25k, 3226.6% for AGIs $25k-50k, 5603.3% for AGIs $50k-75k, 7825.5% for AGIs $75k-100k, 12991.4% for AGIs $100k-200k)
Taxable interest for individuals: $877 (reported on 20.3% of returns)
This zip code:
$877
Ohio:
$1,518
(% of AGI for various income ranges: 9.5% for AGIs below $25k, 19.5% for AGIs $25k-50k, 20.4% for AGIs $50k-75k, 99.1% for AGIs $75k-100k, 67.1% for AGIs $100k-200k)
Ordinary dividends: $4,000 (reported on 16.0% of returns)
Here:
$4,000
State:
$7,167
(% of AGI for various income ranges: 38.8% for AGIs below $25k, 50.0% for AGIs $25k-50k, 142.1% for AGIs $50k-75k, 251.8% for AGIs $75k-100k, 305.7% for AGIs $100k-200k)
Net capital gain/loss in AGI: +$4,823 (reported on 14.2% of returns)
Here:
+$4,823
State:
+$18,919
(% of AGI for various income ranges: 14.2% for AGIs below $25k, 20.5% for AGIs $25k-50k, 99.6% for AGIs $50k-75k, 267.3% for AGIs $75k-100k, 1011.4% for AGIs $100k-200k)
Profit/loss from business: +$5,950 (reported on 8.5% of returns)
Here:
+$5,950
State:
+$13,744
(% of AGI for various income ranges: 70.2% for AGIs below $25k, 38.0% for AGIs $25k-50k, 114.2% for AGIs $50k-75k, 138.2% for AGIs $75k-100k)
Taxable individual retirement arrangement distribution: $12,286 (reported on 13.2% of returns)
44672:
$12,286
Ohio:
$18,876
(% of AGI for various income ranges: 75.2% for AGIs below $25k, 115.4% for AGIs $25k-50k, 322.1% for AGIs $50k-75k, 495.5% for AGIs $75k-100k, 1414.3% for AGIs $100k-200k)
Total itemized deductions: $48,700 (reported on 1.4% of returns)
Here:
$48,700
State:
$33,869
(% of AGI for various income ranges: 247.6% for AGIs $25k-50k)
Taxes paid: $2,567 (reported on 1.4% of returns)
44672:
$2,567
State:
$7,681
(% of AGI for various income ranges: 13.1% for AGIs $25k-50k)
Earned income credit: $2,235 (reported on 17.5% of returns)
Here:
$2,235
State:
$2,304
(% of AGI for various income ranges: 83.8% for AGIs below $25k, 54.9% for AGIs $25k-50k)
Percentage of individuals using paid preparers for their 2020 taxes: 95.3%
Here:
95%
State:
94%
(% for various income ranges: 93.8% for AGIs below $25k, 97.2% for AGIs $25k-50k, 90.9% for AGIs $50k-75k, 100.0% for AGIs $75k-100k, 100.0% for AGIs $100k-200k)
Averages for the 2012 tax year for zip code 44672, filed in 2013:
Average Adjusted Gross Income (AGI) in 2012: $35,011 (Individual Income Tax Returns)
Here:
$35,011
State:
$54,926
Salary/wage: $30,211 (reported on 74.4% of returns)
Here:
$30,211
State:
$45,869
(% of AGI for various income ranges: 67.0% for AGIs below $25k, 71.5% for AGIs $25k-50k, 66.4% for AGIs $50k-75k, 56.8% for AGIs $75k-100k, 48.9% for AGIs $100k-200k)
Taxable interest for individuals: $1,412 (reported on 26.9% of returns)
This zip code:
$1,412
Ohio:
$1,297
(% of AGI for various income ranges: 1.3% for AGIs below $25k, 0.8% for AGIs $25k-50k, 1.3% for AGIs $50k-75k, 1.0% for AGIs $75k-100k, 1.1% for AGIs $100k-200k)
Ordinary dividends: $5,569 (reported on 19.2% of returns)
Here:
$5,569
State:
$5,821
(% of AGI for various income ranges: 2.5% for AGIs below $25k, 2.5% for AGIs $25k-50k, 2.5% for AGIs $50k-75k, 4.5% for AGIs $75k-100k, 4.5% for AGIs $100k-200k)
Net capital gain/loss in AGI: +$2,461 (reported on 15.1% of returns)
Here:
+$2,461
State:
+$11,232
(% of AGI for various income ranges: 0.1% for AGIs below $25k, 0.4% for AGIs $25k-50k, 1.4% for AGIs $50k-75k, 1.7% for AGIs $75k-100k, 2.3% for AGIs $100k-200k)
Profit/loss from business: +$5,385 (reported on 9.1% of returns)
Here:
+$5,385
State:
+$12,773
(% of AGI for various income ranges: 3.7% for AGIs below $25k, 1.3% for AGIs $25k-50k, 1.6% for AGIs $50k-75k)
Taxable individual retirement arrangement distribution: $9,787 (reported on 14.2% of returns)
44672:
$9,787
Ohio:
$14,511
(% of AGI for various income ranges: 5.1% for AGIs below $25k, 3.3% for AGIs $25k-50k, 2.9% for AGIs $50k-75k, 4.1% for AGIs $75k-100k, 5.8% for AGIs $100k-200k)
Total itemized deductions: $18,744 (28% of AGI, reported on 14.6% of returns)
Here:
$18,744
State:
$21,278
Here:
27.6% of AGI
State:
18.8% of AGI
(% of AGI for various income ranges: 7.7% for AGIs below $25k, 5.3% for AGIs $25k-50k, 7.5% for AGIs $50k-75k, 10.6% for AGIs $75k-100k, 11.2% for AGIs $100k-200k)
Charity contributions: $4,452 (reported on 10.5% of returns)
Here:
$4,452
State:
$3,943
(% of AGI for various income ranges: 0.8% for AGIs below $25k, 0.8% for AGIs $25k-50k, 1.1% for AGIs $50k-75k, 2.9% for AGIs $75k-100k, 1.9% for AGIs $100k-200k)
Taxes paid: $4,713 (reported on 14.2% of returns)
44672:
$4,713
State:
$9,568
(% of AGI for various income ranges: 0.7% for AGIs below $25k, 1.0% for AGIs $25k-50k, 1.5% for AGIs $50k-75k, 3.3% for AGIs $75k-100k, 4.5% for AGIs $100k-200k)
Earned income credit: $2,156 (reported on 20.5% of returns)
Here:
$2,156
State:
$2,285
(% of AGI for various income ranges: 5.4% for AGIs below $25k, 1.1% for AGIs $25k-50k)
Percentage of individuals using paid preparers for their 2012 taxes: 55.3%
Here:
55%
State:
51%
(% for various income ranges: 49.0% for AGIs below $25k, 58.8% for AGIs $25k-50k, 60.7% for AGIs $50k-75k, 69.2% for AGIs $75k-100k, 62.5% for AGIs $100k-200k)
Averages for the 2004 tax year for zip code 44672, filed in 2005:
Average Adjusted Gross Income (AGI) in 2004: $29,698 (Individual Income Tax Returns)
Here:
$29,698
State:
$44,480
Salary/wage: $27,619 (reported on 77.4% of returns)
Here:
$27,619
State:
$39,198
(% of AGI for various income ranges: 80.2% for AGIs below $10k, 72.0% for AGIs $10k-25k, 71.9% for AGIs $25k-50k, 76.9% for AGIs $50k-75k, 79.2% for AGIs $75k-100k, 49.4% for AGIs over 100k)
Taxable interest for individuals: $1,786 (reported on 38.1% of returns)
This zip code:
$1,786
Ohio:
$1,532
(% of AGI for various income ranges: 7.8% for AGIs below $10k, 2.8% for AGIs $10k-25k, 2.5% for AGIs $25k-50k, 1.3% for AGIs $50k-75k, 1.4% for AGIs $75k-100k, 2.2% for AGIs over 100k)
Taxable dividends: $3,194 (reported on 22.3% of returns)
Here:
$3,194
State:
$3,496
(% of AGI for various income ranges: 5.1% for AGIs below $10k, 2.4% for AGIs $10k-25k, 2.3% for AGIs $25k-50k, 2.1% for AGIs $50k-75k, 1.4% for AGIs $75k-100k, 3.8% for AGIs over 100k)
Net capital gain/loss: +$2,649 (reported on 17.2% of returns)
Here:
+$2,649
State:
+$8,582
(% of AGI for various income ranges: -0.9% for AGIs below $10k, 0.5% for AGIs $10k-25k, 0.8% for AGIs $25k-50k, 1.1% for AGIs $50k-75k, 2.0% for AGIs $75k-100k, 7.8% for AGIs over 100k)
Profit/loss from business: +$4,824 (reported on 7.7% of returns)
Here:
+$4,824
State:
+$10,813
(% of AGI for various income ranges: -4.4% for AGIs below $10k, 2.4% for AGIs $10k-25k, 1.2% for AGIs $25k-50k, 1.8% for AGIs $50k-75k, 0.9% for AGIs $75k-100k)
IRA payment deduction: $1,606 (reported on 1.4% of returns)
44672:
$1,606
Ohio:
$2,794
Total itemized deductions: $14,616 (26% of AGI, reported on 16.9% of returns)
Here:
$14,616
State:
$17,503
Here:
26.5% of AGI
State:
20.8% of AGI
(% of AGI for various income ranges: 12.7% for AGIs below $10k, 6.7% for AGIs $10k-25k, 6.6% for AGIs $25k-50k, 7.8% for AGIs $50k-75k, 12.6% for AGIs $75k-100k, 13.4% for AGIs over 100k)
Charity contributions deductions: $3,093 (5% of AGI, reported on 13.2% of returns)
Here:
$3,093
State:
$3,087
Here:
5.3% of AGI
State:
3.4% of AGI
(% of AGI for various income ranges: 0.7% for AGIs below $10k, 0.7% for AGIs $10k-25k, 1.1% for AGIs $25k-50k, 1.1% for AGIs $50k-75k, 1.7% for AGIs $75k-100k, 4.5% for AGIs over 100k)
Total tax: $3,087 (reported on 70.7% of returns)
44672:
$3,087
State:
$6,781
(% of AGI for various income ranges: 1.6% for AGIs below $10k, 3.7% for AGIs $10k-25k, 6.2% for AGIs $25k-50k, 8.2% for AGIs $50k-75k, 10.8% for AGIs $75k-100k, 14.8% for AGIs over 100k)
Earned income credit: $1,682 (reported on 17.6% of returns)
Here:
$1,682
State:
$1,696
Percentage of individuals using paid preparers for their 2004 taxes: 54.2%
Here:
54%
State:
55%
(% for various income ranges: 46.0% for AGIs below $10k, 54.1% for AGIs $10k-25k, 58.8% for AGIs $25k-50k, 55.5% for AGIs $50k-75k, 53.2% for AGIs $75k-100k, 71.4% for AGIs over 100k)
Household received Food Stamps/SNAP in the past 12 months: 256 Household did not receive Food Stamps/SNAP in the past 12 months: 2,032
Women who had a birth in the past 12 months: 33 (0 now married, 32 unmarried) Women who did not have a birth in the past 12 months: 638 (338 now married, 299 unmarried)
Housing units in zip code 44672 with a mortgage: 708 (59 second mortgage, 46 both second mortgage and home equity loan) Houses without a mortgage: 31
Median monthly owner costs for units with a mortgage: $830 Median monthly owner costs for units without a mortgage: $430
Residents with income below the poverty level in 2022:
This zip code:
15.9%
Whole state:
13.4%
Residents with income below 50% of the poverty level in 2022:
This zip code:
11.9%
Whole state:
7.0%
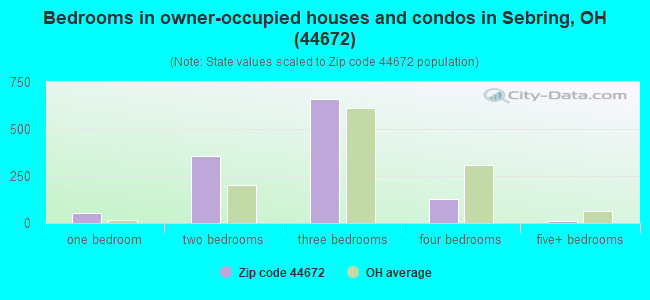
Median number of rooms in houses and condos:
Here:
6.0
State:
6.7
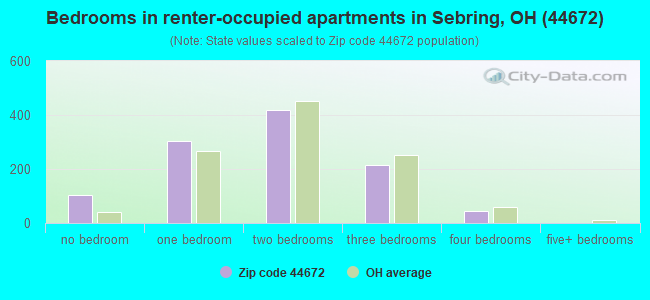
Median number of rooms in apartments:
Here:
4.2
State:
4.4
Notable locations in this zip code not listed on our city pages
Churches in zip code 44672 include: Church of Christ (A), Saint Anns Church (B), Sebring Church of the Nazarene (C), Sebring Friends Church (D), Sebring Presbyterian Church (E), Sebring United Methodist Church (F). Display/hide their locations on the map
228 married couples with children.
254 single-parent households (121 men, 133 women).
97.8% of residents of 44672 zip code speak English at home.
2.0% of residents speak Spanish at home (51% very well, 10% well, 39% not well).
0.8% of residents speak other Indo-European language at home (94% very well, 6% not at all).
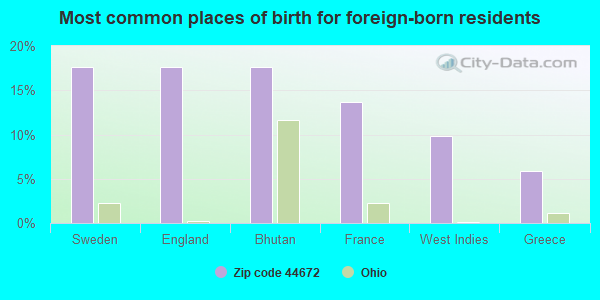
Foreign born population: 50 (1.1%) (34.4% of them are naturalized citizens)
This zip code:
1.1%
Whole state:
5.0%
18%Sweden
18%England
18%Bhutan
14%France
10%West Indies
6%Greece
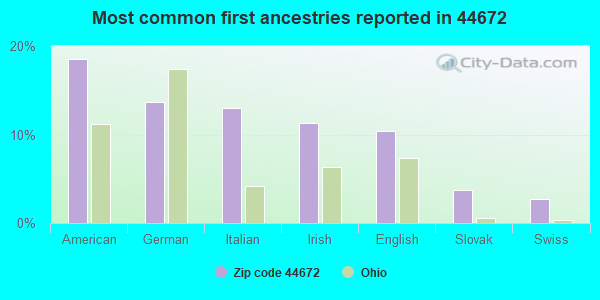
19%American
14%German
13%Italian
11%Irish
10%English
4%Slovak
3%Swiss
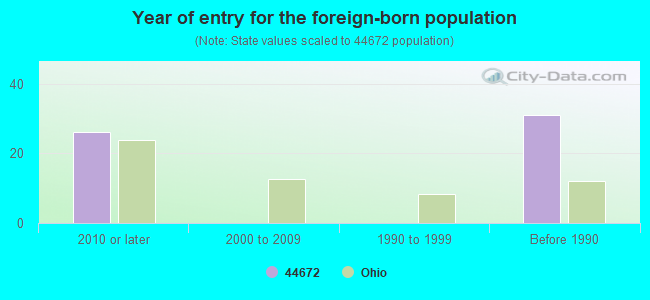
Year of entry for the foreign-born population
262010 or later
02000 to 2009
01990 to 1999
31Before 1990
Facilities with environmental interests located in this zip code:
B L MILLER ELEMENTARY SCHOOL (506 W VIRGINIA AVE in SEBRING, OH)
(National Center for Education Statistics) - STATE ID-024836 Organizations: SEBRING LOCAL SD (SCHOOL DISTRICT)
ASHLAND BRANDED MARKETING NO 612-062 (195 E OHIO ST in SEBRING, OH)
Housing units lacking complete plumbing facilities: 0.3% Housing units lacking complete kitchen facilities: 2.9%
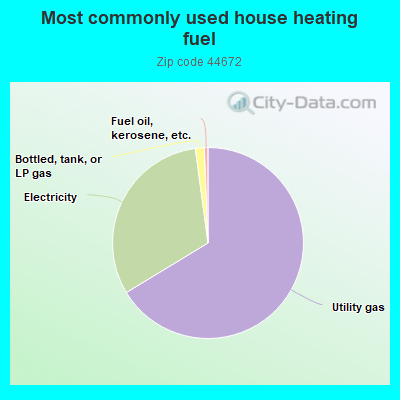
66.2%Utility gas
31.5%Electricity
1.5%Bottled, tank, or LP gas
0.6%Fuel oil, kerosene, etc.
Population in 1990: 6,276.
Place of birth for U.S.-born residents:
This state: 3,708
Northeast: 427
Midwest: 125
South: 361
West: 89
59% of the 44672 zip code residents lived in the same house 5 years ago. Out of people who lived in different houses, 53% lived in this county. Out of people who lived in different counties, 50% lived in Ohio.
85% of the 44672 zip code residents lived in the same house 1 year ago. Out of people who lived in different houses, 44% moved from this county. Out of people who lived in different houses, 33% moved from different county within same state. Out of people who lived in different houses, 22% moved from different state.
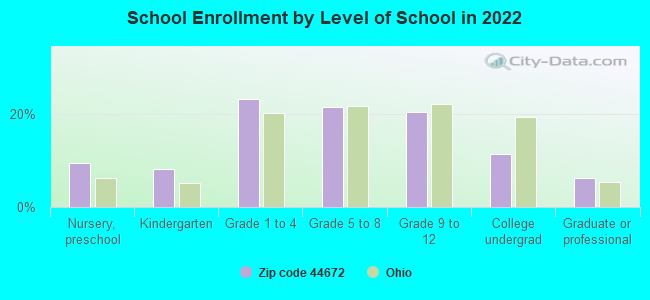
Private vs. public school enrollment:
Students in private schools in grades 1 to 8 (elementary and middle school): 30
Here:
9.1%
Ohio:
16.0%
Students in private schools in grades 9 to 12 (high school): 16
Here:
10.7%
Ohio:
13.1%
Students in private undergraduate colleges: 17
Here:
20.6%
Ohio:
22.3%
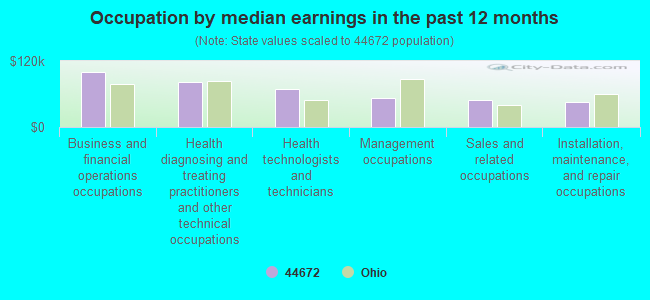
Occupation by median earnings in the past 12 months ($)
100,204Business and financial operations occupations
81,213Health diagnosing and treating practitioners and other technical occupations
69,655Health technologists and technicians
52,587Management occupations
49,103Sales and related occupations
46,148Installation, maintenance, and repair occupations
Companies with federal contracts located in this zip code:
SALEM-REPUBLIC RUBBER CO (475 W CALIFORNIA AVE in SEBRING, OH; small business) : $222,790 in 5 contractsfrom 2000 to 2004
Contracts for Hose and Flexible Tubing, Pipe, Tube and Rigid Tubing, Miscellaneous Ship and Marine Equipment by Defense Logistics Agency, U.S. Army Corps of Engineers - civil program financing only Signed by year:2000: $46,125; 2001: $0; 2002: $0; 2003: $59,089; 2004: $117,576; 2005: $0; 2006: $0.
Biggest contracts:
$90,312 with Defense Logistics Agency for Hose and Flexible Tubing. Signed on 2004-10-19. Completion date: 2005-01-19.
$46,125 with U.S. Army Corps of Engineers - civil program financing only for Pipe, Tube and Rigid Tubing. Signed on 2000-06-01. Completion date: 2000-10-05.
$30,690 with Defense Logistics Agency for Hose and Flexible Tubing. Signed on 2003-12-03. Completion date: 2004-05-01.
$28,399 with U.S. Army Corps of Engineers - civil program financing only for Miscellaneous Ship and Marine Equipment. Signed on 2003-08-14. Completion date: 2003-09-17.
Top industries in this zip code by the number of employees in 2005:
Health Care and Social Assistance: Nursing Care Facilities (250-499 employees: 1 establishment, 1-4 employees: 1 establishment)
Health Care and Social Assistance: Continuing Care Retirement Communities (100-249: 1)
People in group quarters in 2010:
185 people in nursing facilities/skilled-nursing facilities
People in group quarters in 2000:
216 people in nursing homes
Home Mortgage Disclosure Act Aggregated Statistics For Year 2009 (Based on 2 partial tracts)
A) FHA, FSA/RHS & VA Home Purchase Loans
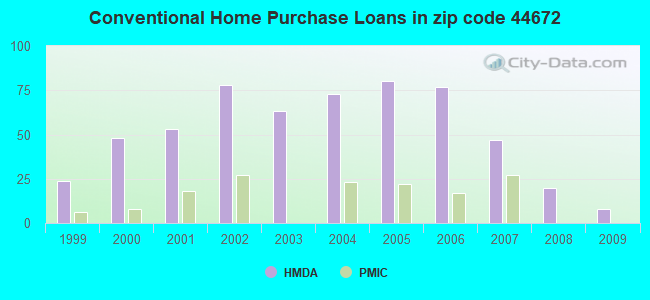
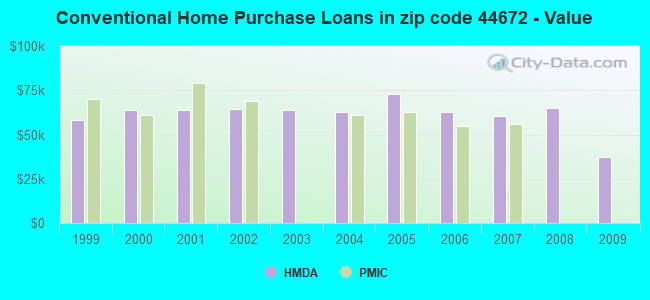
B) Conventional Home Purchase Loans
C) Refinancings
D) Home Improvement Loans
E) Loans on Dwellings For 5+ Families
F) Non-occupant Loans on < 5 Family Dwellings (A B C & D)
G) Loans On Manufactured Home Dwelling (A B C & D)
Number
Average Value
Number
Average Value
Number
Average Value
Number
Average Value
Number
Average Value
Number
Average Value
Number
Average Value
LOANS ORIGINATED
18
$81,984
8
$37,060
48
$90,463
2
$2,500
2
$596,285
8
$39,141
3
$62,737
APPLICATIONS APPROVED, NOT ACCEPTED
2
$27,480
0
$0
8
$92,025
2
$6,660
0
$0
0
$0
0
$0
APPLICATIONS DENIED
0
$0
2
$30,815
35
$69,955
8
$12,909
0
$0
3
$22,763
2
$30,815
APPLICATIONS WITHDRAWN
2
$37,475
0
$0
23
$88,784
3
$39,973
0
$0
0
$0
0
$0
FILES CLOSED FOR INCOMPLETENESS
2
$43,305
0
$0
3
$62,183
0
$0
0
$0
0
$0
2
$43,305
Aggregated Statistics For Year 2008 (Based on 2 partial tracts)
A) FHA, FSA/RHS & VA Home Purchase Loans
B) Conventional Home Purchase Loans
C) Refinancings
D) Home Improvement Loans
F) Non-occupant Loans on < 5 Family Dwellings (A B C & D)
G) Loans On Manufactured Home Dwelling (A B C & D)
Number
Average Value
Number
Average Value
Number
Average Value
Number
Average Value
Number
Average Value
Number
Average Value
LOANS ORIGINATED
28
$77,926
20
$65,042
60
$175,998
10
$5,996
5
$1,204,562
5
$60,628
APPLICATIONS APPROVED, NOT ACCEPTED
3
$34,423
5
$61,628
15
$81,059
0
$0
0
$0
2
$53,300
APPLICATIONS DENIED
8
$80,574
10
$49,968
88
$85,930
18
$16,471
10
$58,463
2
$10,825
APPLICATIONS WITHDRAWN
2
$45,805
3
$46,637
12
$89,665
2
$12,490
0
$0
0
$0
FILES CLOSED FOR INCOMPLETENESS
2
$51,635
0
$0
7
$86,136
2
$58,295
0
$0
0
$0
Aggregated Statistics For Year 2007 (Based on 2 partial tracts)
A) FHA, FSA/RHS & VA Home Purchase Loans
B) Conventional Home Purchase Loans
C) Refinancings
D) Home Improvement Loans
F) Non-occupant Loans on < 5 Family Dwellings (A B C & D)
G) Loans On Manufactured Home Dwelling (A B C & D)
Number
Average Value
Number
Average Value
Number
Average Value
Number
Average Value
Number
Average Value
Number
Average Value
LOANS ORIGINATED
12
$73,564
47
$60,245
92
$66,316
18
$25,169
17
$51,144
2
$77,450
APPLICATIONS APPROVED, NOT ACCEPTED
0
$0
8
$55,172
20
$71,538
2
$29,150
2
$56,630
2
$30,815
APPLICATIONS DENIED
5
$61,294
28
$58,118
150
$78,605
43
$44,506
12
$62,182
3
$38,863
APPLICATIONS WITHDRAWN
2
$99,935
8
$60,795
33
$86,157
5
$28,316
0
$0
0
$0
FILES CLOSED FOR INCOMPLETENESS
0
$0
7
$66,149
8
$92,232
2
$37,475
0
$0
0
$0
Aggregated Statistics For Year 2006 (Based on 2 partial tracts)
A) FHA, FSA/RHS & VA Home Purchase Loans
B) Conventional Home Purchase Loans
C) Refinancings
D) Home Improvement Loans
E) Loans on Dwellings For 5+ Families
F) Non-occupant Loans on < 5 Family Dwellings (A B C & D)
G) Loans On Manufactured Home Dwelling (A B C & D)
Number
Average Value
Number
Average Value
Number
Average Value
Number
Average Value
Number
Average Value
Number
Average Value
Number
Average Value
LOANS ORIGINATED
7
$79,473
77
$62,687
138
$64,005
28
$31,290
0
$0
18
$54,317
2
$56,630
APPLICATIONS APPROVED, NOT ACCEPTED
0
$0
22
$64,277
33
$57,539
13
$31,518
0
$0
3
$61,073
0
$0
APPLICATIONS DENIED
0
$0
65
$52,659
192
$139,416
55
$37,855
0
$0
3
$66,070
2
$55,800
APPLICATIONS WITHDRAWN
2
$53,300
28
$54,132
110
$81,887
10
$50,634
2
$69,120
10
$36,144
0
$0
FILES CLOSED FOR INCOMPLETENESS
0
$0
7
$61,389
22
$81,387
2
$30,815
0
$0
0
$0
0
$0
Aggregated Statistics For Year 2005 (Based on 2 partial tracts)
A) FHA, FSA/RHS & VA Home Purchase Loans
B) Conventional Home Purchase Loans
C) Refinancings
D) Home Improvement Loans
E) Loans on Dwellings For 5+ Families
F) Non-occupant Loans on < 5 Family Dwellings (A B C & D)
G) Loans On Manufactured Home Dwelling (A B C & D)
Number
Average Value
Number
Average Value
Number
Average Value
Number
Average Value
Number
Average Value
Number
Average Value
Number
Average Value
LOANS ORIGINATED
8
$67,249
80
$73,099
167
$67,372
28
$34,859
2
$76,620
23
$56,123
2
$47,470
APPLICATIONS APPROVED, NOT ACCEPTED
2
$78,285
22
$59,129
70
$74,690
2
$18,320
0
$0
8
$58,296
7
$58,534
APPLICATIONS DENIED
0
$0
30
$53,299
150
$74,919
23
$41,640
0
$0
8
$42,889
7
$32,360
APPLICATIONS WITHDRAWN
0
$0
18
$73,287
82
$90,430
18
$98,548
0
$0
10
$90,609
0
$0
FILES CLOSED FOR INCOMPLETENESS
0
$0
2
$64,125
30
$87,777
0
$0
0
$0
0
$0
0
$0
Aggregated Statistics For Year 2004 (Based on 2 partial tracts)
A) FHA, FSA/RHS & VA Home Purchase Loans
B) Conventional Home Purchase Loans
C) Refinancings
D) Home Improvement Loans
F) Non-occupant Loans on < 5 Family Dwellings (A B C & D)
G) Loans On Manufactured Home Dwelling (A B C & D)
Number
Average Value
Number
Average Value
Number
Average Value
Number
Average Value
Number
Average Value
Number
Average Value
LOANS ORIGINATED
5
$77,950
73
$62,745
167
$64,988
23
$38,381
28
$47,113
0
$0
APPLICATIONS APPROVED, NOT ACCEPTED
0
$0
23
$53,951
48
$82,725
3
$29,980
2
$12,490
0
$0
APPLICATIONS DENIED
3
$61,627
33
$59,558
182
$75,922
62
$30,142
8
$33,729
5
$27,316
APPLICATIONS WITHDRAWN
0
$0
8
$74,744
62
$78,498
8
$47,678
5
$50,302
0
$0
FILES CLOSED FOR INCOMPLETENESS
0
$0
5
$51,966
22
$89,488
3
$38,863
2
$16,655
0
$0
Aggregated Statistics For Year 2003 (Based on 2 partial tracts)
A) FHA, FSA/RHS & VA Home Purchase Loans
B) Conventional Home Purchase Loans
C) Refinancings
D) Home Improvement Loans
F) Non-occupant Loans on < 5 Family Dwellings (A B C & D)
Number
Average Value
Number
Average Value
Number
Average Value
Number
Average Value
Number
Average Value
LOANS ORIGINATED
27
$76,001
63
$63,716
248
$68,196
18
$13,602
20
$47,886
APPLICATIONS APPROVED, NOT ACCEPTED
2
$64,125
13
$52,274
67
$65,058
0
$0
10
$23,652
APPLICATIONS DENIED
3
$94,383
23
$57,210
157
$66,539
28
$18,916
8
$37,476
APPLICATIONS WITHDRAWN
0
$0
8
$38,725
72
$98,849
3
$19,433
2
$25,815
FILES CLOSED FOR INCOMPLETENESS
0
$0
3
$57,740
23
$67,059
0
$0
0
$0
Aggregated Statistics For Year 2002 (Based on 2 partial tracts)
A) FHA, FSA/RHS & VA Home Purchase Loans
B) Conventional Home Purchase Loans
C) Refinancings
D) Home Improvement Loans
F) Non-occupant Loans on < 5 Family Dwellings (A B C & D)
Number
Average Value
Number
Average Value
Number
Average Value
Number
Average Value
Number
Average Value
LOANS ORIGINATED
30
$71,510
78
$64,211
207
$66,085
23
$18,104
15
$47,525
APPLICATIONS APPROVED, NOT ACCEPTED
0
$0
3
$42,197
52
$68,834
3
$6,107
0
$0
APPLICATIONS DENIED
0
$0
10
$46,304
198
$72,740
20
$12,076
3
$43,307
APPLICATIONS WITHDRAWN
2
$31,645
8
$73,286
105
$76,475
7
$22,367
0
$0
FILES CLOSED FOR INCOMPLETENESS
2
$68,290
3
$24,983
32
$69,070
0
$0
2
$39,975
Aggregated Statistics For Year 2001 (Based on 2 partial tracts)
A) FHA, FSA/RHS & VA Home Purchase Loans
B) Conventional Home Purchase Loans
C) Refinancings
D) Home Improvement Loans
F) Non-occupant Loans on < 5 Family Dwellings (A B C & D)
Number
Average Value
Number
Average Value
Number
Average Value
Number
Average Value
Number
Average Value
LOANS ORIGINATED
17
$63,293
53
$63,670
175
$61,856
40
$14,407
22
$33,312
APPLICATIONS APPROVED, NOT ACCEPTED
2
$41,640
8
$59,961
58
$56,860
3
$6,663
3
$57,740
APPLICATIONS DENIED
2
$62,460
32
$47,313
182
$64,345
27
$22,455
10
$30,814
APPLICATIONS WITHDRAWN
5
$79,948
0
$0
93
$70,457
7
$12,136
2
$32,480
FILES CLOSED FOR INCOMPLETENESS
0
$0
0
$0
13
$76,105
0
$0
0
$0
Aggregated Statistics For Year 2000 (Based on 2 partial tracts)
A) FHA, FSA/RHS & VA Home Purchase Loans
B) Conventional Home Purchase Loans
C) Refinancings
D) Home Improvement Loans
F) Non-occupant Loans on < 5 Family Dwellings (A B C & D)
Number
Average Value
Number
Average Value
Number
Average Value
Number
Average Value
Number
Average Value
LOANS ORIGINATED
23
$71,766
48
$63,570
95
$49,968
27
$15,176
22
$38,536
APPLICATIONS APPROVED, NOT ACCEPTED
2
$23,320
7
$38,309
47
$47,877
20
$13,824
5
$43,638
APPLICATIONS DENIED
5
$73,286
30
$45,804
145
$53,701
32
$13,533
10
$46,970
APPLICATIONS WITHDRAWN
2
$79,115
5
$46,304
47
$51,031
3
$41,640
0
$0
FILES CLOSED FOR INCOMPLETENESS
0
$0
3
$51,080
15
$61,738
0
$0
0
$0
Aggregated Statistics For Year 1999 (Based on 1 partial tract)
A) FHA, FSA/RHS & VA Home Purchase Loans
B) Conventional Home Purchase Loans
C) Refinancings
D) Home Improvement Loans
F) Non-occupant Loans on < 5 Family Dwellings (A B C & D)
Detailed PMIC statistics for the following Tracts:8132.00
2002 - 2018 National Fire Incident Reporting System (NFIRS) incidents
According to the data from the years 2002 - 2018 the average number of fires per year is 13. The highest number of reported fires - 22 took place in 2006, and the least - 4 in 2018. The data has a dropping trend.
When looking into fire subcategories, the most reports belonged to: Structure Fires (60.3%), and Outside Fires (21.8%).
Fire incident types reported to NFIRS in Zip Code 44672


 Nearest zip codes: 44609, 44449, 44634, 44601, 44411, 44401.


 According to the data from the years 2002 - 2018 the average number of fires per year is 13. The highest number of reported fires - 22 took place in 2006, and the least - 4 in 2018. The data has a dropping trend.
 When looking into fire subcategories, the most reports belonged to: Structure Fires (60.3%), and Outside Fires (21.8%).