Estimated zip code population in 2022: 8,784 Zip code population in 2010: 9,208 Zip code population in 2000: 10,213
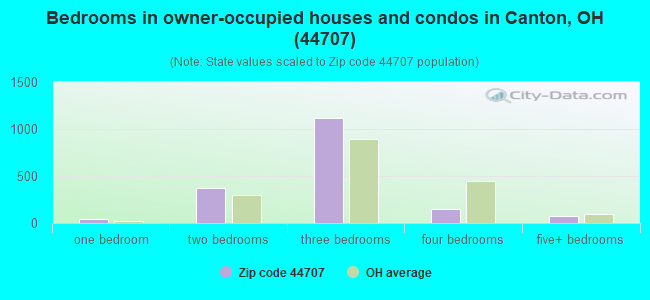
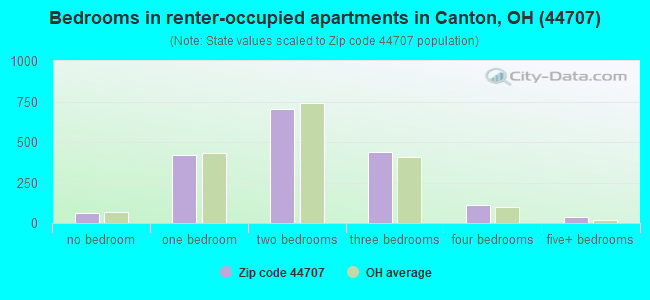
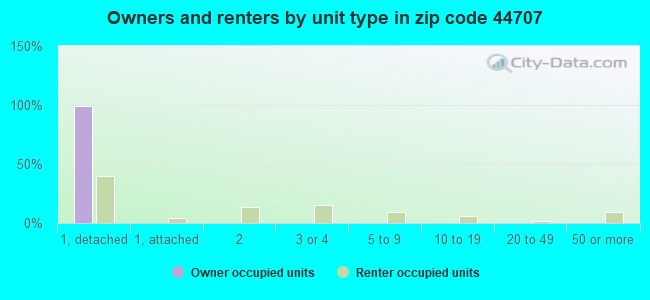
Houses and condos: 4,103 Renter-occupied apartments: 1,768
% of renters here:
50%
State:
33%
March 2022 cost of living index in zip code 44707: 88.9 (less than average, U.S. average is 100)
Land area: 14.4 sq. mi. Water area: 0.0 sq. mi.
Population density: 611 people per square mile
(low).
OSM Map
General Map
Google Map
MSN Map
OSM Map
General Map
Google Map
MSN Map
OSM Map
General Map
Google Map
MSN Map
OSM Map
General Map
Google Map
MSN Map
Please wait while loading the map...
Real estate property taxes paid for housing units in 2022:
This zip code:
1.2% ($1,317)
Ohio:
1.3% ($2,639)
Median real estate property taxes paid for housing units with mortgages in 2022: $1,371 (0.9%) Median real estate property taxes paid for housing units with no mortgage in 2022: $1,268 (1.4%)
Business Search- 14 Million verified businesses
Males: 4,011
(45.7%)
Females: 4,771
(54.3%)
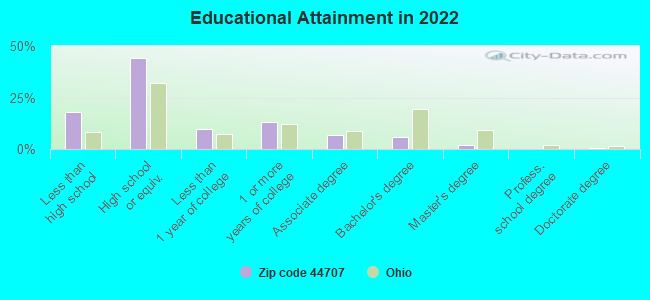
For population 25 years and over in 44707:
High school or higher: 80.0%
Bachelor's degree or higher: 8.0%
Graduate or professional degree: 2.4%
Unemployed: 3.7%
Mean travel time to work (commute): 22.9 minutes
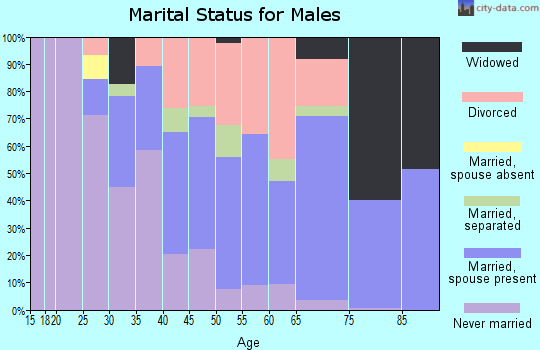
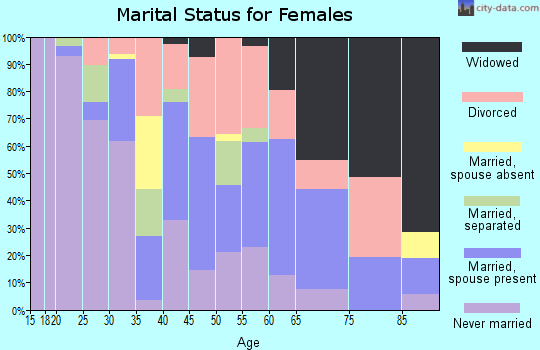
For population 15 years and over in 44707:
Never married: 48.8%
Now married: 28.6%
Separated: 2.1%
Widowed: 7.3%
Divorced: 13.3%
Zip code 44707 compared to state average:
Median household income below state average.
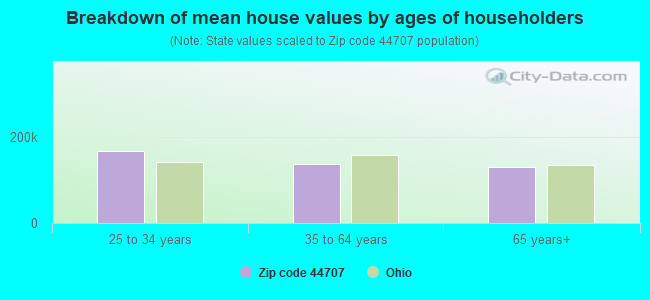
Median house value below state average.
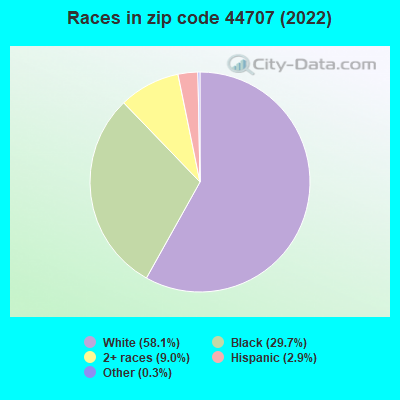
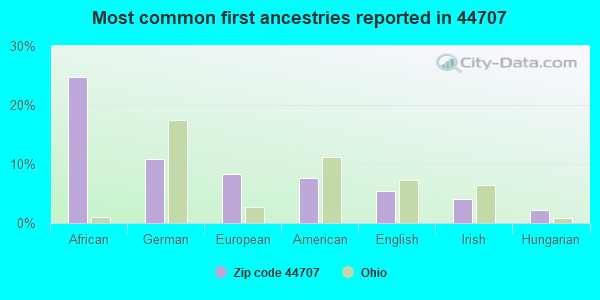
Black race population percentage above state average.
Median age below state average.
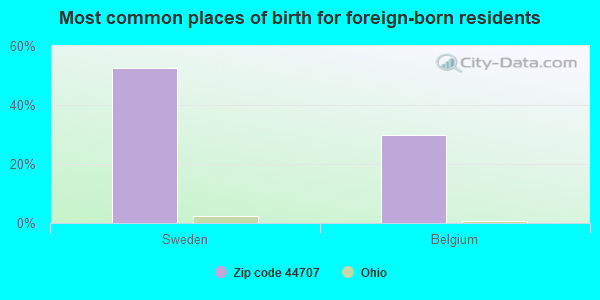
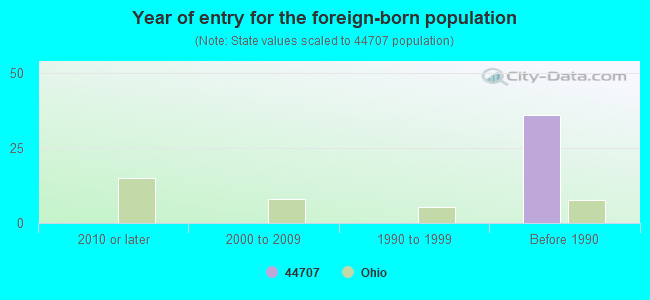
Foreign-born population percentage significantly below state average.
Renting percentage above state average.
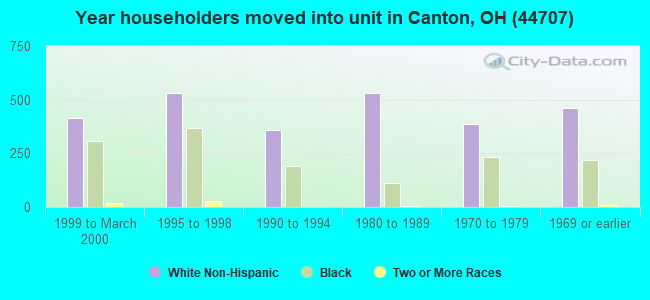
Length of stay since moving in significantly above state average.
Percentage of population with a bachelor's degree or higher significantly below state average.
Averages for the 2020 tax year for zip code 44707, filed in 2021:
Average Adjusted Gross Income (AGI) in 2020: $33,804 (Individual Income Tax Returns)
Here:
$33,804
State:
$67,288
Salary/wage: $30,194 (reported on 84.0% of returns)
Here:
$30,194
State:
$55,628
(% of AGI for various income ranges: 1034.6% for AGIs below $25k, 3435.8% for AGIs $25k-50k, 6213.3% for AGIs $50k-75k, 9594.7% for AGIs $75k-100k, 16467.0% for AGIs $100k-200k)
Taxable interest for individuals: $649 (reported on 12.8% of returns)
This zip code:
$649
Ohio:
$1,518
(% of AGI for various income ranges: 4.0% for AGIs below $25k, 9.1% for AGIs $25k-50k, 28.2% for AGIs $50k-75k, 18.0% for AGIs $75k-100k, 59.0% for AGIs $100k-200k)
Ordinary dividends: $1,800 (reported on 6.5% of returns)
Here:
$1,800
State:
$7,167
(% of AGI for various income ranges: 5.5% for AGIs below $25k, 13.6% for AGIs $25k-50k, 33.0% for AGIs $50k-75k, 16.7% for AGIs $75k-100k, 113.0% for AGIs $100k-200k)
Net capital gain/loss in AGI: +$3,191 (reported on 5.8% of returns)
Here:
+$3,191
State:
+$18,919
(% of AGI for various income ranges: 18.4% for AGIs $25k-50k, 35.2% for AGIs $50k-75k, 56.0% for AGIs $75k-100k, 359.0% for AGIs $100k-200k)
Profit/loss from business: +$7,994 (reported on 12.2% of returns)
Here:
+$7,994
State:
+$13,744
(% of AGI for various income ranges: 107.3% for AGIs below $25k, 71.5% for AGIs $25k-50k, 176.7% for AGIs $50k-75k, 248.0% for AGIs $75k-100k, 529.0% for AGIs $100k-200k)
Taxable individual retirement arrangement distribution: $10,805 (reported on 5.5% of returns)
44707:
$10,805
Ohio:
$18,876
(% of AGI for various income ranges: 27.9% for AGIs below $25k, 45.5% for AGIs $25k-50k, 106.7% for AGIs $50k-75k, 330.7% for AGIs $75k-100k, 636.0% for AGIs $100k-200k)
Total itemized deductions: $29,440 (reported on 1.2% of returns)
Here:
$29,440
State:
$33,869
(% of AGI for various income ranges: 86.7% for AGIs $25k-50k, 420.7% for AGIs $75k-100k)
Charity contributions: $9,500 (reported on 1.0% of returns)
Here:
$9,500
State:
$14,577
(% of AGI for various income ranges: 115.2% for AGIs $50k-75k)
Taxes paid: $5,280 (reported on 1.2% of returns)
44707:
$5,280
State:
$7,681
(% of AGI for various income ranges: 9.8% for AGIs $25k-50k, 112.7% for AGIs $75k-100k)
Earned income credit: $2,541 (reported on 31.8% of returns)
Here:
$2,541
State:
$2,304
(% of AGI for various income ranges: 148.4% for AGIs below $25k, 84.8% for AGIs $25k-50k)
Percentage of individuals using paid preparers for their 2020 taxes: 94.5%
Here:
94%
State:
94%
(% for various income ranges: 94.0% for AGIs below $25k, 95.0% for AGIs $25k-50k, 95.5% for AGIs $50k-75k, 95.2% for AGIs $75k-100k, 93.8% for AGIs $100k-200k)
Averages for the 2012 tax year for zip code 44707, filed in 2013:
Average Adjusted Gross Income (AGI) in 2012: $29,004 (Individual Income Tax Returns)
Here:
$29,004
State:
$54,926
Salary/wage: $26,652 (reported on 84.9% of returns)
Here:
$26,652
State:
$45,869
(% of AGI for various income ranges: 75.2% for AGIs below $25k, 78.7% for AGIs $25k-50k, 81.6% for AGIs $50k-75k, 76.0% for AGIs $75k-100k, 78.3% for AGIs $100k-200k)
Taxable interest for individuals: $532 (reported on 16.7% of returns)
This zip code:
$532
Ohio:
$1,297
(% of AGI for various income ranges: 0.4% for AGIs below $25k, 0.3% for AGIs $25k-50k, 0.2% for AGIs $50k-75k, 0.2% for AGIs $75k-100k, 0.2% for AGIs $100k-200k)
Ordinary dividends: $2,003 (reported on 8.2% of returns)
Here:
$2,003
State:
$5,821
(% of AGI for various income ranges: 0.6% for AGIs below $25k, 0.7% for AGIs $25k-50k, 0.3% for AGIs $50k-75k, 0.2% for AGIs $75k-100k, 1.0% for AGIs $100k-200k)
Profit/loss from business: +$8,420 (reported on 11.8% of returns)
Here:
+$8,420
State:
+$12,773
(% of AGI for various income ranges: 8.9% for AGIs below $25k, 1.7% for AGIs $25k-50k, 1.3% for AGIs $50k-75k, 3.7% for AGIs $75k-100k)
Taxable individual retirement arrangement distribution: $7,664 (reported on 5.6% of returns)
44707:
$7,664
Ohio:
$14,511
(% of AGI for various income ranges: 1.5% for AGIs below $25k, 1.4% for AGIs $25k-50k, 1.8% for AGIs $50k-75k, 2.5% for AGIs $75k-100k)
Total itemized deductions: $14,825 (24% of AGI, reported on 11.3% of returns)
Here:
$14,825
State:
$21,278
Here:
23.8% of AGI
State:
18.8% of AGI
(% of AGI for various income ranges: 2.8% for AGIs below $25k, 4.7% for AGIs $25k-50k, 7.5% for AGIs $50k-75k, 8.0% for AGIs $75k-100k, 8.4% for AGIs $100k-200k)
Charity contributions: $2,844 (reported on 8.2% of returns)
Here:
$2,844
State:
$3,943
(% of AGI for various income ranges: 0.4% for AGIs below $25k, 0.6% for AGIs $25k-50k, 1.1% for AGIs $50k-75k, 1.3% for AGIs $75k-100k, 1.1% for AGIs $100k-200k)
Taxes paid: $4,316 (reported on 11.0% of returns)
44707:
$4,316
State:
$9,568
(% of AGI for various income ranges: 0.5% for AGIs below $25k, 1.0% for AGIs $25k-50k, 2.2% for AGIs $50k-75k, 2.4% for AGIs $75k-100k, 3.5% for AGIs $100k-200k)
Earned income credit: $2,495 (reported on 36.4% of returns)
Here:
$2,495
State:
$2,285
(% of AGI for various income ranges: 11.4% for AGIs below $25k, 1.4% for AGIs $25k-50k)
Percentage of individuals using paid preparers for their 2012 taxes: 51.8%
Here:
52%
State:
51%
(% for various income ranges: 47.8% for AGIs below $25k, 54.3% for AGIs $25k-50k, 60.5% for AGIs $50k-75k, 63.2% for AGIs $75k-100k, 63.6% for AGIs $100k-200k)
Averages for the 2004 tax year for zip code 44707, filed in 2005:
Average Adjusted Gross Income (AGI) in 2004: $25,552 (Individual Income Tax Returns)
Here:
$25,552
State:
$44,480
Salary/wage: $23,069 (reported on 88.5% of returns)
Here:
$23,069
State:
$39,198
(% of AGI for various income ranges: 87.5% for AGIs below $10k, 79.4% for AGIs $10k-25k, 82.9% for AGIs $25k-50k, 83.8% for AGIs $50k-75k, 78.2% for AGIs $75k-100k, 53.7% for AGIs over 100k)
Taxable interest for individuals: $876 (reported on 25.3% of returns)
This zip code:
$876
Ohio:
$1,532
(% of AGI for various income ranges: 1.1% for AGIs below $10k, 0.9% for AGIs $10k-25k, 0.7% for AGIs $25k-50k, 1.1% for AGIs $50k-75k, 0.6% for AGIs $75k-100k, 1.1% for AGIs over 100k)
Taxable dividends: $1,417 (reported on 10.3% of returns)
Here:
$1,417
State:
$3,496
(% of AGI for various income ranges: 0.5% for AGIs below $10k, 0.4% for AGIs $10k-25k, 0.4% for AGIs $25k-50k, 0.2% for AGIs $50k-75k, 2.1% for AGIs $75k-100k, 1.1% for AGIs over 100k)
Net capital gain/loss: +$2,288 (reported on 7.3% of returns)
Here:
+$2,288
State:
+$8,582
(% of AGI for various income ranges: -0.4% for AGIs below $10k, 0.5% for AGIs $10k-25k, 0.4% for AGIs $25k-50k, 1.1% for AGIs $50k-75k, 1.1% for AGIs $75k-100k, 1.1% for AGIs over 100k)
Profit/loss from business: +$5,437 (reported on 9.6% of returns)
Here:
+$5,437
State:
+$10,813
(% of AGI for various income ranges: 6.2% for AGIs below $10k, 3.6% for AGIs $10k-25k, 1.7% for AGIs $25k-50k, 0.9% for AGIs $50k-75k, 1.5% for AGIs $75k-100k)
IRA payment deduction: $2,347 (reported on 1.2% of returns)
44707:
$2,347
Ohio:
$2,794
Total itemized deductions: $12,528 (22% of AGI, reported on 14.2% of returns)
Here:
$12,528
State:
$17,503
Here:
21.9% of AGI
State:
20.8% of AGI
(% of AGI for various income ranges: 2.5% for AGIs below $10k, 2.9% for AGIs $10k-25k, 6.3% for AGIs $25k-50k, 10.0% for AGIs $50k-75k, 13.0% for AGIs $75k-100k, 8.5% for AGIs over 100k)
Charity contributions deductions: $2,520 (4% of AGI, reported on 11.4% of returns)
Here:
$2,520
State:
$3,087
Here:
4.1% of AGI
State:
3.4% of AGI
(% of AGI for various income ranges: 0.5% for AGIs $10k-25k, 0.9% for AGIs $25k-50k, 1.6% for AGIs $50k-75k, 2.8% for AGIs $75k-100k, 1.7% for AGIs over 100k)
Total tax: $2,878 (reported on 60.2% of returns)
44707:
$2,878
State:
$6,781
(% of AGI for various income ranges: 1.8% for AGIs below $10k, 3.4% for AGIs $10k-25k, 6.6% for AGIs $25k-50k, 8.9% for AGIs $50k-75k, 10.3% for AGIs $75k-100k, 10.9% for AGIs over 100k)
Earned income credit: $1,902 (reported on 33.3% of returns)
Here:
$1,902
State:
$1,696
Percentage of individuals using paid preparers for their 2004 taxes: 62.3%
Here:
62%
State:
55%
(% for various income ranges: 59.7% for AGIs below $10k, 65.5% for AGIs $10k-25k, 61.1% for AGIs $25k-50k, 58.3% for AGIs $50k-75k, 69.6% for AGIs $75k-100k, 77.3% for AGIs over 100k)
Household received Food Stamps/SNAP in the past 12 months: 1,210 Household did not receive Food Stamps/SNAP in the past 12 months: 2,351
Women who had a birth in the past 12 months: 160 (22 now married, 133 unmarried) Women who did not have a birth in the past 12 months: 1,957 (380 now married, 1,578 unmarried)
Housing units in zip code 44707 with a mortgage: 844 (68 second mortgage, 63 both second mortgage and home equity loan) Houses without a mortgage: 49
Median monthly owner costs for units with a mortgage: $985 Median monthly owner costs for units without a mortgage: $428
Residents with income below the poverty level in 2022:
This zip code:
33.9%
Whole state:
13.4%
Residents with income below 50% of the poverty level in 2022:
This zip code:
17.1%
Whole state:
7.0%
Median number of rooms in houses and condos:
Here:
6.2
State:
6.7
Median number of rooms in apartments:
Here:
4.6
State:
4.4
Notable locations in this zip code not listed on our city pages
Notable locations in zip code 44707: Emergency Medical Transport Station 100 (A), Emergency Medical Transport Station 101 (B), Canton Township Fire Department Station 1 (C), Canton Fire Department Station 2 (D), Canton Township Fire Department Station 2 (E). Display/hide their locations on the map
Churches in zip code 44707 include: South Canton Community Church (A), First United Church of Christ (B), First Presbyterian Church (C), Saint Marys Catholic Church (D), Mount Zion United Methodist Church (E), First Lutheran Church (F), Saint Benedicts Catholic Church (G), Saint Anthonys Catholic Church (H), Moreland Church (I). Display/hide their locations on the map
Parks in zip code 44707 include: Bauhoff Park (1), City Field Park (2), Freeway Park (3), West Park (4), McKinley Park (5), Grenshaw Park (6), Ida Park (7), Jackson Park (8). Display/hide their locations on the map
552 married couples with children.
1,320 single-parent households (139 men, 1,181 women).
97.8% of residents of 44707 zip code speak English at home.
0.9% of residents speak Spanish at home (65% very well, 35% well).
0.7% of residents speak other Indo-European language at home (100% very well).
Foreign born population: 40 (0.5%) (45.5% of them are naturalized citizens)
Major facilities with environmental interests located in this zip code:
ADELMANS (2000 WAYNESBURG RD SE in CANTON, OH)
(Integrated Compliance Information System) - ICIS-HQ-2000-0095, FORMAL ENFORCEMENT ACTION STATE MASTER (Ohio general info) - RCRA-OHD987014594, HAZARDOUS WASTE PROGRAM Small Quantity Generators, between 100 kg and 1000 kg of hazardous waste/month (Resource Conservation and Recovery Act (tracking hazardous waste)) - notification Business SIC classification: CONSTRUCTION AND MINING (EXCEPT PETROLEUM) MACHINERY AND EQUIPMENT Organizations: ADELMAN, CARL (CONTACT/OWNER)
AMOS MCDANIEL ELEMENTARY SCHOOL (210 38TH ST SE in CANTON, OH)
(Geographic Names Information System) (National Center for Education Statistics) - STATE ID-023499 STATE MASTER (Ohio general info) - AIR MAJOR, SDWIS-7638812, DRINKING WATER PROGRAM Organizations: MCDANNEL ELEMENTARY SCHOOL (CONTACT/OWNER)
, CANTON LOCAL SD (SCHOOL DISTRICT)
Alternative names: AMOS MCDANNEL ELEMENTARY SCHO
BISON CORP (1935 ALLEN AVE SE in CANTON, OH)
STATE MASTER (Ohio general info) - AIR MAJOR, RCRA-OHR000035220, HAZARDOUS WASTE PROGRAM (Resource Conservation and Recovery Act (tracking hazardous waste)) Business SIC classification: ALKALIES AND CHLORINE Organizations: JAMES KANDEL (RECEIVER) (CONTACT/OPERATOR)
, MORELLI REALTY CORP (CONTACT/OWNER)
BONDED 1126 (1329 TUSCARAWAS ST E in CANTON, OH)
STATE MASTER (Ohio general info) - RCRA-OHD987005733, HAZARDOUS WASTE PROGRAM, AIR MAJOR, -76-5541-899-3, EPCRA (Resource Conservation and Recovery Act (tracking hazardous waste)) Organizations: SPEEDWAY/SUPERAMERICA (CONTACT/OWNER)
BORDEN INC (1112 E TUSCARAWAS ST in CANTON, OH)
STATE MASTER (Ohio general info) - PCS-OH0012394, National Pollutant Discharge Elimination System Permit (Resource Conservation and Recovery Act (tracking hazardous waste)) Alternative names: BORDEN DAIRY & SERVICES
BLAIR S CLEANERS (1317 EAST TUSCARAWAS STREET in CANTON, OH)
STATE MASTER (Ohio general info) - AIR MAJOR, RCRA-OHD017572918, HAZARDOUS WASTE PROGRAM Small Quantity Generators, between 100 kg and 1000 kg of hazardous waste/month (Resource Conservation and Recovery Act (tracking hazardous waste)) - notification Organizations: BOY BLUE 1 HR CLEANERS (CONTACT/OWNER)
Alternative names: BLAIR'S CLEANERS
BOWDIL CO (2030 INDUSTRIAL PLACE SOUTHEAST in CANTON, OH)
STATE MASTER (Ohio general info) - AIR MAJOR, TRIS-44707BWDLC2030I, TRI REPORTER, RCRA-OHD004469839, HAZARDOUS WASTE PROGRAM Conditionally Exempt Small Quantity Generators, less than 100 kg/month of hazardous waste (Resource Conservation and Recovery Act (tracking hazardous waste)) - notification TRI REPORTER (Tracking of toxic chemicals releasing facilities) Business SIC classification: METAL HEAT TREATING
AKRON CANTON WASTE OIL CO INC * (1701 SHERRICK SE in CANTON, OH)
STATE MASTER (Ohio general info) - AIR MAJOR, RCRA-OHD000724286, HAZARDOUS WASTE PROGRAM USED OIL PROGRAM (Resource Conservation and Recovery Act (tracking hazardous waste)) Organizations: AKRON CANTON WASTE OIL INC (CONTACT/OWNER)
BEAVER PETROLEUM CO INC (1507 WAYNESBURG DRIVE SE in CANTON, OH)
STATE MASTER (Ohio general info) - AIR MAJOR, RCRA-OHR000014399, HAZARDOUS WASTE PROGRAM USED OIL PROGRAM (Resource Conservation and Recovery Act (tracking hazardous waste))
AGA GAS INC (905 BELDEN AVENUE, S.E. in CANTON, OH)
ENFORCEMENT/COMPLIANCE ACTIVITY (Integrated Compliance Information System) STATE MASTER (Ohio general info) - EPCRA TRI REPORTER (Tracking of toxic chemicals releasing facilities) Business SIC classification: LOCAL TRUCKING WITH STORAGE; CHEMICALS AND ALLIED PRODUCTS Alternative names: LINDE GAS
ALLEN ELEMENTARY SCHOOL (1326 SHERRICK RD SE in CANTON, OH)
(Geographic Names Information System) (National Center for Education Statistics) - STATE ID-000406 Organizations: CANTON CITY SD (SCHOOL DISTRICT)
AMERICAN ELECTRIC POWER CORP LAB (1580 WARNER RD S E in CANTON, OH)
(Resource Conservation and Recovery Act (tracking hazardous waste)) Organizations: AMERICAN ELECTRIC POWER CORPORATION (CONTACT/OWNER)
ABB POWER DISTRIBUTION INC (825 NAVARRE RD SW in CANTON, OH)
(Resource Conservation and Recovery Act (tracking hazardous waste)) Organizations: AAB POWER DISTRIBUTION INC (CONTACT/OWNER)
Housing units lacking complete plumbing facilities: 6.4% Housing units lacking complete kitchen facilities: 8.0%
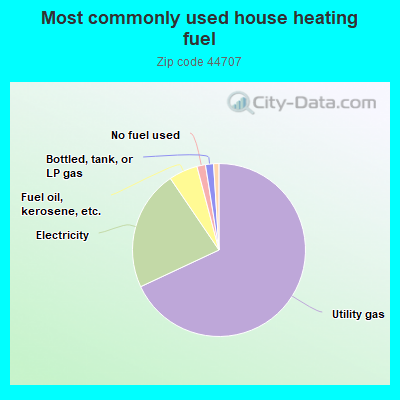
68.1%Utility gas
22.5%Electricity
5.4%Fuel oil, kerosene, etc.
1.6%No fuel used
1.5%Bottled, tank, or LP gas
1.0%Wood
Population in 1990: 11,010.
Place of birth for U.S.-born residents:
This state: 7,580
Northeast: 68
Midwest: 271
South: 583
West: 225
64% of the 44707 zip code residents lived in the same house 5 years ago. Out of people who lived in different houses, 84% lived in this county. Out of people who lived in different counties, 50% lived in Ohio.
93% of the 44707 zip code residents lived in the same house 1 year ago. Out of people who lived in different houses, 83% moved from this county. Out of people who lived in different houses, 11% moved from different county within same state. Out of people who lived in different houses, 4% moved from different state.
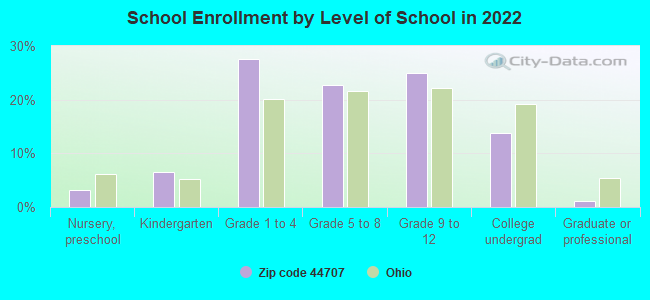
Private vs. public school enrollment:
Students in private schools in grades 1 to 8 (elementary and middle school): 76
Here:
6.4%
Ohio:
16.0%
Students in private schools in grades 9 to 12 (high school): 69
Here:
11.8%
Ohio:
13.1%
Students in private undergraduate colleges: 109
Here:
33.8%
Ohio:
22.3%
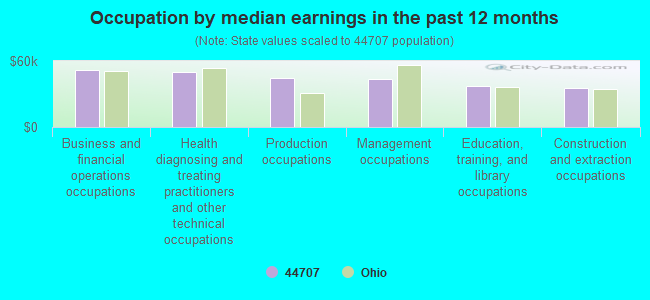
Occupation by median earnings in the past 12 months ($)
51,445Business and financial operations occupations
49,809Health diagnosing and treating practitioners and other technical occupations
44,683Production occupations
43,599Management occupations
37,676Education, training, and library occupations
35,389Construction and extraction occupations
Companies with federal contracts located in this zip code:
ABBOTT ELECTRIC INC (1010 4TH ST SE in CANTON, OH; small business)
$18,725 with U.S. Army Corps of Engineers - civil program financing only for Construction of Structures and Facilities -- Other Utilities. Signed on 2003-01-16. Completion date: 2003-02-28.
Top industries in this zip code by the number of employees in 2005:
Health Care and Social Assistance: Vocational Rehabilitation Services (250-499 employees: 1 establishment, 50-99 employees: 1 establishment)
Wholesale Trade: Motor Vehicle Supplies and New Parts Merchant Wholesalers (250-499: 1, 20-49: 1, 10-19: 1, 5-9: 1)
2003 - 2018 National Fire Incident Reporting System (NFIRS) incidents
Based on the data from the years 2003 - 2018 the average number of fires per year is 79. The highest number of reported fires - 113 took place in 2009, and the least - 27 in 2016. The data has a decreasing trend.
When looking into fire subcategories, the most incidents belonged to: Structure Fires (42.4%), and Outside Fires (30.8%).
Fire incident types reported to NFIRS in Zip Code 44707

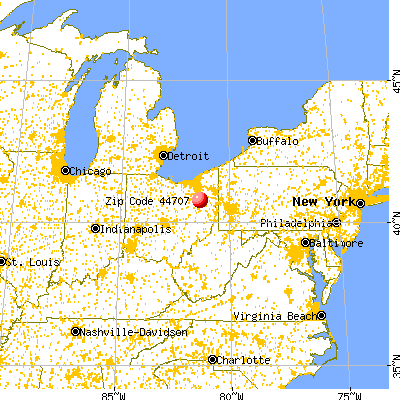


 Nearest zip codes: 44704, 44702, 44703, 44706, 44714, 44705.
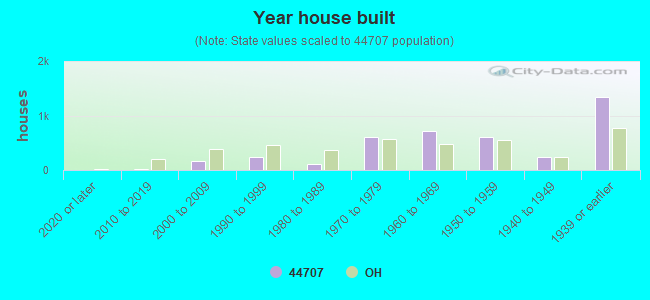


 Based on the data from the years 2003 - 2018 the average number of fires per year is 79. The highest number of reported fires - 113 took place in 2009, and the least - 27 in 2016. The data has a decreasing trend.
 When looking into fire subcategories, the most incidents belonged to: Structure Fires (42.4%), and Outside Fires (30.8%).