Estimated zip code population in 2022: 1,279 Zip code population in 2010: 1,179 Zip code population in 2000: 1,128
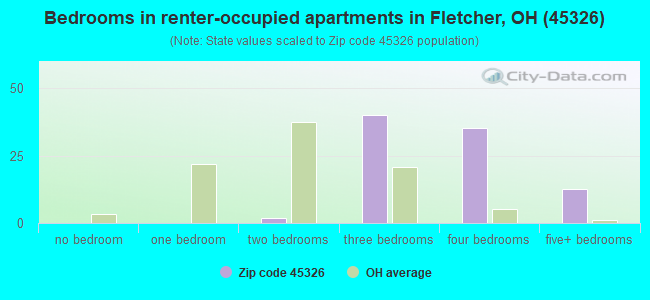
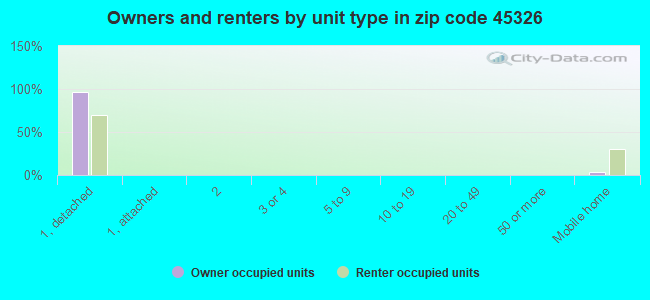
Houses and condos: 467 Renter-occupied apartments: 93
% of renters here:
20%
State:
33%
March 2022 cost of living index in zip code 45326: 83.6 (less than average, U.S. average is 100)
Land area: 23.1 sq. mi. Water area: 0.0 sq. mi.
Population density: 55 people per square mile
(very low).
OSM Map
General Map
Google Map
MSN Map
OSM Map
General Map
Google Map
MSN Map
OSM Map
General Map
Google Map
MSN Map
OSM Map
General Map
Google Map
MSN Map
Please wait while loading the map...
Real estate property taxes paid for housing units in 2022:
This zip code:
1.0% ($1,509)
Ohio:
1.3% ($2,639)
Median real estate property taxes paid for housing units with mortgages in 2022: $1,541 (0.8%) Median real estate property taxes paid for housing units with no mortgage in 2022: $1,390 (1.2%)
Business Search- 14 Million verified businesses
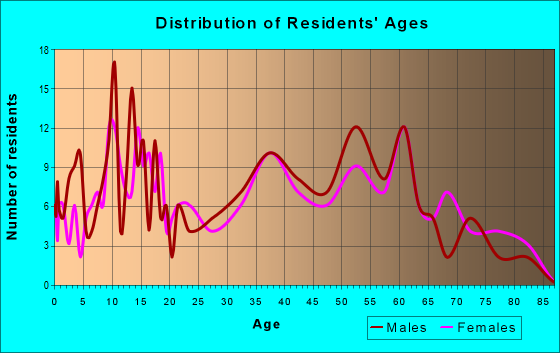
Males: 613
(47.9%)
Females: 666
(52.1%)
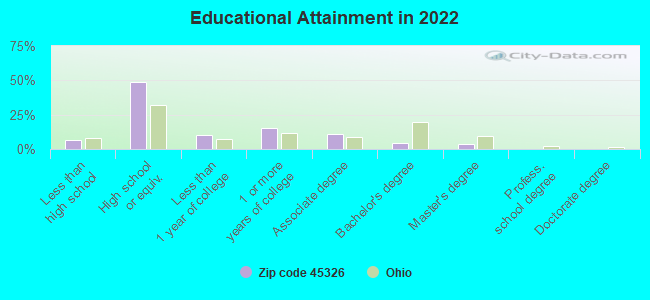
For population 25 years and over in 45326:
High school or higher: 92.0%
Bachelor's degree or higher: 8.3%
Graduate or professional degree: 3.9%
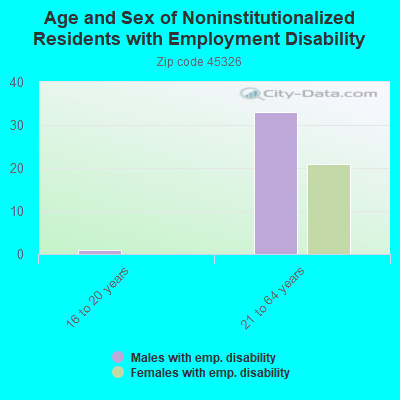
Unemployed: 1.0%
Mean travel time to work (commute): 22.9 minutes
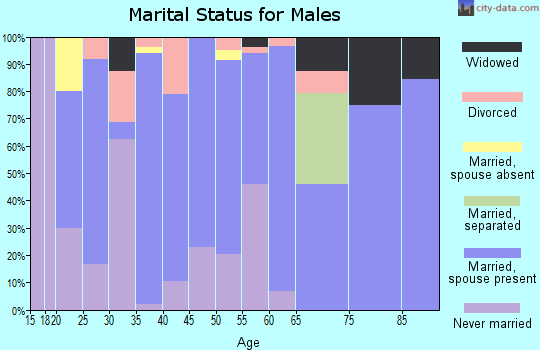
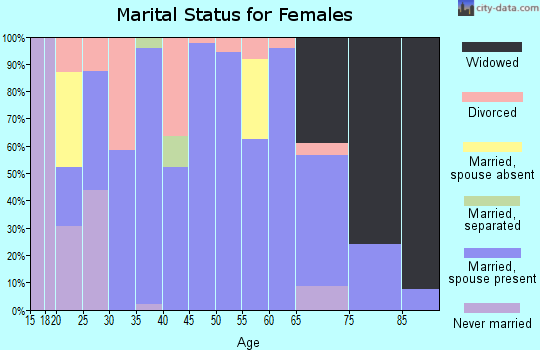
For population 15 years and over in 45326:
Never married: 25.1%
Now married: 62.3%
Separated: 0.2%
Widowed: 1.9%
Divorced: 10.5%
Zip code 45326 compared to state average:
Unemployed percentage significantly below state average.
Black race population percentage significantly below state average.
Hispanic race population percentage significantly below state average.
Foreign-born population percentage significantly below state average.
Renting percentage below state average.
Length of stay since moving in significantly above state average.
Percentage of population with a bachelor's degree or higher significantly below state average.
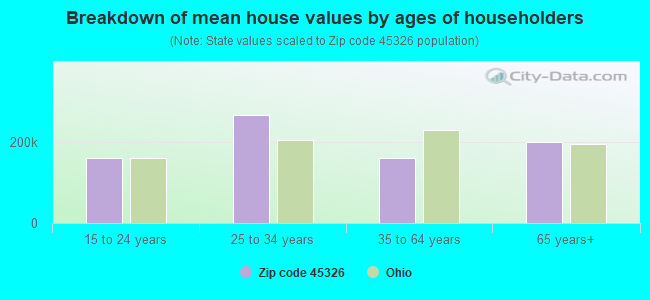
Estimated median house/condo value in 2022: $158,782
45326:
$158,782
Ohio:
$204,100
According to our research of Ohio and other state lists, there was 1 registered sex offender living in 45326 zip code as of April 18, 2024. The ratio of all residents to sex offenders in zip code 45326 is 1,155 to 1. The ratio of registered sex offenders to all residents in this zip code is lower than the state average.
Median resident age:
This zip code:
39.5 years
Ohio median age:
39.9 years
Average household size:
This zip code:
2.8 people
Ohio:
2.4 people
Averages for the 2020 tax year for zip code 45326, filed in 2021:
Average Adjusted Gross Income (AGI) in 2020: $61,029 (Individual Income Tax Returns)
Here:
$61,029
State:
$67,288
Salary/wage: $49,044 (reported on 82.8% of returns)
Here:
$49,044
State:
$55,628
(% of AGI for various income ranges: 1204.4% for AGIs below $25k, 3864.6% for AGIs $25k-50k, 7027.1% for AGIs $50k-75k, 9084.0% for AGIs $75k-100k, 19930.0% for AGIs $100k-200k)
Taxable interest for individuals: $353 (reported on 29.3% of returns)
This zip code:
$353
Ohio:
$1,518
(% of AGI for various income ranges: 4.4% for AGIs below $25k, 7.7% for AGIs $25k-50k, 24.3% for AGIs $50k-75k, 14.0% for AGIs $75k-100k, 55.0% for AGIs $100k-200k)
Ordinary dividends: $1,825 (reported on 13.8% of returns)
Here:
$1,825
State:
$7,167
(% of AGI for various income ranges: 48.5% for AGIs $25k-50k, 166.0% for AGIs $75k-100k)
Net capital gain/loss in AGI: +$12,340 (reported on 8.6% of returns)
Here:
+$12,340
State:
+$18,919
(% of AGI for various income ranges: 21.5% for AGIs $25k-50k, 1178.0% for AGIs $75k-100k)
Profit/loss from business: +$7,500 (reported on 12.1% of returns)
Here:
+$7,500
State:
+$13,744
(% of AGI for various income ranges: 205.4% for AGIs $25k-50k, 516.0% for AGIs $75k-100k)
Taxable individual retirement arrangement distribution: $9,217 (reported on 10.3% of returns)
45326:
$9,217
Ohio:
$18,876
(% of AGI for various income ranges: 182.2% for AGIs below $25k, 555.7% for AGIs $50k-75k)
Earned income credit: $2,100 (reported on 10.3% of returns)
Here:
$2,100
State:
$2,304
(% of AGI for various income ranges: 61.1% for AGIs below $25k, 54.6% for AGIs $25k-50k)
Percentage of individuals using paid preparers for their 2020 taxes: 96.6%
Here:
97%
State:
94%
(% for various income ranges: 93.3% for AGIs below $25k, 94.1% for AGIs $25k-50k, 100.0% for AGIs $50k-75k, 100.0% for AGIs $75k-100k, 100.0% for AGIs $100k-200k)
Averages for the 2012 tax year for zip code 45326, filed in 2013:
Average Adjusted Gross Income (AGI) in 2012: $47,811 (Individual Income Tax Returns)
Here:
$47,811
State:
$54,926
Salary/wage: $42,149 (reported on 83.9% of returns)
Here:
$42,149
State:
$45,869
(% of AGI for various income ranges: 68.0% for AGIs below $25k, 81.7% for AGIs $25k-50k, 75.2% for AGIs $50k-75k, 78.4% for AGIs $75k-100k, 66.1% for AGIs $100k-200k)
Taxable interest for individuals: $388 (reported on 28.6% of returns)
This zip code:
$388
Ohio:
$1,297
(% of AGI for various income ranges: 0.5% for AGIs below $25k, 0.3% for AGIs $25k-50k, 0.1% for AGIs $50k-75k, 0.2% for AGIs $75k-100k, 0.3% for AGIs $100k-200k)
Ordinary dividends: $1,688 (reported on 14.3% of returns)
Here:
$1,688
State:
$5,821
(% of AGI for various income ranges: 2.3% for AGIs below $25k, 1.0% for AGIs $50k-75k, 0.4% for AGIs $100k-200k)
Net capital gain/loss in AGI: +$800 (reported on 10.7% of returns)
Here:
+$800
State:
+$11,232
(% of AGI for various income ranges: 1.3% for AGIs $75k-100k)
Profit/loss from business: +$5,375 (reported on 14.3% of returns)
Here:
+$5,375
State:
+$12,773
(% of AGI for various income ranges: 5.0% for AGIs below $25k, 5.4% for AGIs $50k-75k)
Taxable individual retirement arrangement distribution: $6,633 (reported on 10.7% of returns)
45326:
$6,633
Ohio:
$14,511
(% of AGI for various income ranges: 7.4% for AGIs below $25k, 4.0% for AGIs $50k-75k)
Total itemized deductions: $16,573 (20% of AGI, reported on 26.8% of returns)
Here:
$16,573
State:
$21,278
Here:
20.0% of AGI
State:
18.8% of AGI
(% of AGI for various income ranges: 9.9% for AGIs $25k-50k, 8.2% for AGIs $50k-75k, 11.7% for AGIs $75k-100k, 10.6% for AGIs $100k-200k)
Charity contributions: $2,873 (reported on 19.6% of returns)
Here:
$2,873
State:
$3,943
(% of AGI for various income ranges: 1.0% for AGIs $25k-50k, 1.4% for AGIs $50k-75k, 1.6% for AGIs $75k-100k, 1.2% for AGIs $100k-200k)
Taxes paid: $6,500 (reported on 26.8% of returns)
45326:
$6,500
State:
$9,568
(% of AGI for various income ranges: 2.8% for AGIs $25k-50k, 2.9% for AGIs $50k-75k, 4.8% for AGIs $75k-100k, 5.1% for AGIs $100k-200k)
Earned income credit: $2,162 (reported on 14.3% of returns)
Here:
$2,162
State:
$2,285
(% of AGI for various income ranges: 5.6% for AGIs below $25k, 0.9% for AGIs $25k-50k)
Percentage of individuals using paid preparers for their 2012 taxes: 62.5%
Here:
62%
State:
51%
(% for various income ranges: 55.6% for AGIs below $25k, 62.5% for AGIs $25k-50k, 70.0% for AGIs $50k-75k, 66.7% for AGIs $75k-100k, 66.7% for AGIs $100k-200k)
Averages for the 2004 tax year for zip code 45326, filed in 2005:
Average Adjusted Gross Income (AGI) in 2004: $37,137 (Individual Income Tax Returns)
Here:
$37,137
State:
$44,480
Salary/wage: $33,985 (reported on 86.5% of returns)
Here:
$33,985
State:
$39,198
(% of AGI for various income ranges: 110.1% for AGIs below $10k, 75.0% for AGIs $10k-25k, 86.1% for AGIs $25k-50k, 83.4% for AGIs $50k-75k, 79.4% for AGIs $75k-100k, 54.6% for AGIs over 100k)
Taxable interest for individuals: $886 (reported on 37.3% of returns)
This zip code:
$886
Ohio:
$1,532
(% of AGI for various income ranges: 2.8% for AGIs below $10k, 1.6% for AGIs $10k-25k, 1.0% for AGIs $25k-50k, 0.8% for AGIs $50k-75k, 0.3% for AGIs $75k-100k, 0.7% for AGIs over 100k)
Taxable dividends: $1,406 (reported on 15.6% of returns)
Here:
$1,406
State:
$3,496
(% of AGI for various income ranges: 0.5% for AGIs $10k-25k, 0.8% for AGIs $25k-50k, 0.8% for AGIs $50k-75k, 0.1% for AGIs $75k-100k, 0.5% for AGIs over 100k)
Net capital gain/loss: +$1,786 (reported on 13.7% of returns)
Here:
+$1,786
State:
+$8,582
(% of AGI for various income ranges: -0.2% for AGIs $10k-25k, 2.3% for AGIs $25k-50k, -0.1% for AGIs $50k-75k, 0.4% for AGIs $75k-100k)
Profit/loss from business: +$2,289 (reported on 13.5% of returns)
Here:
+$2,289
State:
+$10,813
(% of AGI for various income ranges: 0.5% for AGIs below $10k, 3.2% for AGIs $10k-25k, 0.8% for AGIs $25k-50k, -0.5% for AGIs $50k-75k, 2.3% for AGIs $75k-100k)
Total itemized deductions: $13,282 (23% of AGI, reported on 28.3% of returns)
Here:
$13,282
State:
$17,503
Here:
22.6% of AGI
State:
20.8% of AGI
(% of AGI for various income ranges: 6.8% for AGIs $10k-25k, 8.7% for AGIs $25k-50k, 11.5% for AGIs $50k-75k, 10.9% for AGIs $75k-100k, 13.3% for AGIs over 100k)
Charity contributions deductions: $2,052 (3% of AGI, reported on 22.0% of returns)
Here:
$2,052
State:
$3,087
Here:
3.2% of AGI
State:
3.4% of AGI
(% of AGI for various income ranges: 1.0% for AGIs $25k-50k, 1.7% for AGIs $50k-75k, 1.5% for AGIs $75k-100k, 1.4% for AGIs over 100k)
Total tax: $4,081 (reported on 78.5% of returns)
45326:
$4,081
State:
$6,781
(% of AGI for various income ranges: 3.3% for AGIs below $10k, 4.0% for AGIs $10k-25k, 7.0% for AGIs $25k-50k, 7.8% for AGIs $50k-75k, 10.6% for AGIs $75k-100k, 15.8% for AGIs over 100k)
Earned income credit: $1,689 (reported on 9.9% of returns)
Here:
$1,689
State:
$1,696
Percentage of individuals using paid preparers for their 2004 taxes: 69.1%
Here:
69%
State:
55%
(% for various income ranges: 56.9% for AGIs below $10k, 70.1% for AGIs $10k-25k, 69.5% for AGIs $25k-50k, 71.0% for AGIs $50k-75k, 86.7% for AGIs $75k-100k, 76.0% for AGIs over 100k)
Household received Food Stamps/SNAP in the past 12 months: 18 Household did not receive Food Stamps/SNAP in the past 12 months: 440
Women who had a birth in the past 12 months: 36 (34 now married, 2 unmarried) Women who did not have a birth in the past 12 months: 244 (117 now married, 126 unmarried)
Housing units in zip code 45326 with a mortgage: 238 (33 second mortgage, 34 both second mortgage and home equity loan) Houses without a mortgage: 4
Median monthly owner costs for units with a mortgage: $1,389 Median monthly owner costs for units without a mortgage: $489
Residents with income below the poverty level in 2022:
This zip code:
13.5%
Whole state:
13.4%
Residents with income below 50% of the poverty level in 2022:
This zip code:
12.2%
Whole state:
7.0%
Median number of rooms in houses and condos:
Here:
6.3
State:
6.7
Median number of rooms in apartments:
Here:
7.6
State:
4.4
Notable locations in this zip code not listed on our city pages
Notable locations in zip code 45326: Progress Farms (A), Futura Farms (B), Futureama Farms (C), Hill Farms (D), R C T Farm (E), Suber Farms (F), Yingst Farms (G), Fletcher Brown Township Emergency Medical Services (H), Fletcher Volunteer Fire Department (I). Display/hide their locations on the map
Size of family households: 163 2-persons, 115 3-persons, 31 4-persons, 19 5-persons, 14 6-persons, 19 7-or-more-persons
Size of nonfamily households: 64 1-person, 30 2-persons
203 married couples with children.
73 single-parent households (49 men, 24 women).
99.3% of residents of 45326 zip code speak English at home.
0.1% of residents speak Spanish at home (100% very well).
Foreign born population: 0 (0.0%)
:
0.0%
Whole state:
5.0%
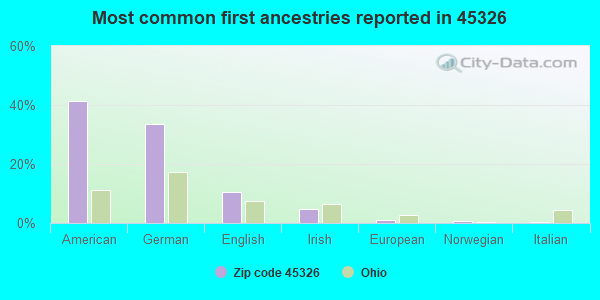
41%American
33%German
11%English
5%Irish
1%European
1%Norwegian
0%Italian
Facilities with environmental interests located in this zip code:
AT&T LONG LINES FLETCHER (1MI E OF FLETCHER ON US 36 in FLETCHER, OH)
(Resource Conservation and Recovery Act (tracking hazardous waste))
Housing units lacking complete plumbing facilities: 0.9% Housing units lacking complete kitchen facilities: 0.9%
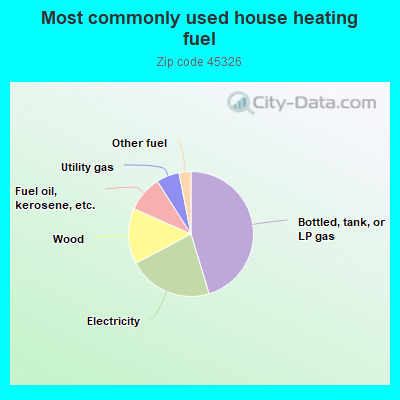
45.7%Bottled, tank, or LP gas
22.1%Electricity
14.5%Wood
9.4%Fuel oil, kerosene, etc.
6.0%Utility gas
3.1%Other fuel
Population in 1990: 1,752.
Place of birth for U.S.-born residents:
This state: 1,172
Northeast: 21
Midwest: 9
South: 71
West: 2
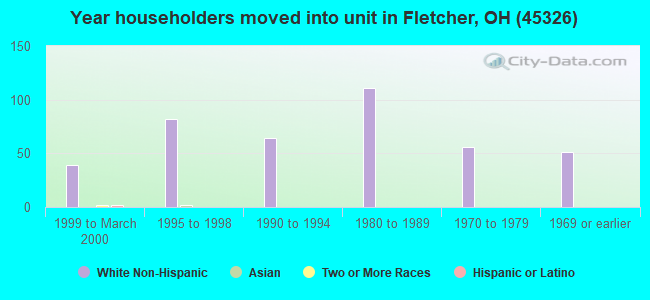
71% of the 45326 zip code residents lived in the same house 5 years ago. Out of people who lived in different houses, 64% lived in this county. Out of people who lived in different counties, 50% lived in Ohio.
100% of the 45326 zip code residents lived in the same house 1 year ago.
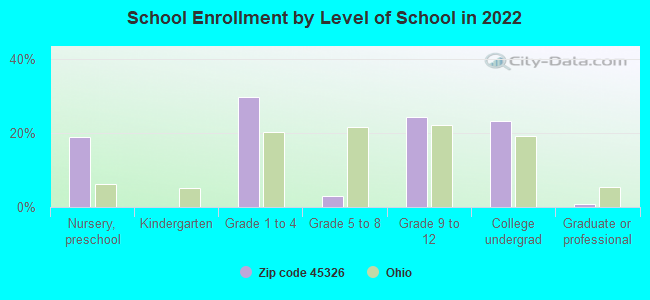
Private vs. public school enrollment:
Students in private schools in grades 1 to 8 (elementary and middle school):
Here:
0.0%
Ohio:
16.0%
Students in private schools in grades 9 to 12 (high school):
Here:
0.0%
Ohio:
13.1%
Students in private undergraduate colleges:
Here:
0.0%
Ohio:
22.3%
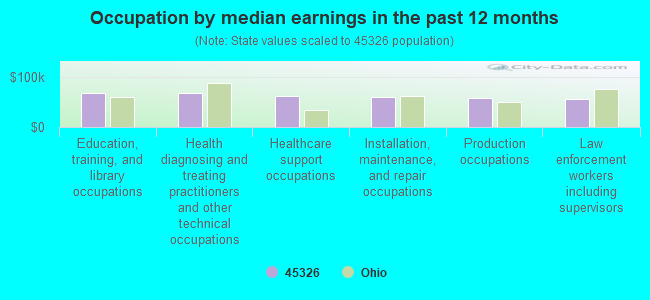
Occupation by median earnings in the past 12 months ($)
68,899Education, training, and library occupations
67,921Health diagnosing and treating practitioners and other technical occupations
62,182Healthcare support occupations
59,912Installation, maintenance, and repair occupations
57,366Production occupations
55,580Law enforcement workers including supervisors
Top industries in this zip code by the number of employees in 2005:
Wholesale Trade: Computer and Computer Peripheral Equipment and Software Merchant Wholesalers (20-49 employees: 1 establishment)
Construction: Plumbing, Heating, and Air-Conditioning Contractors (20-49: 1)
Other Services (except Public Administration): General Automotive Repair (10-19: 1, 1-4: 1)
Wholesale Trade: Service Establishment Equipment and Supplies Merchant Wholesalers (10-19: 1)
Other Services (except Public Administration): Religious Organizations (10-19: 1)
Other Services (except Public Administration): Funeral Homes and Funeral Services (1-4: 2)
Administrative and Support and Waste Management and Remediation Services: Janitorial Services (1-4: 1)
Fatal accident statistics in 2014:
Fatal accident count: 1
Vehicles involved in fatal accidents: 2
Fatal accidents caused by drunken drivers: 0
Fatalities: 2
Persons involved in fatal accidents: 3
Pedestrians involved in fatal accidents: 0
Home Mortgage Disclosure Act Aggregated Statistics For Year 2009 (Based on 2 partial tracts)
A) FHA, FSA/RHS & VA Home Purchase Loans
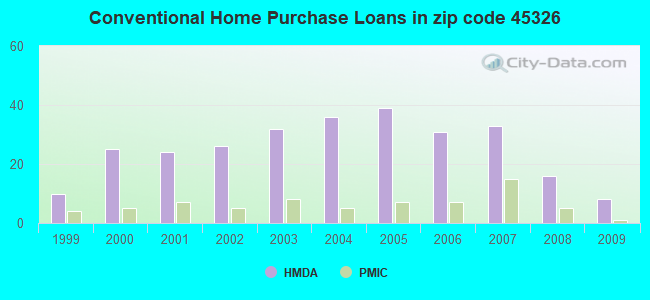
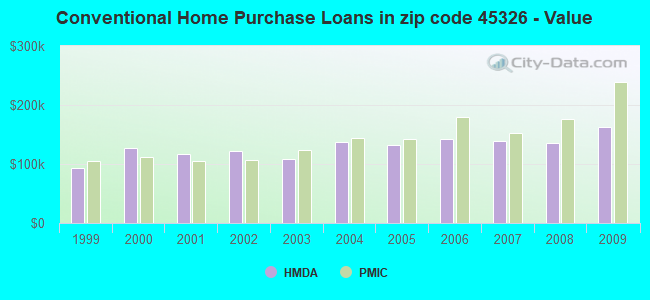
B) Conventional Home Purchase Loans
C) Refinancings
D) Home Improvement Loans
F) Non-occupant Loans on < 5 Family Dwellings (A B C & D)
G) Loans On Manufactured Home Dwelling (A B C & D)
Number
Average Value
Number
Average Value
Number
Average Value
Number
Average Value
Number
Average Value
Number
Average Value
LOANS ORIGINATED
4
$106,575
8
$163,006
87
$144,471
3
$119,530
3
$159,713
1
$28,220
APPLICATIONS APPROVED, NOT ACCEPTED
0
$0
1
$71,310
9
$159,144
1
$49,250
0
$0
1
$32,320
APPLICATIONS DENIED
4
$104,525
2
$270,865
37
$136,125
2
$10,005
0
$0
1
$30,270
APPLICATIONS WITHDRAWN
0
$0
1
$101,570
8
$150,950
1
$79,520
0
$0
0
$0
FILES CLOSED FOR INCOMPLETENESS
0
$0
0
$0
1
$132,870
0
$0
0
$0
0
$0
Aggregated Statistics For Year 2008 (Based on 2 partial tracts)
A) FHA, FSA/RHS & VA Home Purchase Loans
B) Conventional Home Purchase Loans
C) Refinancings
D) Home Improvement Loans
F) Non-occupant Loans on < 5 Family Dwellings (A B C & D)
G) Loans On Manufactured Home Dwelling (A B C & D)
Number
Average Value
Number
Average Value
Number
Average Value
Number
Average Value
Number
Average Value
Number
Average Value
LOANS ORIGINATED
9
$124,146
16
$136,330
39
$126,395
5
$106,294
2
$76,435
0
$0
APPLICATIONS APPROVED, NOT ACCEPTED
0
$0
0
$0
4
$136,072
0
$0
0
$0
0
$0
APPLICATIONS DENIED
1
$149,280
5
$172,880
26
$133,479
3
$57,457
0
$0
1
$68,230
APPLICATIONS WITHDRAWN
1
$47,710
2
$155,440
13
$130,026
1
$13,340
0
$0
0
$0
FILES CLOSED FOR INCOMPLETENESS
0
$0
0
$0
2
$103,625
1
$4,620
0
$0
0
$0
Aggregated Statistics For Year 2007 (Based on 2 partial tracts)
A) FHA, FSA/RHS & VA Home Purchase Loans
B) Conventional Home Purchase Loans
C) Refinancings
D) Home Improvement Loans
F) Non-occupant Loans on < 5 Family Dwellings (A B C & D)
G) Loans On Manufactured Home Dwelling (A B C & D)
Number
Average Value
Number
Average Value
Number
Average Value
Number
Average Value
Number
Average Value
Number
Average Value
LOANS ORIGINATED
3
$113,373
33
$138,836
38
$125,942
8
$59,765
4
$86,185
1
$96,440
APPLICATIONS APPROVED, NOT ACCEPTED
0
$0
4
$154,798
11
$106,425
2
$27,190
1
$26,160
1
$20,010
APPLICATIONS DENIED
1
$60,020
9
$157,548
30
$124,385
9
$45,886
2
$74,640
0
$0
APPLICATIONS WITHDRAWN
1
$214,430
2
$54,120
9
$90,858
1
$17,440
1
$33,340
0
$0
FILES CLOSED FOR INCOMPLETENESS
0
$0
1
$56,430
2
$165,440
0
$0
0
$0
0
$0
Aggregated Statistics For Year 2006 (Based on 2 partial tracts)
A) FHA, FSA/RHS & VA Home Purchase Loans
B) Conventional Home Purchase Loans
C) Refinancings
D) Home Improvement Loans
F) Non-occupant Loans on < 5 Family Dwellings (A B C & D)
G) Loans On Manufactured Home Dwelling (A B C & D)
Number
Average Value
Number
Average Value
Number
Average Value
Number
Average Value
Number
Average Value
Number
Average Value
LOANS ORIGINATED
2
$113,630
31
$141,869
57
$116,640
9
$39,558
4
$75,028
2
$114,400
APPLICATIONS APPROVED, NOT ACCEPTED
0
$0
5
$140,972
10
$113,630
5
$117,374
1
$7,700
0
$0
APPLICATIONS DENIED
0
$0
9
$153,330
40
$133,572
6
$67,802
2
$160,055
2
$74,900
APPLICATIONS WITHDRAWN
0
$0
3
$134,577
18
$118,503
2
$94,390
1
$147,230
0
$0
FILES CLOSED FOR INCOMPLETENESS
0
$0
2
$194,685
6
$174,335
2
$20,520
1
$41,550
0
$0
Aggregated Statistics For Year 2005 (Based on 2 partial tracts)
A) FHA, FSA/RHS & VA Home Purchase Loans
B) Conventional Home Purchase Loans
C) Refinancings
D) Home Improvement Loans
F) Non-occupant Loans on < 5 Family Dwellings (A B C & D)
G) Loans On Manufactured Home Dwelling (A B C & D)
Number
Average Value
Number
Average Value
Number
Average Value
Number
Average Value
Number
Average Value
Number
Average Value
LOANS ORIGINATED
3
$128,763
39
$132,827
67
$112,783
9
$52,953
2
$55,150
2
$86,955
APPLICATIONS APPROVED, NOT ACCEPTED
0
$0
2
$122,350
18
$110,865
2
$74,900
1
$31,290
1
$14,880
APPLICATIONS DENIED
1
$81,050
11
$88,423
40
$114,514
7
$109,856
2
$55,150
1
$81,050
APPLICATIONS WITHDRAWN
0
$0
6
$139,963
17
$137,364
2
$82,595
1
$72,850
0
$0
FILES CLOSED FOR INCOMPLETENESS
0
$0
2
$150,820
6
$110,467
0
$0
1
$68,230
0
$0
Aggregated Statistics For Year 2004 (Based on 2 partial tracts)
A) FHA, FSA/RHS & VA Home Purchase Loans
B) Conventional Home Purchase Loans
C) Refinancings
D) Home Improvement Loans
F) Non-occupant Loans on < 5 Family Dwellings (A B C & D)
G) Loans On Manufactured Home Dwelling (A B C & D)
Number
Average Value
Number
Average Value
Number
Average Value
Number
Average Value
Number
Average Value
Number
Average Value
LOANS ORIGINATED
3
$108,587
36
$137,798
71
$126,169
9
$87,780
2
$70,795
1
$61,560
APPLICATIONS APPROVED, NOT ACCEPTED
0
$0
4
$104,268
17
$72,544
1
$11,800
1
$47,200
1
$58,480
APPLICATIONS DENIED
1
$161,080
7
$172,149
38
$92,677
7
$33,931
3
$64,637
0
$0
APPLICATIONS WITHDRAWN
0
$0
3
$129,447
25
$120,842
2
$73,615
0
$0
0
$0
FILES CLOSED FOR INCOMPLETENESS
0
$0
1
$69,770
4
$126,710
1
$91,310
1
$45,660
0
$0
Aggregated Statistics For Year 2003 (Based on 2 partial tracts)
A) FHA, FSA/RHS & VA Home Purchase Loans
B) Conventional Home Purchase Loans
C) Refinancings
D) Home Improvement Loans
F) Non-occupant Loans on < 5 Family Dwellings (A B C & D)
Number
Average Value
Number
Average Value
Number
Average Value
Number
Average Value
Number
Average Value
LOANS ORIGINATED
6
$100,377
32
$109,301
143
$119,945
5
$18,058
3
$52,667
APPLICATIONS APPROVED, NOT ACCEPTED
1
$114,910
3
$110,293
17
$107,308
1
$17,440
3
$69,940
APPLICATIONS DENIED
1
$86,180
6
$75,838
49
$101,637
8
$15,454
2
$69,510
APPLICATIONS WITHDRAWN
0
$0
2
$72,845
38
$102,006
0
$0
1
$41,040
FILES CLOSED FOR INCOMPLETENESS
0
$0
2
$62,075
8
$122,030
0
$0
0
$0
Aggregated Statistics For Year 2002 (Based on 2 partial tracts)
A) FHA, FSA/RHS & VA Home Purchase Loans
B) Conventional Home Purchase Loans
C) Refinancings
D) Home Improvement Loans
F) Non-occupant Loans on < 5 Family Dwellings (A B C & D)
Number
Average Value
Number
Average Value
Number
Average Value
Number
Average Value
Number
Average Value
LOANS ORIGINATED
6
$102,600
26
$122,390
104
$112,638
4
$23,855
3
$102,600
APPLICATIONS APPROVED, NOT ACCEPTED
1
$40,010
4
$110,808
14
$99,486
1
$15,390
0
$0
APPLICATIONS DENIED
1
$31,290
5
$107,422
31
$134,274
4
$27,830
2
$65,665
APPLICATIONS WITHDRAWN
2
$99,265
3
$106,363
20
$105,524
0
$0
0
$0
FILES CLOSED FOR INCOMPLETENESS
1
$41,550
1
$193,910
5
$125,070
0
$0
0
$0
Aggregated Statistics For Year 2001 (Based on 2 partial tracts)
A) FHA, FSA/RHS & VA Home Purchase Loans
B) Conventional Home Purchase Loans
C) Refinancings
D) Home Improvement Loans
F) Non-occupant Loans on < 5 Family Dwellings (A B C & D)
Number
Average Value
Number
Average Value
Number
Average Value
Number
Average Value
Number
Average Value
LOANS ORIGINATED
4
$102,088
24
$116,772
95
$106,094
12
$19,922
3
$47,537
APPLICATIONS APPROVED, NOT ACCEPTED
1
$116,960
2
$198,275
15
$73,188
2
$12,825
1
$50,790
APPLICATIONS DENIED
1
$41,550
1
$48,730
38
$98,968
10
$13,184
1
$30,780
APPLICATIONS WITHDRAWN
1
$41,550
2
$75,410
21
$95,076
3
$11,970
0
$0
FILES CLOSED FOR INCOMPLETENESS
0
$0
1
$145,690
4
$83,875
0
$0
0
$0
Aggregated Statistics For Year 2000 (Based on 2 partial tracts)
A) FHA, FSA/RHS & VA Home Purchase Loans
B) Conventional Home Purchase Loans
C) Refinancings
D) Home Improvement Loans
F) Non-occupant Loans on < 5 Family Dwellings (A B C & D)
Number
Average Value
Number
Average Value
Number
Average Value
Number
Average Value
Number
Average Value
LOANS ORIGINATED
3
$102,943
25
$126,383
29
$89,050
16
$18,789
2
$300,875
APPLICATIONS APPROVED, NOT ACCEPTED
0
$0
3
$75,410
12
$76,009
4
$12,440
0
$0
APPLICATIONS DENIED
1
$24,620
5
$95,418
23
$97,916
8
$20,328
0
$0
APPLICATIONS WITHDRAWN
0
$0
2
$73,105
7
$80,834
1
$5,130
0
$0
FILES CLOSED FOR INCOMPLETENESS
0
$0
1
$56,430
2
$53,350
0
$0
0
$0
Aggregated Statistics For Year 1999 (Based on 1 partial tract)
A) FHA, FSA/RHS & VA Home Purchase Loans
B) Conventional Home Purchase Loans
C) Refinancings
D) Home Improvement Loans
F) Non-occupant Loans on < 5 Family Dwellings (A B C & D)
Detailed PMIC statistics for the following Tracts:3901.00
2003 - 2018 National Fire Incident Reporting System (NFIRS) incidents
Based on the data from the years 2003 - 2018 the average number of fires per year is 12. The highest number of reported fires - 29 took place in 2008, and the least - 1 in 2004. The data has an increasing trend.
When looking into fire subcategories, the most incidents belonged to: Structure Fires (51.5%), and Outside Fires (39.9%).
Fire incident types reported to NFIRS in Zip Code 45326


 Nearest zip codes: 45312, 45389, 45317, 45356, 43072, 45373.


 Based on the data from the years 2003 - 2018 the average number of fires per year is 12. The highest number of reported fires - 29 took place in 2008, and the least - 1 in 2004. The data has an increasing trend.
 When looking into fire subcategories, the most incidents belonged to: Structure Fires (51.5%), and Outside Fires (39.9%).