Estimated zip code population in 2022: 1,733 Zip code population in 2010: 1,690 Zip code population in 2000: 2,112
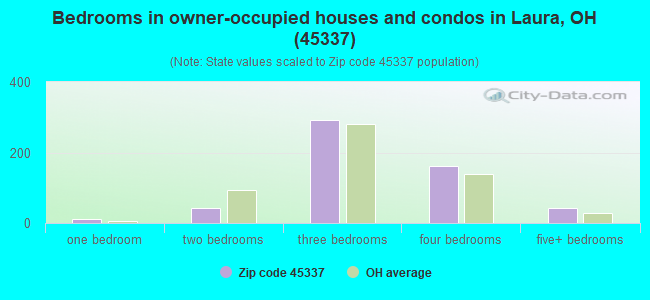
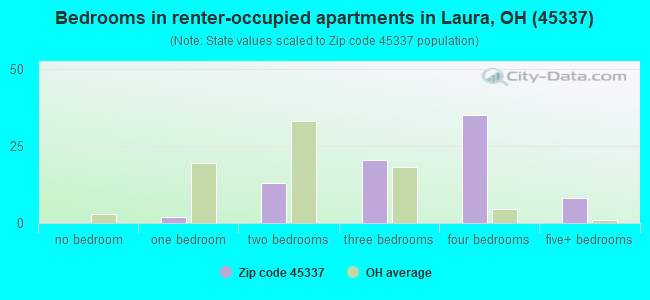
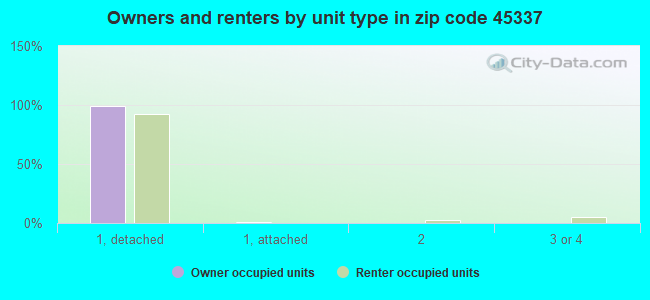
Houses and condos: 659 Renter-occupied apartments: 81
% of renters here:
13%
State:
33%
March 2022 cost of living index in zip code 45337: 83.9 (less than average, U.S. average is 100)
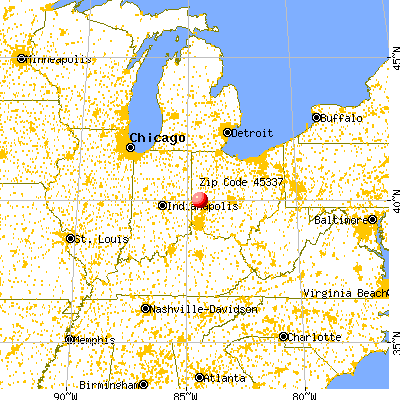
Land area: 20.5 sq. mi. Water area: 0.0 sq. mi.
Population density: 85 people per square mile
(very low).
OSM Map
General Map
Google Map
MSN Map
OSM Map
General Map
Google Map
MSN Map
OSM Map
General Map
Google Map
MSN Map
OSM Map
General Map
Google Map
MSN Map
Please wait while loading the map...
Real estate property taxes paid for housing units in 2022:
This zip code:
0.8% ($1,969)
Ohio:
1.3% ($2,639)
Median real estate property taxes paid for housing units with mortgages in 2022: $2,426 (0.8%) Median real estate property taxes paid for housing units with no mortgage in 2022: $1,411 (0.8%)
Business Search- 14 Million verified businesses
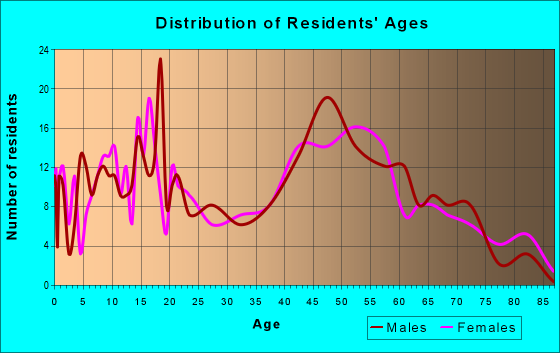
Males: 868
(50.1%)
Females: 864
(49.9%)
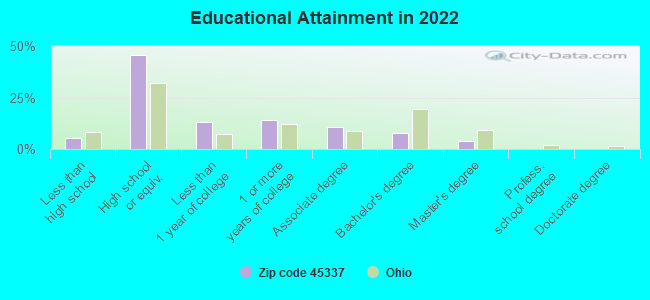
For population 25 years and over in 45337:
High school or higher: 93.8%
Bachelor's degree or higher: 11.5%
Graduate or professional degree: 4.0%
Unemployed: 2.0%
Mean travel time to work (commute): 33.3 minutes
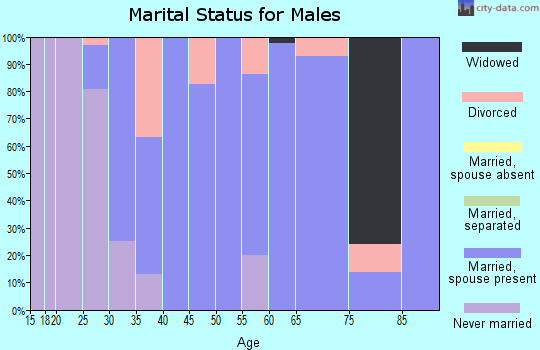
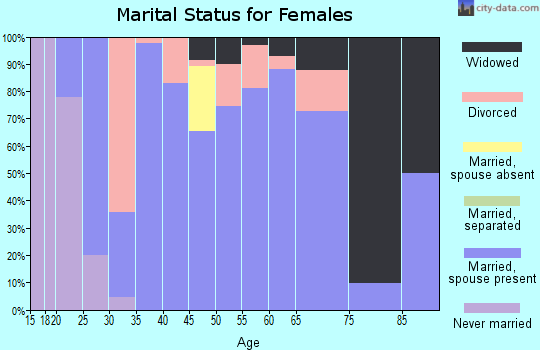
For population 15 years and over in 45337:
Never married: 22.0%
Now married: 65.0%
Separated: 0.1%
Widowed: 3.4%
Divorced: 9.6%
Zip code 45337 compared to state average:
Unemployed percentage below state average.
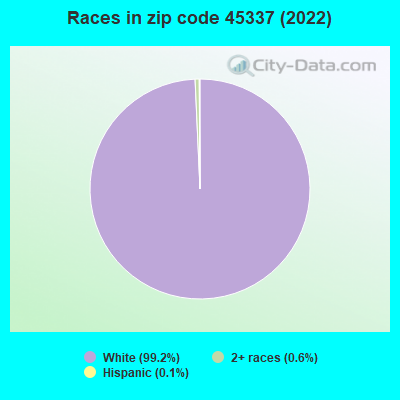
Black race population percentage significantly below state average.
Hispanic race population percentage significantly below state average.
Foreign-born population percentage significantly below state average.
Renting percentage significantly below state average.
Length of stay since moving in significantly above state average.
Percentage of population with a bachelor's degree or higher significantly below state average.
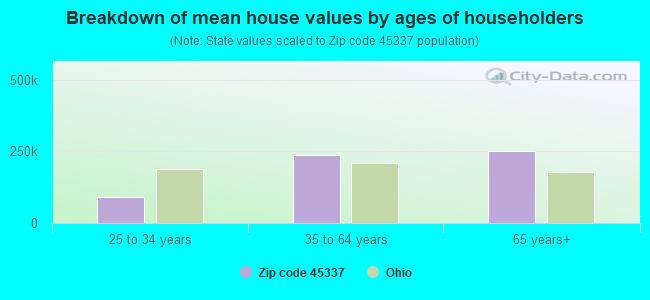
Estimated median house/condo value in 2022: $246,746
45337:
$246,746
Ohio:
$204,100
According to our research of Ohio and other state lists, there were 3 registered sex offenders living in 45337 zip code as of April 16, 2024. The ratio of all residents to sex offenders in zip code 45337 is 554 to 1. The ratio of registered sex offenders to all residents in this zip code is near the state average.
Median resident age:
This zip code:
39.0 years
Ohio median age:
39.9 years
Average household size:
This zip code:
2.7 people
Ohio:
2.4 people
Averages for the 2020 tax year for zip code 45337, filed in 2021:
Average Adjusted Gross Income (AGI) in 2020: $71,499 (Individual Income Tax Returns)
Here:
$71,499
State:
$67,288
Salary/wage: $54,857 (reported on 81.7% of returns)
Here:
$54,857
State:
$55,628
(% of AGI for various income ranges: 1069.2% for AGIs below $25k, 3577.3% for AGIs $25k-50k, 6332.5% for AGIs $50k-75k, 10547.1% for AGIs $75k-100k, 17815.0% for AGIs $100k-200k)
Taxable interest for individuals: $1,148 (reported on 32.9% of returns)
This zip code:
$1,148
Ohio:
$1,518
(% of AGI for various income ranges: 18.5% for AGIs below $25k, 24.0% for AGIs $25k-50k, 27.5% for AGIs $50k-75k, 21.4% for AGIs $75k-100k, 336.7% for AGIs $100k-200k)
Ordinary dividends: $2,088 (reported on 20.7% of returns)
Here:
$2,088
State:
$7,167
(% of AGI for various income ranges: 43.1% for AGIs below $25k, 23.3% for AGIs $25k-50k, 83.3% for AGIs $50k-75k, 57.1% for AGIs $75k-100k, 206.7% for AGIs $100k-200k)
Net capital gain/loss in AGI: +$10,813 (reported on 18.3% of returns)
Here:
+$10,813
State:
+$18,919
(% of AGI for various income ranges: 20.8% for AGIs below $25k, 57.3% for AGIs $25k-50k, 163.3% for AGIs $50k-75k, 102.9% for AGIs $75k-100k, 2068.3% for AGIs $100k-200k)
Profit/loss from business: +$9,115 (reported on 15.9% of returns)
Here:
+$9,115
State:
+$13,744
(% of AGI for various income ranges: 334.6% for AGIs below $25k, 312.5% for AGIs $50k-75k, 184.3% for AGIs $75k-100k, 410.0% for AGIs $100k-200k)
Taxable individual retirement arrangement distribution: $14,600 (reported on 9.8% of returns)
45337:
$14,600
Ohio:
$18,876
(% of AGI for various income ranges: 142.3% for AGIs below $25k, 345.0% for AGIs $50k-75k, 948.3% for AGIs $100k-200k)
Total itemized deductions: $22,167 (reported on 3.7% of returns)
Here:
$22,167
State:
$33,869
(% of AGI for various income ranges: 950.0% for AGIs $75k-100k)
Charity contributions: $12,650 (reported on 2.4% of returns)
Here:
$12,650
State:
$14,577
(% of AGI for various income ranges: 210.8% for AGIs $50k-75k)
Taxes paid: $6,667 (reported on 3.7% of returns)
45337:
$6,667
State:
$7,681
(% of AGI for various income ranges: 285.7% for AGIs $75k-100k)
Earned income credit: $2,325 (reported on 9.8% of returns)
Here:
$2,325
State:
$2,304
(% of AGI for various income ranges: 67.7% for AGIs below $25k, 65.3% for AGIs $25k-50k)
Percentage of individuals using paid preparers for their 2020 taxes: 92.7%
Here:
93%
State:
94%
(% for various income ranges: 90.0% for AGIs below $25k, 95.0% for AGIs $25k-50k, 94.1% for AGIs $50k-75k, 90.9% for AGIs $75k-100k, 91.7% for AGIs $100k-200k, 100.0% for AGIs over 200k)
Averages for the 2012 tax year for zip code 45337, filed in 2013:
Average Adjusted Gross Income (AGI) in 2012: $52,577 (Individual Income Tax Returns)
Here:
$52,577
State:
$54,926
Salary/wage: $42,011 (reported on 82.8% of returns)
Here:
$42,011
State:
$45,869
(% of AGI for various income ranges: 69.1% for AGIs below $25k, 74.5% for AGIs $25k-50k, 74.1% for AGIs $50k-75k, 69.3% for AGIs $75k-100k, 55.4% for AGIs $100k-200k)
Taxable interest for individuals: $872 (reported on 33.3% of returns)
This zip code:
$872
Ohio:
$1,297
(% of AGI for various income ranges: 0.9% for AGIs below $25k, 0.7% for AGIs $25k-50k, 0.4% for AGIs $50k-75k, 0.2% for AGIs $75k-100k, 0.6% for AGIs $100k-200k)
Ordinary dividends: $1,806 (reported on 18.4% of returns)
Here:
$1,806
State:
$5,821
(% of AGI for various income ranges: 1.1% for AGIs below $25k, 0.8% for AGIs $25k-50k, 0.6% for AGIs $50k-75k, 0.8% for AGIs $75k-100k, 0.4% for AGIs $100k-200k)
Net capital gain/loss in AGI: +$992 (reported on 14.9% of returns)
Here:
+$992
State:
+$11,232
(% of AGI for various income ranges: 0.4% for AGIs $50k-75k, 0.8% for AGIs $100k-200k)
Profit/loss from business: +$8,829 (reported on 16.1% of returns)
Here:
+$8,829
State:
+$12,773
(% of AGI for various income ranges: 3.1% for AGIs below $25k, 4.6% for AGIs $25k-50k, 7.0% for AGIs $50k-75k, 0.6% for AGIs $100k-200k)
Taxable individual retirement arrangement distribution: $9,970 (reported on 11.5% of returns)
45337:
$9,970
Ohio:
$14,511
(% of AGI for various income ranges: 3.5% for AGIs below $25k, 4.3% for AGIs $25k-50k, 6.1% for AGIs $75k-100k)
Total itemized deductions: $19,570 (20% of AGI, reported on 26.4% of returns)
Here:
$19,570
State:
$21,278
Here:
19.9% of AGI
State:
18.8% of AGI
(% of AGI for various income ranges: 6.9% for AGIs below $25k, 5.6% for AGIs $25k-50k, 9.0% for AGIs $50k-75k, 12.5% for AGIs $75k-100k, 12.1% for AGIs $100k-200k)
Charity contributions: $4,241 (reported on 19.5% of returns)
Here:
$4,241
State:
$3,943
(% of AGI for various income ranges: 0.7% for AGIs $25k-50k, 1.1% for AGIs $50k-75k, 1.8% for AGIs $75k-100k, 2.5% for AGIs $100k-200k)
Taxes paid: $7,935 (reported on 26.4% of returns)
45337:
$7,935
State:
$9,568
(% of AGI for various income ranges: 2.2% for AGIs $25k-50k, 3.0% for AGIs $50k-75k, 4.6% for AGIs $75k-100k, 6.1% for AGIs $100k-200k)
Earned income credit: $2,009 (reported on 12.6% of returns)
Here:
$2,009
State:
$2,285
(% of AGI for various income ranges: 4.0% for AGIs below $25k, 0.8% for AGIs $25k-50k)
Percentage of individuals using paid preparers for their 2012 taxes: 55.2%
Here:
55%
State:
51%
(% for various income ranges: 43.3% for AGIs below $25k, 57.7% for AGIs $25k-50k, 69.2% for AGIs $50k-75k, 66.7% for AGIs $75k-100k, 55.6% for AGIs $100k-200k)
Averages for the 2004 tax year for zip code 45337, filed in 2005:
Average Adjusted Gross Income (AGI) in 2004: $39,768 (Individual Income Tax Returns)
Here:
$39,768
State:
$44,480
Salary/wage: $36,585 (reported on 88.0% of returns)
Here:
$36,585
State:
$39,198
(% of AGI for various income ranges: 137.9% for AGIs below $10k, 71.3% for AGIs $10k-25k, 82.2% for AGIs $25k-50k, 77.9% for AGIs $50k-75k, 87.2% for AGIs $75k-100k, 78.2% for AGIs over 100k)
Taxable interest for individuals: $973 (reported on 45.2% of returns)
This zip code:
$973
Ohio:
$1,532
(% of AGI for various income ranges: 6.2% for AGIs below $10k, 2.0% for AGIs $10k-25k, 1.2% for AGIs $25k-50k, 0.5% for AGIs $50k-75k, 0.3% for AGIs $75k-100k, 1.4% for AGIs over 100k)
Taxable dividends: $1,028 (reported on 24.2% of returns)
Here:
$1,028
State:
$3,496
(% of AGI for various income ranges: 5.5% for AGIs below $10k, 0.6% for AGIs $10k-25k, 0.7% for AGIs $25k-50k, 0.5% for AGIs $50k-75k, 0.1% for AGIs $75k-100k, 0.7% for AGIs over 100k)
Net capital gain/loss: +$1,247 (reported on 18.0% of returns)
Here:
+$1,247
State:
+$8,582
(% of AGI for various income ranges: -3.0% for AGIs below $10k, 0.6% for AGIs $10k-25k, -0.2% for AGIs $25k-50k, 1.1% for AGIs $50k-75k, -0.4% for AGIs $75k-100k, 2.0% for AGIs over 100k)
Profit/loss from business: +$7,188 (reported on 16.0% of returns)
Here:
+$7,188
State:
+$10,813
(% of AGI for various income ranges: 1.9% for AGIs below $10k, 5.7% for AGIs $10k-25k, 3.0% for AGIs $25k-50k, 5.5% for AGIs $50k-75k, -0.1% for AGIs $75k-100k)
Profit/loss from farming: +$1,018 (reported on 6.1% of returns)
Here:
+$1,018
State:
-$3,706
(% of AGI for various income ranges: -11.7% for AGIs below $10k, 0.4% for AGIs $25k-50k, -0.0% for AGIs $50k-75k, 1.8% for AGIs $75k-100k)
IRA payment deduction: $2,875 (reported on 1.8% of returns)
45337:
$2,875
Ohio:
$2,794
Total itemized deductions: $14,910 (22% of AGI, reported on 32.2% of returns)
Here:
$14,910
State:
$17,503
Here:
22.3% of AGI
State:
20.8% of AGI
(% of AGI for various income ranges: 9.3% for AGIs $10k-25k, 10.8% for AGIs $25k-50k, 13.6% for AGIs $50k-75k, 14.6% for AGIs $75k-100k, 12.4% for AGIs over 100k)
Charity contributions deductions: $2,856 (4% of AGI, reported on 23.1% of returns)
Here:
$2,856
State:
$3,087
Here:
3.9% of AGI
State:
3.4% of AGI
(% of AGI for various income ranges: 0.6% for AGIs $10k-25k, 1.3% for AGIs $25k-50k, 1.6% for AGIs $50k-75k, 2.4% for AGIs $75k-100k, 2.5% for AGIs over 100k)
Total tax: $4,895 (reported on 79.4% of returns)
45337:
$4,895
State:
$6,781
(% of AGI for various income ranges: 2.6% for AGIs below $10k, 4.9% for AGIs $10k-25k, 6.9% for AGIs $25k-50k, 9.4% for AGIs $50k-75k, 10.5% for AGIs $75k-100k, 17.4% for AGIs over 100k)
Earned income credit: $1,600 (reported on 9.4% of returns)
Here:
$1,600
State:
$1,696
Percentage of individuals using paid preparers for their 2004 taxes: 60.8%
Here:
61%
State:
55%
(% for various income ranges: 53.1% for AGIs below $10k, 60.9% for AGIs $10k-25k, 68.3% for AGIs $25k-50k, 61.7% for AGIs $50k-75k, 52.3% for AGIs $75k-100k, 54.8% for AGIs over 100k)
Household received Food Stamps/SNAP in the past 12 months: 40 Household did not receive Food Stamps/SNAP in the past 12 months: 589
Women who had a birth in the past 12 months: 10 (3 now married, 7 unmarried) Women who did not have a birth in the past 12 months: 423 (224 now married, 198 unmarried)
Housing units in zip code 45337 with a mortgage: 341 (104 second mortgage, 106 both second mortgage and home equity loan) Houses without a mortgage: 18
Median monthly owner costs for units with a mortgage: $1,644 Median monthly owner costs for units without a mortgage: $442
Residents with income below the poverty level in 2022:
This zip code:
5.3%
Whole state:
13.4%
Residents with income below 50% of the poverty level in 2022:
This zip code:
0.8%
Whole state:
7.0%
Median number of rooms in houses and condos:
Here:
6.3
State:
6.7
Median number of rooms in apartments:
Here:
7.7
State:
4.4
Notable locations in this zip code not listed on our city pages
Notable locations in zip code 45337: Laura Wastewater Treatment Plant (A), Weaver Swine Farm (B), Laura Fire Company (C). Display/hide their locations on the map
Size of family households: 219 2-persons, 113 3-persons, 101 4-persons, 36 5-persons, 25 6-persons, 9 7-or-more-persons
Size of nonfamily households: 113 1-person, 7 2-persons
321 married couples with children.
135 single-parent households (16 men, 119 women).
99.5% of residents of 45337 zip code speak English at home.
Foreign born population: 0 (0.0%)
:
0.0%
Whole state:
5.0%
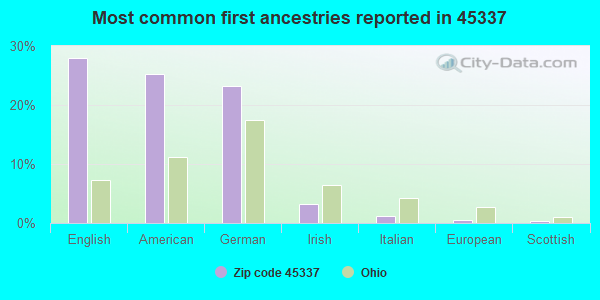
28%English
25%American
23%German
3%Irish
1%Italian
0%European
0%Scottish
Housing units lacking complete kitchen facilities: 2.1%
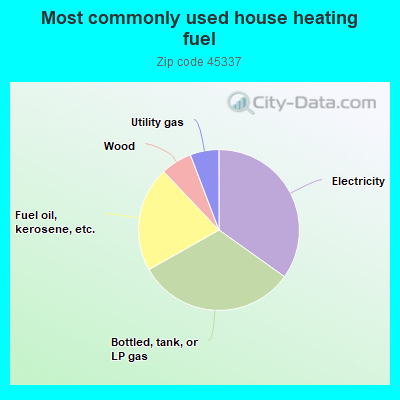
35.0%Electricity
32.1%Bottled, tank, or LP gas
21.2%Fuel oil, kerosene, etc.
6.3%Wood
5.8%Utility gas
Population in 1990: 2,602.
Place of birth for U.S.-born residents:
This state: 1,612
Northeast: 2
Midwest: 19
South: 89
West: 6
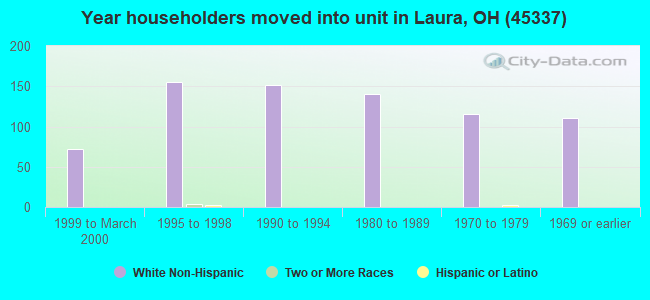
67% of the 45337 zip code residents lived in the same house 5 years ago. Out of people who lived in different houses, 61% lived in this county. Out of people who lived in different counties, 50% lived in Ohio.
95% of the 45337 zip code residents lived in the same house 1 year ago. Out of people who lived in different houses, 71% moved from this county. Out of people who lived in different houses, 27% moved from different county within same state. Out of people who lived in different houses, 5% moved from different state.
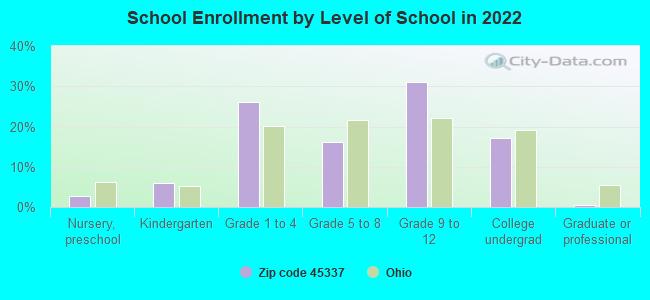
Private vs. public school enrollment:
Students in private schools in grades 1 to 8 (elementary and middle school): 2
Here:
1.2%
Ohio:
16.0%
Students in private schools in grades 9 to 12 (high school): 1
Here:
0.8%
Ohio:
13.1%
Students in private undergraduate colleges: 28
Here:
39.3%
Ohio:
22.3%
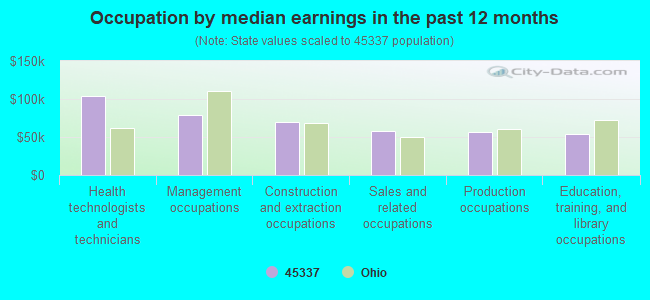
Occupation by median earnings in the past 12 months ($)
103,518Health technologists and technicians
79,588Management occupations
70,293Construction and extraction occupations
58,216Sales and related occupations
56,822Production occupations
54,413Education, training, and library occupations
Companies with federal contracts located in this zip code:
MOTE, KEVIN PETROLEUM DISTRIBU (11611 W STATE ROUTE 571 in LAURA, OH; small business)
$28,000 with Air Force for Liquid Propellants and Fuels, Petroleum Base. Signed on 2003-04-14. Completion date: 2003-05-11.
Top industries in this zip code by the number of employees in 2005:
Construction: All Other Specialty Trade Contractors (20-49 employees: 1 establishment)
Accommodation and Food Services: Full-Service Restaurants (10-19: 2)
Accommodation and Food Services: Limited-Service Restaurants (10-19: 1)
Other Services (except Public Administration): Religious Organizations (5-9: 1, 1-4: 2)
Finance and Insurance: Insurance Agencies and Brokerages (5-9: 1)
Home Mortgage Disclosure Act Aggregated Statistics For Year 2009 (Based on 4 partial tracts)
A) FHA, FSA/RHS & VA Home Purchase Loans
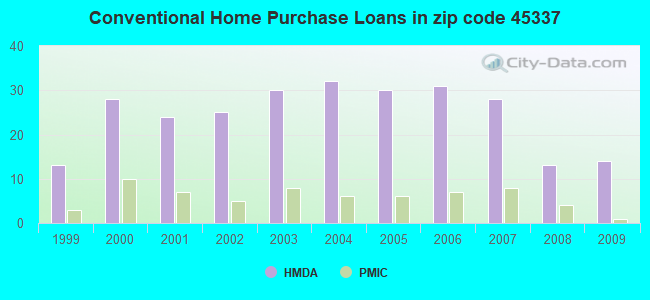
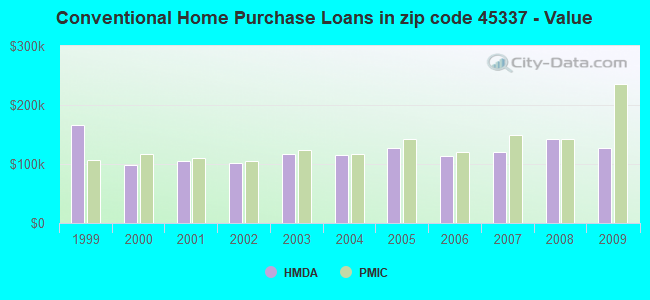
B) Conventional Home Purchase Loans
C) Refinancings
D) Home Improvement Loans
F) Non-occupant Loans on < 5 Family Dwellings (A B C & D)
G) Loans On Manufactured Home Dwelling (A B C & D)
Number
Average Value
Number
Average Value
Number
Average Value
Number
Average Value
Number
Average Value
Number
Average Value
LOANS ORIGINATED
10
$111,019
14
$127,169
73
$124,327
4
$60,328
3
$72,510
0
$0
APPLICATIONS APPROVED, NOT ACCEPTED
0
$0
2
$119,980
4
$134,218
0
$0
0
$0
0
$0
APPLICATIONS DENIED
3
$74,597
1
$85,180
25
$126,424
1
$26,580
1
$131,910
1
$96,070
APPLICATIONS WITHDRAWN
3
$74,550
2
$190,850
10
$118,821
0
$0
1
$47,520
0
$0
FILES CLOSED FOR INCOMPLETENESS
1
$76,180
0
$0
2
$76,980
0
$0
0
$0
0
$0
Aggregated Statistics For Year 2008 (Based on 4 partial tracts)
A) FHA, FSA/RHS & VA Home Purchase Loans
B) Conventional Home Purchase Loans
C) Refinancings
D) Home Improvement Loans
F) Non-occupant Loans on < 5 Family Dwellings (A B C & D)
G) Loans On Manufactured Home Dwelling (A B C & D)
Number
Average Value
Number
Average Value
Number
Average Value
Number
Average Value
Number
Average Value
Number
Average Value
LOANS ORIGINATED
6
$110,815
13
$142,875
32
$124,915
5
$26,954
2
$64,145
1
$107,740
APPLICATIONS APPROVED, NOT ACCEPTED
1
$55,850
0
$0
5
$117,328
1
$9,570
0
$0
0
$0
APPLICATIONS DENIED
2
$80,835
4
$165,980
22
$137,500
4
$75,315
1
$78,690
0
$0
APPLICATIONS WITHDRAWN
2
$111,975
3
$176,183
7
$162,416
0
$0
0
$0
0
$0
FILES CLOSED FOR INCOMPLETENESS
0
$0
0
$0
0
$0
0
$0
0
$0
0
$0
Aggregated Statistics For Year 2007 (Based on 4 partial tracts)
A) FHA, FSA/RHS & VA Home Purchase Loans
B) Conventional Home Purchase Loans
C) Refinancings
D) Home Improvement Loans
F) Non-occupant Loans on < 5 Family Dwellings (A B C & D)
Number
Average Value
Number
Average Value
Number
Average Value
Number
Average Value
Number
Average Value
LOANS ORIGINATED
6
$120,053
28
$119,754
35
$106,140
7
$59,129
2
$81,995
APPLICATIONS APPROVED, NOT ACCEPTED
0
$0
2
$94,880
7
$90,549
2
$87,870
0
$0
APPLICATIONS DENIED
1
$84,580
5
$122,506
31
$113,697
8
$60,730
2
$87,020
APPLICATIONS WITHDRAWN
1
$73,880
5
$115,526
18
$123,754
1
$11,630
1
$67,680
FILES CLOSED FOR INCOMPLETENESS
0
$0
0
$0
2
$180,945
0
$0
0
$0
Aggregated Statistics For Year 2006 (Based on 4 partial tracts)
A) FHA, FSA/RHS & VA Home Purchase Loans
B) Conventional Home Purchase Loans
C) Refinancings
D) Home Improvement Loans
F) Non-occupant Loans on < 5 Family Dwellings (A B C & D)
G) Loans On Manufactured Home Dwelling (A B C & D)
Number
Average Value
Number
Average Value
Number
Average Value
Number
Average Value
Number
Average Value
Number
Average Value
LOANS ORIGINATED
4
$107,490
31
$113,021
43
$113,945
7
$45,037
3
$87,950
2
$51,415
APPLICATIONS APPROVED, NOT ACCEPTED
0
$0
5
$102,846
11
$110,421
2
$69,095
1
$62,690
0
$0
APPLICATIONS DENIED
1
$115,430
6
$121,900
32
$117,937
4
$69,550
0
$0
1
$63,920
APPLICATIONS WITHDRAWN
0
$0
3
$115,007
20
$123,874
2
$67,750
0
$0
0
$0
FILES CLOSED FOR INCOMPLETENESS
0
$0
0
$0
7
$169,521
0
$0
0
$0
0
$0
Aggregated Statistics For Year 2005 (Based on 4 partial tracts)
A) FHA, FSA/RHS & VA Home Purchase Loans
B) Conventional Home Purchase Loans
C) Refinancings
D) Home Improvement Loans
F) Non-occupant Loans on < 5 Family Dwellings (A B C & D)
G) Loans On Manufactured Home Dwelling (A B C & D)
Number
Average Value
Number
Average Value
Number
Average Value
Number
Average Value
Number
Average Value
Number
Average Value
LOANS ORIGINATED
2
$170,190
30
$127,963
49
$115,368
7
$46,480
3
$59,387
0
$0
APPLICATIONS APPROVED, NOT ACCEPTED
0
$0
2
$82,865
9
$114,403
1
$30,870
0
$0
0
$0
APPLICATIONS DENIED
0
$0
6
$96,495
33
$112,990
6
$58,273
1
$55,880
1
$106,380
APPLICATIONS WITHDRAWN
1
$114,920
4
$124,592
21
$122,446
2
$128,955
0
$0
0
$0
FILES CLOSED FOR INCOMPLETENESS
0
$0
2
$92,580
1
$193,620
0
$0
0
$0
0
$0
Aggregated Statistics For Year 2004 (Based on 4 partial tracts)
A) FHA, FSA/RHS & VA Home Purchase Loans
B) Conventional Home Purchase Loans
C) Refinancings
D) Home Improvement Loans
F) Non-occupant Loans on < 5 Family Dwellings (A B C & D)
G) Loans On Manufactured Home Dwelling (A B C & D)
Number
Average Value
Number
Average Value
Number
Average Value
Number
Average Value
Number
Average Value
Number
Average Value
LOANS ORIGINATED
3
$103,197
32
$115,292
67
$113,193
6
$51,455
2
$74,445
1
$90,180
APPLICATIONS APPROVED, NOT ACCEPTED
0
$0
4
$107,008
10
$97,743
1
$83,550
2
$60,105
0
$0
APPLICATIONS DENIED
0
$0
7
$89,361
33
$113,147
4
$35,830
0
$0
1
$52,060
APPLICATIONS WITHDRAWN
1
$41,750
3
$101,257
18
$117,157
2
$30,990
1
$59,750
0
$0
FILES CLOSED FOR INCOMPLETENESS
0
$0
0
$0
2
$145,110
1
$83,830
0
$0
0
$0
Aggregated Statistics For Year 2003 (Based on 4 partial tracts)
A) FHA, FSA/RHS & VA Home Purchase Loans
B) Conventional Home Purchase Loans
C) Refinancings
D) Home Improvement Loans
F) Non-occupant Loans on < 5 Family Dwellings (A B C & D)
Number
Average Value
Number
Average Value
Number
Average Value
Number
Average Value
Number
Average Value
LOANS ORIGINATED
6
$99,812
30
$116,412
152
$108,350
4
$23,182
4
$63,800
APPLICATIONS APPROVED, NOT ACCEPTED
0
$0
4
$107,450
13
$103,029
2
$15,885
1
$88,380
APPLICATIONS DENIED
1
$156,520
6
$96,978
37
$115,359
4
$11,042
2
$61,670
APPLICATIONS WITHDRAWN
0
$0
3
$79,303
24
$110,390
1
$123,110
0
$0
FILES CLOSED FOR INCOMPLETENESS
0
$0
1
$34,150
3
$141,450
0
$0
0
$0
Aggregated Statistics For Year 2002 (Based on 4 partial tracts)
A) FHA, FSA/RHS & VA Home Purchase Loans
B) Conventional Home Purchase Loans
C) Refinancings
D) Home Improvement Loans
F) Non-occupant Loans on < 5 Family Dwellings (A B C & D)
Number
Average Value
Number
Average Value
Number
Average Value
Number
Average Value
Number
Average Value
LOANS ORIGINATED
5
$110,410
25
$101,773
110
$103,745
5
$9,558
3
$68,790
APPLICATIONS APPROVED, NOT ACCEPTED
0
$0
3
$85,693
17
$108,998
1
$17,540
1
$55,460
APPLICATIONS DENIED
1
$139,460
6
$67,198
40
$97,262
4
$21,265
4
$77,032
APPLICATIONS WITHDRAWN
0
$0
3
$106,203
18
$115,321
0
$0
0
$0
FILES CLOSED FOR INCOMPLETENESS
1
$28,430
1
$64,690
7
$95,224
0
$0
1
$48,230
Aggregated Statistics For Year 2001 (Based on 4 partial tracts)
A) FHA, FSA/RHS & VA Home Purchase Loans
B) Conventional Home Purchase Loans
C) Refinancings
D) Home Improvement Loans
F) Non-occupant Loans on < 5 Family Dwellings (A B C & D)
Number
Average Value
Number
Average Value
Number
Average Value
Number
Average Value
Number
Average Value
LOANS ORIGINATED
8
$104,070
24
$105,454
90
$101,977
8
$24,458
3
$80,927
APPLICATIONS APPROVED, NOT ACCEPTED
0
$0
1
$38,740
17
$86,917
4
$22,670
2
$51,265
APPLICATIONS DENIED
0
$0
6
$70,157
30
$96,053
7
$12,290
1
$29,760
APPLICATIONS WITHDRAWN
0
$0
3
$93,093
26
$102,101
2
$30,890
0
$0
FILES CLOSED FOR INCOMPLETENESS
0
$0
0
$0
3
$115,867
0
$0
0
$0
Aggregated Statistics For Year 2000 (Based on 4 partial tracts)
A) FHA, FSA/RHS & VA Home Purchase Loans
B) Conventional Home Purchase Loans
C) Refinancings
D) Home Improvement Loans
F) Non-occupant Loans on < 5 Family Dwellings (A B C & D)
Number
Average Value
Number
Average Value
Number
Average Value
Number
Average Value
Number
Average Value
LOANS ORIGINATED
5
$89,002
28
$97,542
32
$82,564
12
$17,588
3
$77,573
APPLICATIONS APPROVED, NOT ACCEPTED
1
$36,560
3
$42,107
11
$85,012
4
$26,938
0
$0
APPLICATIONS DENIED
1
$99,110
3
$75,700
27
$76,742
7
$18,261
1
$56,650
APPLICATIONS WITHDRAWN
0
$0
1
$133,070
9
$88,101
2
$35,465
0
$0
FILES CLOSED FOR INCOMPLETENESS
0
$0
0
$0
4
$81,975
0
$0
0
$0
Aggregated Statistics For Year 1999 (Based on 2 partial tracts)
A) FHA, FSA/RHS & VA Home Purchase Loans
B) Conventional Home Purchase Loans
C) Refinancings
D) Home Improvement Loans
F) Non-occupant Loans on < 5 Family Dwellings (A B C & D)
Detailed PMIC statistics for the following Tracts:3301.00
, 3401.00
2002 - 2018 National Fire Incident Reporting System (NFIRS) incidents
Based on the data from the years 2002 - 2018 the average number of fire incidents per year is 16. The highest number of reported fire incidents - 36 took place in 2010, and the least - 4 in 2006. The data has a rising trend.
When looking into fire subcategories, the most reports belonged to: Structure Fires (48.7%), and Outside Fires (43.4%).
Fire incident types reported to NFIRS in Zip Code 45337


+$1,018
-$3,706
(% of AGI for various income ranges: -11.7% for AGIs below $10k, 0.4% for AGIs $25k-50k, -0.0% for AGIs $50k-75k, 1.8% for AGIs $75k-100k) Nearest zip codes: 45361, 45358, 45354, 45383, 45339, 45359.
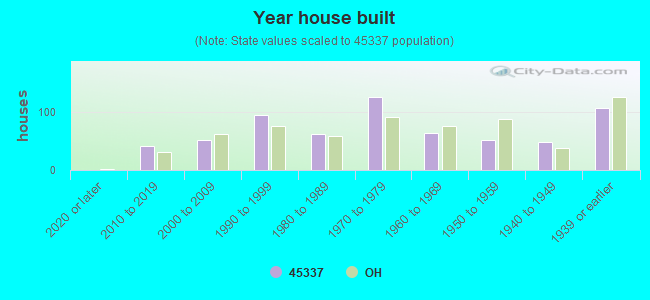


 Based on the data from the years 2002 - 2018 the average number of fire incidents per year is 16. The highest number of reported fire incidents - 36 took place in 2010, and the least - 4 in 2006. The data has a rising trend.
 When looking into fire subcategories, the most reports belonged to: Structure Fires (48.7%), and Outside Fires (43.4%).