Estimated zip code population in 2022: 12,510 Zip code population in 2010: 12,147 Zip code population in 2000: 11,474
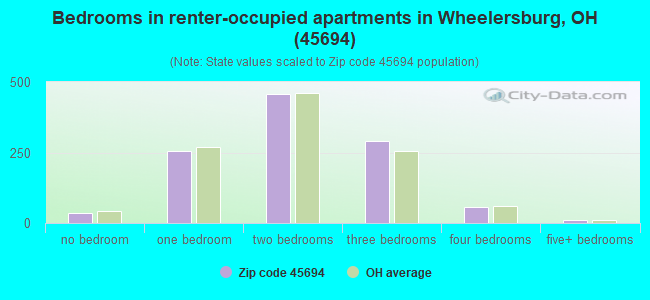
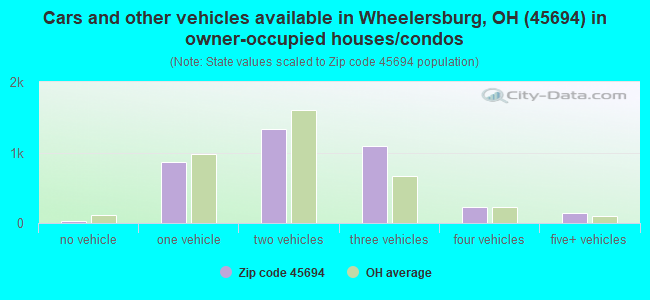
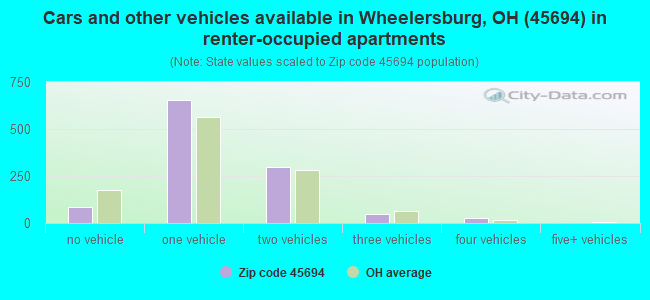
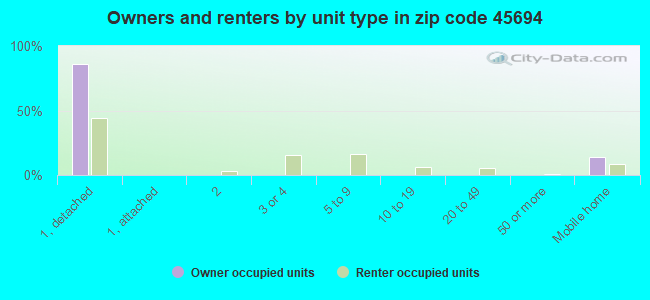
Houses and condos: 5,385 Renter-occupied apartments: 1,105
% of renters here:
23%
State:
33%
March 2022 cost of living index in zip code 45694: 79.0 (low, U.S. average is 100)
Land area: 71.3 sq. mi. Water area: 0.6 sq. mi.
Population density: 176 people per square mile
(very low).
OSM Map
General Map
Google Map
MSN Map
OSM Map
General Map
Google Map
MSN Map
OSM Map
General Map
Google Map
MSN Map
OSM Map
General Map
Google Map
MSN Map
Please wait while loading the map...
Real estate property taxes paid for housing units in 2022:
This zip code:
0.9% ($1,824)
Ohio:
1.3% ($2,639)
Median real estate property taxes paid for housing units with mortgages in 2022: $1,902 (0.8%) Median real estate property taxes paid for housing units with no mortgage in 2022: $1,763 (0.9%)
Business Search- 14 Million verified businesses
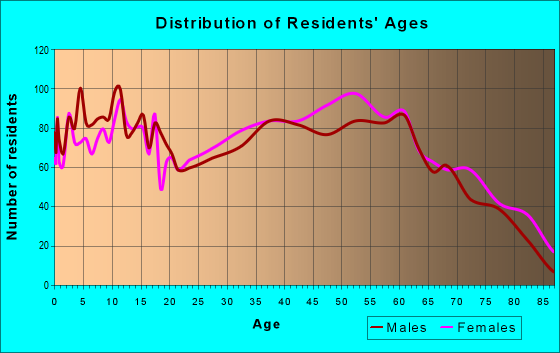
Males: 6,106
(48.8%)
Females: 6,403
(51.2%)
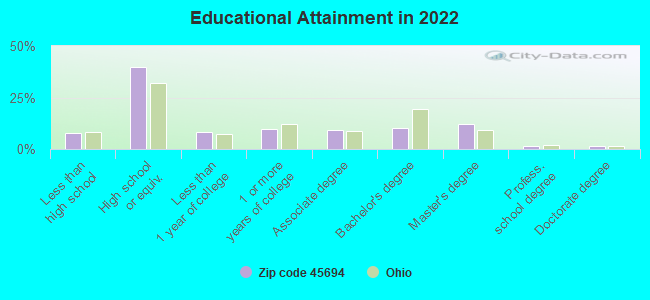
For population 25 years and over in 45694:
High school or higher: 92.5%
Bachelor's degree or higher: 25.4%
Graduate or professional degree: 14.9%
Unemployed: 5.5%
Mean travel time to work (commute): 30.3 minutes
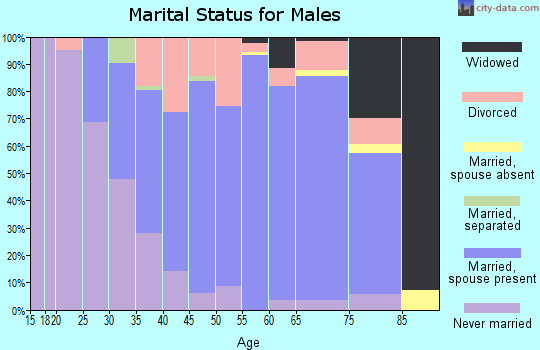
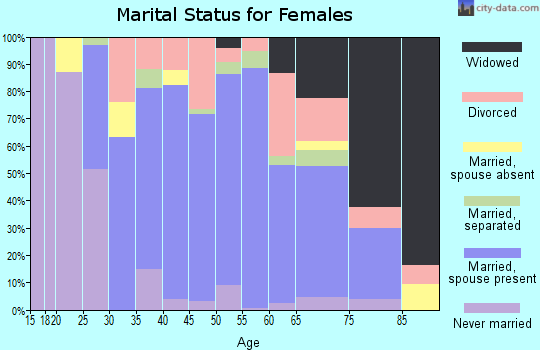
For population 15 years and over in 45694:
Never married: 23.2%
Now married: 57.4%
Separated: 1.5%
Widowed: 7.7%
Divorced: 10.3%
Zip code 45694 compared to state average:
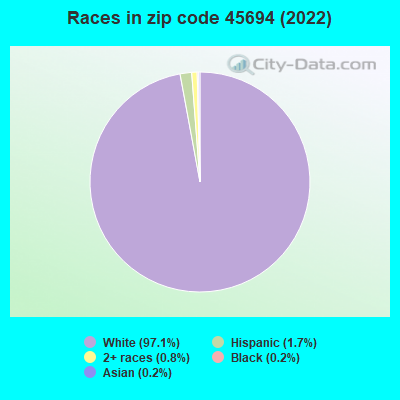
Black race population percentage significantly below state average.
Hispanic race population percentage below state average.
Foreign-born population percentage significantly below state average.
Length of stay since moving in significantly above state average.
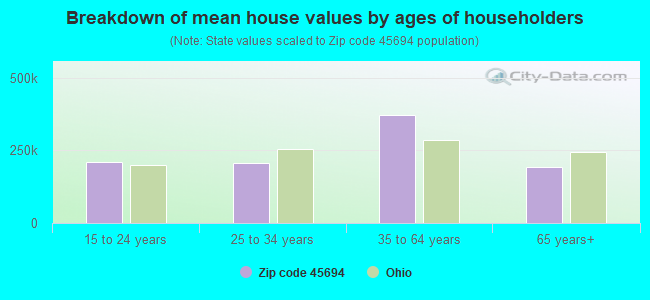
Estimated median house/condo value in 2022: $211,672
45694:
$211,672
Ohio:
$204,100
According to our research of Ohio and other state lists, there were 14 registered sex offenders living in 45694 zip code as of April 17, 2024. The ratio of all residents to sex offenders in zip code 45694 is 866 to 1. The ratio of registered sex offenders to all residents in this zip code is lower than the state average.
Median resident age:
This zip code:
42.2 years
Ohio median age:
39.9 years
Average household size:
This zip code:
2.6 people
Ohio:
2.4 people
Averages for the 2020 tax year for zip code 45694, filed in 2021:
Average Adjusted Gross Income (AGI) in 2020: $62,866 (Individual Income Tax Returns)
Here:
$62,866
State:
$67,288
Salary/wage: $54,563 (reported on 80.1% of returns)
Here:
$54,563
State:
$55,628
(% of AGI for various income ranges: 1060.9% for AGIs below $25k, 3305.3% for AGIs $25k-50k, 6330.2% for AGIs $50k-75k, 9280.3% for AGIs $75k-100k, 15745.7% for AGIs $100k-200k, 57291.7% for AGIs over 200k)
Taxable interest for individuals: $934 (reported on 24.1% of returns)
This zip code:
$934
Ohio:
$1,518
(% of AGI for various income ranges: 10.2% for AGIs below $25k, 22.0% for AGIs $25k-50k, 28.5% for AGIs $50k-75k, 33.2% for AGIs $75k-100k, 37.4% for AGIs $100k-200k, 580.0% for AGIs over 200k)
Ordinary dividends: $11,445 (reported on 11.8% of returns)
Here:
$11,445
State:
$7,167
(% of AGI for various income ranges: 10.7% for AGIs below $25k, 20.3% for AGIs $25k-50k, 45.0% for AGIs $50k-75k, 88.7% for AGIs $75k-100k, 128.5% for AGIs $100k-200k, 9213.3% for AGIs over 200k)
Net capital gain/loss in AGI: +$11,269 (reported on 10.2% of returns)
Here:
+$11,269
State:
+$18,919
(% of AGI for various income ranges: 7.1% for AGIs below $25k, 15.8% for AGIs $25k-50k, 74.4% for AGIs $50k-75k, 132.9% for AGIs $75k-100k, 308.3% for AGIs $100k-200k, 5693.3% for AGIs over 200k)
Profit/loss from business: +$8,941 (reported on 13.5% of returns)
Here:
+$8,941
State:
+$13,744
(% of AGI for various income ranges: 86.1% for AGIs below $25k, 84.0% for AGIs $25k-50k, 79.4% for AGIs $50k-75k, 178.2% for AGIs $75k-100k, 292.6% for AGIs $100k-200k, 2973.3% for AGIs over 200k)
Taxable individual retirement arrangement distribution: $16,103 (reported on 7.4% of returns)
45694:
$16,103
Ohio:
$18,876
(% of AGI for various income ranges: 32.8% for AGIs below $25k, 91.5% for AGIs $25k-50k, 203.9% for AGIs $50k-75k, 293.9% for AGIs $75k-100k, 540.4% for AGIs $100k-200k)
Total itemized deductions: $32,925 (reported on 3.8% of returns)
Here:
$32,925
State:
$33,869
(% of AGI for various income ranges: 44.8% for AGIs below $25k, 138.5% for AGIs $50k-75k, 182.1% for AGIs $75k-100k, 414.7% for AGIs $100k-200k, 4111.7% for AGIs over 200k)
Charity contributions: $13,094 (reported on 3.0% of returns)
Here:
$13,094
State:
$14,577
(% of AGI for various income ranges: 81.3% for AGIs $50k-75k, 166.4% for AGIs $100k-200k, 1348.3% for AGIs over 200k)
Taxes paid: $6,953 (reported on 3.6% of returns)
45694:
$6,953
State:
$7,681
(% of AGI for various income ranges: 5.5% for AGIs below $25k, 23.1% for AGIs $50k-75k, 37.4% for AGIs $75k-100k, 97.4% for AGIs $100k-200k, 836.7% for AGIs over 200k)
Earned income credit: $2,346 (reported on 16.5% of returns)
Here:
$2,346
State:
$2,304
(% of AGI for various income ranges: 96.2% for AGIs below $25k, 72.0% for AGIs $25k-50k)
Percentage of individuals using paid preparers for their 2020 taxes: 95.6%
Here:
96%
State:
94%
(% for various income ranges: 95.5% for AGIs below $25k, 95.2% for AGIs $25k-50k, 96.6% for AGIs $50k-75k, 96.3% for AGIs $75k-100k, 95.8% for AGIs $100k-200k, 92.3% for AGIs over 200k)
Averages for the 2012 tax year for zip code 45694, filed in 2013:
Average Adjusted Gross Income (AGI) in 2012: $50,086 (Individual Income Tax Returns)
Here:
$50,086
State:
$54,926
Salary/wage: $44,545 (reported on 83.1% of returns)
Here:
$44,545
State:
$45,869
(% of AGI for various income ranges: 72.1% for AGIs below $25k, 74.3% for AGIs $25k-50k, 73.5% for AGIs $50k-75k, 79.0% for AGIs $75k-100k, 77.6% for AGIs $100k-200k, 62.6% for AGIs over 200k)
Taxable interest for individuals: $1,064 (reported on 29.3% of returns)
This zip code:
$1,064
Ohio:
$1,297
(% of AGI for various income ranges: 1.1% for AGIs below $25k, 0.7% for AGIs $25k-50k, 0.4% for AGIs $50k-75k, 0.5% for AGIs $75k-100k, 0.2% for AGIs $100k-200k, 1.3% for AGIs over 200k)
Ordinary dividends: $2,937 (reported on 12.2% of returns)
Here:
$2,937
State:
$5,821
(% of AGI for various income ranges: 0.8% for AGIs below $25k, 0.5% for AGIs $25k-50k, 0.5% for AGIs $50k-75k, 0.7% for AGIs $75k-100k, 0.8% for AGIs $100k-200k, 1.1% for AGIs over 200k)
Net capital gain/loss in AGI: +$4,037 (reported on 8.1% of returns)
Here:
+$4,037
State:
+$11,232
(% of AGI for various income ranges: 0.3% for AGIs $25k-50k, 0.1% for AGIs $50k-75k, 0.7% for AGIs $75k-100k, 0.9% for AGIs $100k-200k, 2.1% for AGIs over 200k)
Profit/loss from business: +$9,410 (reported on 13.8% of returns)
Here:
+$9,410
State:
+$12,773
(% of AGI for various income ranges: 6.5% for AGIs below $25k, 2.1% for AGIs $25k-50k, 1.5% for AGIs $50k-75k, 1.6% for AGIs $75k-100k, 3.2% for AGIs $100k-200k, 2.1% for AGIs over 200k)
Taxable individual retirement arrangement distribution: $11,649 (reported on 9.1% of returns)
45694:
$11,649
Ohio:
$14,511
(% of AGI for various income ranges: 2.2% for AGIs below $25k, 1.8% for AGIs $25k-50k, 2.5% for AGIs $50k-75k, 2.8% for AGIs $75k-100k, 2.8% for AGIs $100k-200k)
Total itemized deductions: $19,805 (20% of AGI, reported on 24.0% of returns)
Here:
$19,805
State:
$21,278
Here:
19.7% of AGI
State:
18.8% of AGI
(% of AGI for various income ranges: 3.4% for AGIs below $25k, 6.3% for AGIs $25k-50k, 9.2% for AGIs $50k-75k, 11.1% for AGIs $75k-100k, 11.9% for AGIs $100k-200k, 12.5% for AGIs over 200k)
Charity contributions: $4,243 (reported on 17.7% of returns)
Here:
$4,243
State:
$3,943
(% of AGI for various income ranges: 0.4% for AGIs below $25k, 0.9% for AGIs $25k-50k, 1.2% for AGIs $50k-75k, 1.8% for AGIs $75k-100k, 2.2% for AGIs $100k-200k, 2.1% for AGIs over 200k)
Taxes paid: $6,917 (reported on 23.6% of returns)
45694:
$6,917
State:
$9,568
(% of AGI for various income ranges: 0.5% for AGIs below $25k, 1.2% for AGIs $25k-50k, 2.2% for AGIs $50k-75k, 3.1% for AGIs $75k-100k, 4.4% for AGIs $100k-200k, 7.8% for AGIs over 200k)
Earned income credit: $2,336 (reported on 19.5% of returns)
Here:
$2,336
State:
$2,285
(% of AGI for various income ranges: 7.5% for AGIs below $25k, 1.0% for AGIs $25k-50k)
Percentage of individuals using paid preparers for their 2012 taxes: 58.1%
Here:
58%
State:
51%
(% for various income ranges: 51.0% for AGIs below $25k, 57.6% for AGIs $25k-50k, 64.9% for AGIs $50k-75k, 66.0% for AGIs $75k-100k, 67.4% for AGIs $100k-200k, 75.0% for AGIs over 200k)
Averages for the 2004 tax year for zip code 45694, filed in 2005:
Average Adjusted Gross Income (AGI) in 2004: $37,915 (Individual Income Tax Returns)
Here:
$37,915
State:
$44,480
Salary/wage: $34,717 (reported on 84.7% of returns)
Here:
$34,717
State:
$39,198
(% of AGI for various income ranges: 93.9% for AGIs below $10k, 74.0% for AGIs $10k-25k, 80.3% for AGIs $25k-50k, 83.7% for AGIs $50k-75k, 85.0% for AGIs $75k-100k, 63.3% for AGIs over 100k)
Taxable interest for individuals: $1,471 (reported on 39.2% of returns)
This zip code:
$1,471
Ohio:
$1,532
(% of AGI for various income ranges: 7.2% for AGIs below $10k, 2.4% for AGIs $10k-25k, 1.3% for AGIs $25k-50k, 1.0% for AGIs $50k-75k, 0.8% for AGIs $75k-100k, 1.7% for AGIs over 100k)
Taxable dividends: $1,455 (reported on 15.4% of returns)
Here:
$1,455
State:
$3,496
(% of AGI for various income ranges: 2.1% for AGIs below $10k, 0.7% for AGIs $10k-25k, 0.4% for AGIs $25k-50k, 0.4% for AGIs $50k-75k, 0.7% for AGIs $75k-100k, 0.8% for AGIs over 100k)
Net capital gain/loss: +$3,857 (reported on 12.2% of returns)
Here:
+$3,857
State:
+$8,582
(% of AGI for various income ranges: -1.1% for AGIs below $10k, -0.1% for AGIs $10k-25k, 0.6% for AGIs $25k-50k, 0.9% for AGIs $50k-75k, 0.0% for AGIs $75k-100k, 4.1% for AGIs over 100k)
Profit/loss from business: +$9,161 (reported on 14.1% of returns)
Here:
+$9,161
State:
+$10,813
(% of AGI for various income ranges: 5.9% for AGIs below $10k, 3.9% for AGIs $10k-25k, 1.5% for AGIs $25k-50k, 2.0% for AGIs $50k-75k, 1.4% for AGIs $75k-100k, 7.9% for AGIs over 100k)
IRA payment deduction: $3,037 (reported on 2.2% of returns)
45694:
$3,037
Ohio:
$2,794
(% of AGI for various income ranges: 0.2% for AGIs $10k-25k, 0.2% for AGIs $25k-50k, 0.3% for AGIs $50k-75k, 0.1% for AGIs over 100k)
Self-employed pension: $17,929 (reported on 0.3% of returns)
Here:
$17,929
Ohio:
$13,981
Total itemized deductions: $15,579 (20% of AGI, reported on 23.6% of returns)
Here:
$15,579
State:
$17,503
Here:
20.3% of AGI
State:
20.8% of AGI
(% of AGI for various income ranges: 3.5% for AGIs below $10k, 4.5% for AGIs $10k-25k, 8.2% for AGIs $25k-50k, 10.9% for AGIs $50k-75k, 12.2% for AGIs $75k-100k, 12.0% for AGIs over 100k)
Charity contributions deductions: $3,160 (4% of AGI, reported on 18.2% of returns)
Here:
$3,160
State:
$3,087
Here:
3.8% of AGI
State:
3.4% of AGI
(% of AGI for various income ranges: 0.4% for AGIs below $10k, 0.6% for AGIs $10k-25k, 1.0% for AGIs $25k-50k, 1.8% for AGIs $50k-75k, 1.9% for AGIs $75k-100k, 2.2% for AGIs over 100k)
Total tax: $5,309 (reported on 71.9% of returns)
45694:
$5,309
State:
$6,781
(% of AGI for various income ranges: 2.5% for AGIs below $10k, 3.6% for AGIs $10k-25k, 6.6% for AGIs $25k-50k, 8.9% for AGIs $50k-75k, 10.3% for AGIs $75k-100k, 19.4% for AGIs over 100k)
Earned income credit: $1,771 (reported on 18.2% of returns)
Here:
$1,771
State:
$1,696
Percentage of individuals using paid preparers for their 2004 taxes: 60.8%
Here:
61%
State:
55%
(% for various income ranges: 52.1% for AGIs below $10k, 60.4% for AGIs $10k-25k, 66.1% for AGIs $25k-50k, 62.9% for AGIs $50k-75k, 59.3% for AGIs $75k-100k, 68.3% for AGIs over 100k)
Likely homosexual households (counted as self-reported same-sex unmarried-partner households)
Lesbian couples: 0.4% of all households
Gay men: 0.0% of all households
Household received Food Stamps/SNAP in the past 12 months: 913 Household did not receive Food Stamps/SNAP in the past 12 months: 3,897
Women who had a birth in the past 12 months: 151 (75 now married, 74 unmarried) Women who did not have a birth in the past 12 months: 2,488 (1,301 now married, 1,185 unmarried)
Housing units in zip code 45694 with a mortgage: 1,765 (221 second mortgage, 196 both second mortgage and home equity loan) Median monthly owner costs for units with a mortgage: $1,469 Median monthly owner costs for units without a mortgage: $496
Residents with income below the poverty level in 2022:
This zip code:
17.6%
Whole state:
13.4%
Residents with income below 50% of the poverty level in 2022:
This zip code:
7.2%
Whole state:
7.0%
Median number of rooms in houses and condos:
Here:
6.9
State:
6.7
Median number of rooms in apartments:
Here:
4.4
State:
4.4
Notable locations in this zip code not listed on our city pages
Notable locations in zip code 45694: Barretts Landing (A), Pratters Landing (B), Prestons Landing (C), Burkes Landing (D), Fuhrmann Orchards (E), Superior (F), Scioto Ambulance District Squad 6 (G), Scioto Ambulance District Squad 9 (H), Porter Township Emergency Rescue Association (I), Able Medical Transport (J), Vernon Township Fire Station 2 (K), Vernon Township Fire Station 1 (L), Porter Township Fire Department (M), Hillcrest Childrens Home (N). Display/hide their locations on the map
Churches in zip code 45694 include: Mount Hope Church (A), Meads Church (B), Slocum Station Church (C), Lily Chapel (D), Sunshine Church (E), Tick Ridge Church (F), Germany Hollow Church (G), Frederick Church (H), Pine Creek Church (I). Display/hide their locations on the map
Cemeteries: Hartley Cemetery (1), Mount Hope Cemetery (2), Pine Creek Baptist Cemetery (3), Scioto Furnace Cemetery (4), Vernon Cemetery (5), Turner Cemetery (6), Slocum Cemetery (7). Display/hide their locations on the map
Streams, rivers, and creeks: Frederick Creek (A), Falls Creek (B), Dry Run (C), Sugar Camp Creek (D), Turkeyfoot Run (E), Youngs Branch (F), Pine Creek (G), Patton Run (H), Lick Run (I). Display/hide their locations on the map
In group quarters: 183 (-1 institutionalized population)
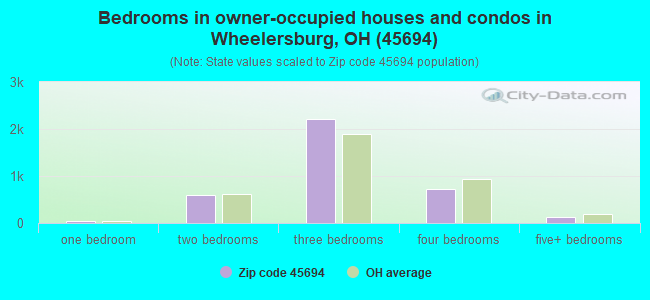
Size of family households: 1,577 2-persons, 807 3-persons, 499 4-persons, 258 5-persons, 185 6-persons, 43 7-or-more-persons
Size of nonfamily households: 1,199 1-person, 178 2-persons, 39 3-persons
1,687 married couples with children.
729 single-parent households (128 men, 601 women).
98.7% of residents of 45694 zip code speak English at home.
0.6% of residents speak Spanish at home (100% very well).
0.3% of residents speak other Indo-European language at home (100% very well).
0.2% of residents speak Asian or Pacific Island language at home (100% very well).
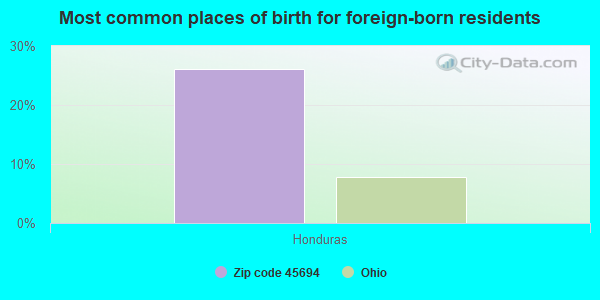
Foreign born population: 65 (0.5%) (75.3% of them are naturalized citizens)
This zip code:
0.5%
Whole state:
5.0%
26%Honduras
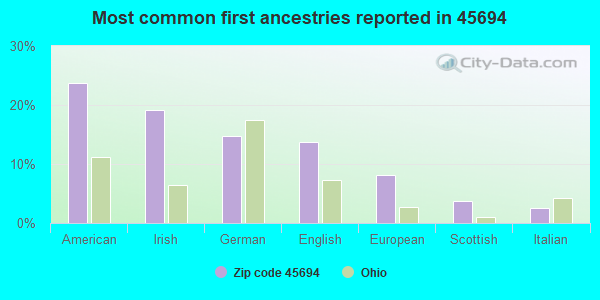
24%American
19%Irish
15%German
14%English
8%European
4%Scottish
3%Italian
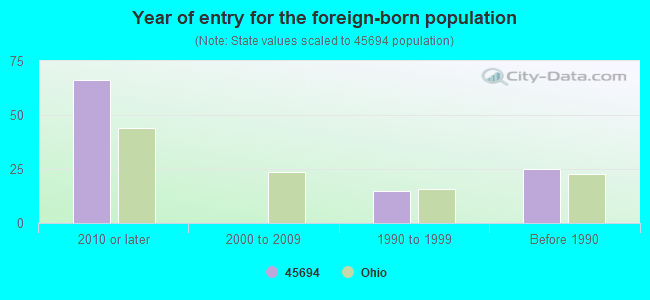
Year of entry for the foreign-born population
662010 or later
02000 to 2009
151990 to 1999
25Before 1990
Facilities with environmental interests located in this zip code:
BP OIL CO (312 CENTER ST in WHEELERSBURG, OH)
STATE MASTER (Ohio general info) - RCRA-OHD987016870, HAZARDOUS WASTE PROGRAM (Resource Conservation and Recovery Act (tracking hazardous waste)) Organizations: BP OIL COMPANY (CONTACT/OWNER)
BOCOOK S GARAGE (8581 OHIO RIVER ROAD in WHEELERSBURG, OH)
STATE MASTER (Ohio general info) - RCRA-OHR000037374, HAZARDOUS WASTE PROGRAM Conditionally Exempt Small Quantity Generators, less than 100 kg/month of hazardous waste (Resource Conservation and Recovery Act (tracking hazardous waste)) Organizations: BILL BOCOOK (CONTACT/OWNER)
Alternative names: BOCOOK'S GARAGE
AT&T LONG LINES BUCKHORN OH (APPROX 3 MI S OF BUCKHORN in BUCKHORN, OH)
(Resource Conservation and Recovery Act (tracking hazardous waste))
Housing units lacking complete plumbing facilities: 4.7% Housing units lacking complete kitchen facilities: 3.5%
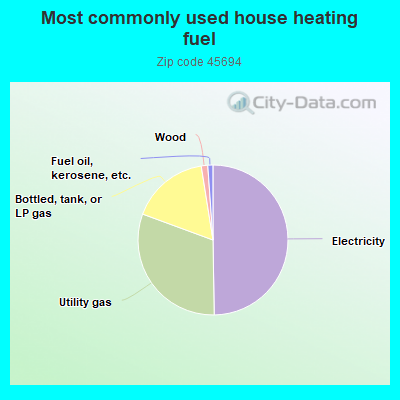
49.8%Electricity
30.9%Utility gas
16.9%Bottled, tank, or LP gas
1.4%Wood
1.1%Fuel oil, kerosene, etc.
Population in 1990: 10,537. Population change in the 1990s: +937 (+8.9%).
Place of birth for U.S.-born residents:
This state: 10,309
Northeast: 212
Midwest: 528
South: 1,171
West: 153
60% of the 45694 zip code residents lived in the same house 5 years ago. Out of people who lived in different houses, 70% lived in this county. Out of people who lived in different counties, 50% lived in Ohio.
92% of the 45694 zip code residents lived in the same house 1 year ago. Out of people who lived in different houses, 66% moved from this county. Out of people who lived in different houses, 19% moved from different county within same state. Out of people who lived in different houses, 14% moved from different state.
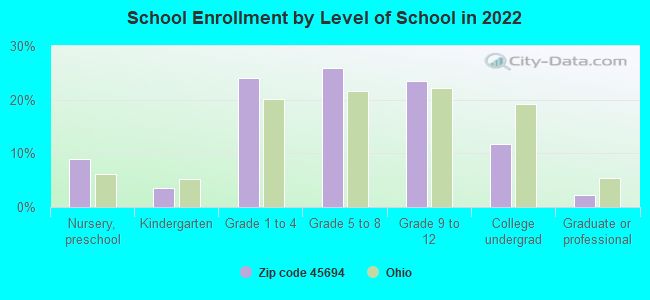
Private vs. public school enrollment:
Students in private schools in grades 1 to 8 (elementary and middle school): 177
Here:
11.6%
Ohio:
16.0%
Students in private schools in grades 9 to 12 (high school): 21
Here:
3.0%
Ohio:
13.1%
Students in private undergraduate colleges:
Here:
0.0%
Ohio:
22.3%
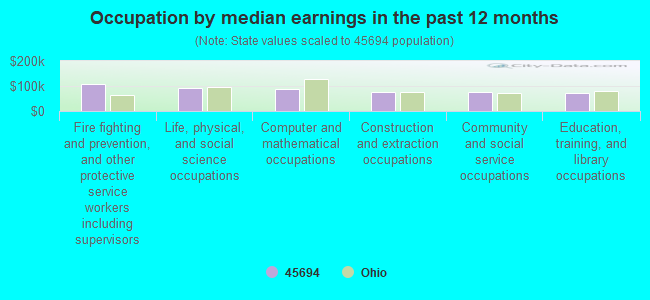
Occupation by median earnings in the past 12 months ($)
106,722Fire fighting and prevention, and other protective service workers including supervisors
92,880Life, physical, and social science occupations
87,587Computer and mathematical occupations
76,648Construction and extraction occupations
76,461Community and social service occupations
73,434Education, training, and library occupations
Top industries in this zip code by the number of employees in 2005:
Health Care and Social Assistance: Nursing Care Facilities (100-249 employees: 2 establishments, 10-19 employees: 1 establishment)
Health Care and Social Assistance: Home Health Care Services (100-249: 1, 50-99: 2, 10-19: 1, 1-4: 1)
Professional, Scientific, and Technical Services: All Other Professional, Scientific, and Technical Services (50-99: 1)
Health Care and Social Assistance: Services for the Elderly and Persons with Disabilities (50-99: 1)
Health Care and Social Assistance: Offices of Physicians (except Mental Health Specialists) (20-49: 1, 10-19: 1, 1-4: 4)
People in group quarters in 2010:
147 people in nursing facilities/skilled-nursing facilities
6 people in group homes intended for adults
People in group quarters in 2000:
254 people in nursing homes
Fatal accident statistics in 2014:
Fatal accident count: 1
Vehicles involved in fatal accidents: 1
Fatal accidents caused by drunken drivers: 0
Fatalities: 1
Persons involved in fatal accidents: 1
Pedestrians involved in fatal accidents: 0
Fatal accident statistics in 2013:
Fatal accident count: 2
Vehicles involved in fatal accidents: 2
Fatal accidents caused by drunken drivers: 0
Fatalities: 2
Persons involved in fatal accidents: 2
Pedestrians involved in fatal accidents: 0
2002 - 2018 National Fire Incident Reporting System (NFIRS) incidents
Based on the data from the years 2002 - 2018 the average number of fires per year is 73. The highest number of fire incidents - 107 took place in 2010, and the least - 37 in 2018. The data has a dropping trend.
When looking into fire subcategories, the most reports belonged to: Structure Fires (51.6%), and Outside Fires (29.7%).
Fire incident types reported to NFIRS in Zip Code 45694


 Nearest zip codes: 45629, 45682, 45662, 45653, 45636, 45659.
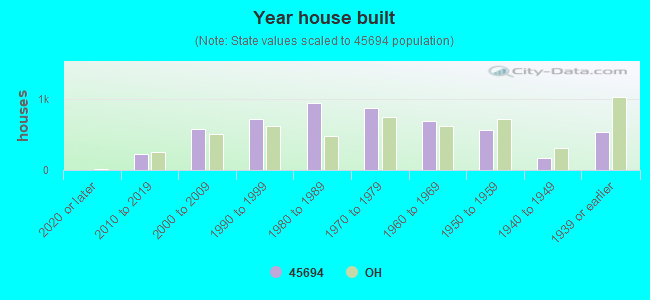


 Based on the data from the years 2002 - 2018 the average number of fires per year is 73. The highest number of fire incidents - 107 took place in 2010, and the least - 37 in 2018. The data has a dropping trend.
 When looking into fire subcategories, the most reports belonged to: Structure Fires (51.6%), and Outside Fires (29.7%).