Estimated zip code population in 2022: 2,849 Zip code population in 2010: 3,253 Zip code population in 2000: 2,989
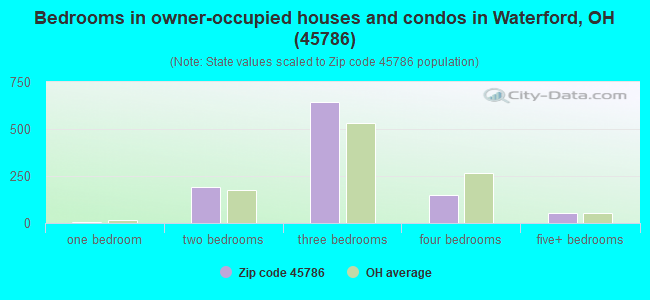
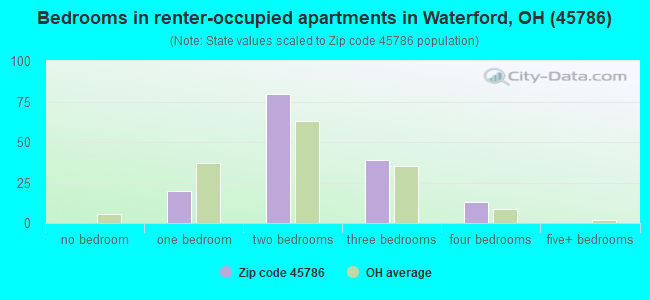
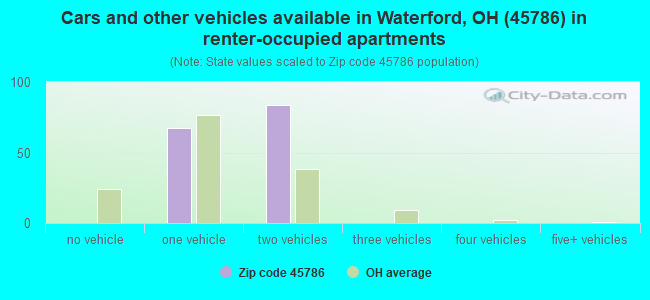
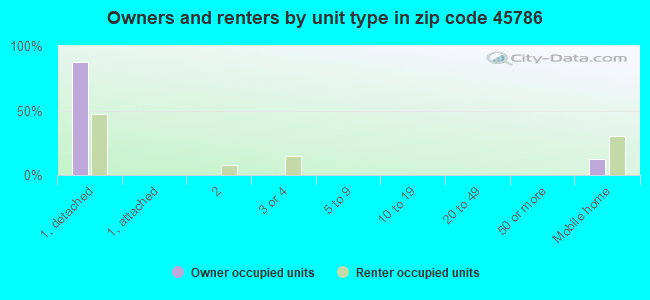
Houses and condos: 1,292 Renter-occupied apartments: 151
% of renters here:
13%
State:
33%
March 2022 cost of living index in zip code 45786: 83.7 (less than average, U.S. average is 100)
Land area: 65.3 sq. mi. Water area: 1.3 sq. mi.
Population density: 44 people per square mile
(very low).
OSM Map
General Map
Google Map
MSN Map
OSM Map
General Map
Google Map
MSN Map
OSM Map
General Map
Google Map
MSN Map
OSM Map
General Map
Google Map
MSN Map
Please wait while loading the map...
Real estate property taxes paid for housing units in 2022:
This zip code:
0.8% ($1,447)
Ohio:
1.3% ($2,639)
Median real estate property taxes paid for housing units with mortgages in 2022: $1,802 (0.9%) Median real estate property taxes paid for housing units with no mortgage in 2022: $1,374 (0.8%)
Business Search- 14 Million verified businesses
Males: 1,455
(51.1%)
Females: 1,393
(48.9%)
For population 25 years and over in 45786:
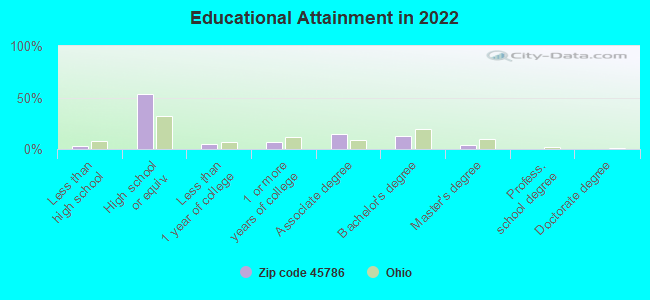
High school or higher: 96.9%
Bachelor's degree or higher: 17.4%
Graduate or professional degree: 4.5%
Unemployed: 2.3%
Mean travel time to work (commute): 26.4 minutes
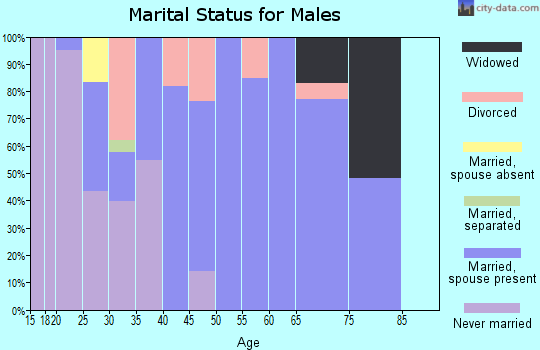
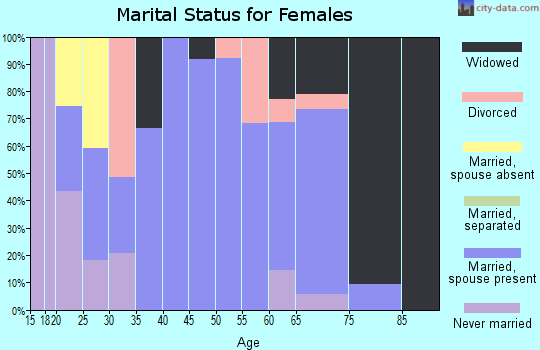
For population 15 years and over in 45786:
Never married: 22.8%
Now married: 52.7%
Separated: 2.2%
Widowed: 14.9%
Divorced: 7.5%
Zip code 45786 compared to state average:
Black race population percentage significantly below state average.
Hispanic race population percentage significantly below state average.
Median age significantly above state average.
Foreign-born population percentage significantly below state average.
Renting percentage significantly below state average.
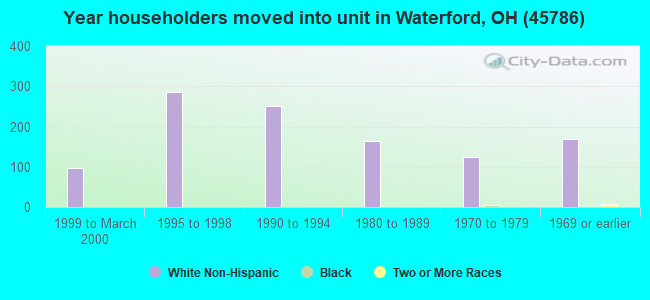
Length of stay since moving in significantly above state average.
Number of college students below state average.
Percentage of population with a bachelor's degree or higher below state average.
Estimated median house/condo value in 2022: $190,182
45786:
$190,182
Ohio:
$204,100
According to our research of Ohio and other state lists, there were 7 registered sex offenders living in 45786 zip code as of April 25, 2024. The ratio of all residents to sex offenders in zip code 45786 is 550 to 1. The ratio of registered sex offenders to all residents in this zip code is near the state average.
Median resident age:
This zip code:
48.9 years
Ohio median age:
39.9 years
Average household size:
This zip code:
2.4 people
Ohio:
2.4 people
Averages for the 2020 tax year for zip code 45786, filed in 2021:
Average Adjusted Gross Income (AGI) in 2020: $59,281 (Individual Income Tax Returns)
Here:
$59,281
State:
$67,288
Salary/wage: $51,304 (reported on 83.7% of returns)
Here:
$51,304
State:
$55,628
(% of AGI for various income ranges: 1265.9% for AGIs below $25k, 3755.3% for AGIs $25k-50k, 6929.4% for AGIs $50k-75k, 8750.8% for AGIs $75k-100k, 14483.3% for AGIs $100k-200k)
Taxable interest for individuals: $772 (reported on 36.1% of returns)
This zip code:
$772
Ohio:
$1,518
(% of AGI for various income ranges: 12.4% for AGIs below $25k, 25.9% for AGIs $25k-50k, 20.0% for AGIs $50k-75k, 18.3% for AGIs $75k-100k, 51.7% for AGIs $100k-200k)
Ordinary dividends: $2,268 (reported on 19.0% of returns)
Here:
$2,268
State:
$7,167
(% of AGI for various income ranges: 36.9% for AGIs below $25k, 36.2% for AGIs $25k-50k, 46.1% for AGIs $50k-75k, 88.3% for AGIs $75k-100k, 87.5% for AGIs $100k-200k)
Net capital gain/loss in AGI: +$6,492 (reported on 17.0% of returns)
Here:
+$6,492
State:
+$18,919
(% of AGI for various income ranges: 29.0% for AGIs below $25k, 85.6% for AGIs $25k-50k, 98.3% for AGIs $50k-75k, 271.7% for AGIs $75k-100k, 384.2% for AGIs $100k-200k)
Profit/loss from business: +$15,073 (reported on 15.0% of returns)
Here:
+$15,073
State:
+$13,744
(% of AGI for various income ranges: 100.0% for AGIs below $25k, 140.0% for AGIs $25k-50k, 223.3% for AGIs $50k-75k, 398.3% for AGIs $75k-100k, 1415.0% for AGIs $100k-200k)
Taxable individual retirement arrangement distribution: $14,129 (reported on 9.5% of returns)
45786:
$14,129
Ohio:
$18,876
(% of AGI for various income ranges: 62.1% for AGIs below $25k, 150.6% for AGIs $25k-50k, 432.8% for AGIs $50k-75k, 447.5% for AGIs $100k-200k)
Total itemized deductions: $21,167 (reported on 2.0% of returns)
Here:
$21,167
State:
$33,869
(% of AGI for various income ranges: 198.4% for AGIs $25k-50k)
Taxes paid: $4,300 (reported on 2.0% of returns)
45786:
$4,300
State:
$7,681
(% of AGI for various income ranges: 40.3% for AGIs $25k-50k)
Earned income credit: $2,247 (reported on 12.9% of returns)
Here:
$2,247
State:
$2,304
(% of AGI for various income ranges: 71.4% for AGIs below $25k, 68.8% for AGIs $25k-50k)
Percentage of individuals using paid preparers for their 2020 taxes: 95.9%
Here:
96%
State:
94%
(% for various income ranges: 92.9% for AGIs below $25k, 95.3% for AGIs $25k-50k, 96.2% for AGIs $50k-75k, 100.0% for AGIs $75k-100k, 100.0% for AGIs $100k-200k, 100.0% for AGIs over 200k)
Averages for the 2012 tax year for zip code 45786, filed in 2013:
Average Adjusted Gross Income (AGI) in 2012: $61,040 (Individual Income Tax Returns)
Here:
$61,040
State:
$54,926
Salary/wage: $41,989 (reported on 83.6% of returns)
Here:
$41,989
State:
$45,869
(% of AGI for various income ranges: 74.7% for AGIs below $25k, 78.2% for AGIs $25k-50k, 79.2% for AGIs $50k-75k, 72.7% for AGIs $75k-100k, 62.4% for AGIs $100k-200k, 19.7% for AGIs over 200k)
Taxable interest for individuals: $770 (reported on 34.2% of returns)
This zip code:
$770
Ohio:
$1,297
(% of AGI for various income ranges: 1.5% for AGIs below $25k, 0.5% for AGIs $25k-50k, 0.2% for AGIs $50k-75k, 0.6% for AGIs $75k-100k, 0.3% for AGIs $100k-200k, 0.3% for AGIs over 200k)
Ordinary dividends: $1,235 (reported on 17.8% of returns)
Here:
$1,235
State:
$5,821
(% of AGI for various income ranges: 1.0% for AGIs below $25k, 0.4% for AGIs $25k-50k, 0.4% for AGIs $50k-75k, 0.4% for AGIs $75k-100k, 0.4% for AGIs $100k-200k, 0.2% for AGIs over 200k)
Net capital gain/loss in AGI: +$5,744 (reported on 12.3% of returns)
Here:
+$5,744
State:
+$11,232
(% of AGI for various income ranges: 0.2% for AGIs below $25k, 0.4% for AGIs $25k-50k, 0.2% for AGIs $50k-75k, 0.1% for AGIs $75k-100k, 0.3% for AGIs $100k-200k, 3.4% for AGIs over 200k)
Profit/loss from business: +$9,104 (reported on 15.8% of returns)
Here:
+$9,104
State:
+$12,773
(% of AGI for various income ranges: 4.0% for AGIs below $25k, 2.3% for AGIs $25k-50k, 1.6% for AGIs $50k-75k, 2.7% for AGIs $75k-100k, 4.3% for AGIs $100k-200k, 0.8% for AGIs over 200k)
Taxable individual retirement arrangement distribution: $10,894 (reported on 11.0% of returns)
45786:
$10,894
Ohio:
$14,511
(% of AGI for various income ranges: 3.1% for AGIs below $25k, 2.1% for AGIs $25k-50k, 4.6% for AGIs $50k-75k, 3.7% for AGIs $100k-200k)
Total itemized deductions: $18,237 (13% of AGI, reported on 18.5% of returns)
Here:
$18,237
State:
$21,278
Here:
13.0% of AGI
State:
18.8% of AGI
(% of AGI for various income ranges: 5.3% for AGIs $25k-50k, 5.3% for AGIs $50k-75k, 6.4% for AGIs $75k-100k, 7.1% for AGIs $100k-200k, 5.7% for AGIs over 200k)
Charity contributions: $2,735 (reported on 11.6% of returns)
Here:
$2,735
State:
$3,943
(% of AGI for various income ranges: 0.3% for AGIs $25k-50k, 0.4% for AGIs $50k-75k, 0.6% for AGIs $75k-100k, 1.0% for AGIs $100k-200k, 0.5% for AGIs over 200k)
Taxes paid: $7,748 (reported on 18.5% of returns)
45786:
$7,748
State:
$9,568
(% of AGI for various income ranges: 0.9% for AGIs $25k-50k, 1.3% for AGIs $50k-75k, 1.7% for AGIs $75k-100k, 2.8% for AGIs $100k-200k, 4.2% for AGIs over 200k)
Earned income credit: $2,150 (reported on 15.1% of returns)
Here:
$2,150
State:
$2,285
(% of AGI for various income ranges: 5.0% for AGIs below $25k, 1.0% for AGIs $25k-50k)
Percentage of individuals using paid preparers for their 2012 taxes: 63.7%
Here:
64%
State:
51%
(% for various income ranges: 55.6% for AGIs below $25k, 63.9% for AGIs $25k-50k, 68.2% for AGIs $50k-75k, 66.7% for AGIs $75k-100k, 76.9% for AGIs $100k-200k, 83.3% for AGIs over 200k)
Averages for the 2004 tax year for zip code 45786, filed in 2005:
Average Adjusted Gross Income (AGI) in 2004: $33,382 (Individual Income Tax Returns)
Here:
$33,382
State:
$44,480
Salary/wage: $32,183 (reported on 84.8% of returns)
Here:
$32,183
State:
$39,198
(% of AGI for various income ranges: 118.2% for AGIs below $10k, 72.4% for AGIs $10k-25k, 81.2% for AGIs $25k-50k, 87.3% for AGIs $50k-75k, 85.1% for AGIs $75k-100k, 66.5% for AGIs over 100k)
Taxable interest for individuals: $957 (reported on 50.6% of returns)
This zip code:
$957
Ohio:
$1,532
(% of AGI for various income ranges: 13.0% for AGIs below $10k, 3.0% for AGIs $10k-25k, 1.4% for AGIs $25k-50k, 0.4% for AGIs $50k-75k, 0.6% for AGIs $75k-100k, 1.1% for AGIs over 100k)
Taxable dividends: $856 (reported on 20.6% of returns)
Here:
$856
State:
$3,496
(% of AGI for various income ranges: 2.2% for AGIs below $10k, 1.3% for AGIs $10k-25k, 0.4% for AGIs $25k-50k, 0.5% for AGIs $50k-75k, 0.2% for AGIs $75k-100k, 0.2% for AGIs over 100k)
Net capital gain/loss: +$2,402 (reported on 15.1% of returns)
Here:
+$2,402
State:
+$8,582
(% of AGI for various income ranges: 0.4% for AGIs below $10k, 1.0% for AGIs $10k-25k, 0.4% for AGIs $25k-50k, 0.5% for AGIs $50k-75k, 4.3% for AGIs $75k-100k)
Profit/loss from business: +$4,963 (reported on 15.6% of returns)
Here:
+$4,963
State:
+$10,813
(% of AGI for various income ranges: 7.7% for AGIs below $10k, 4.8% for AGIs $10k-25k, 2.9% for AGIs $25k-50k, 1.1% for AGIs $50k-75k, 1.6% for AGIs $75k-100k)
IRA payment deduction: $2,622 (reported on 2.7% of returns)
45786:
$2,622
Ohio:
$2,794
Total itemized deductions: $13,143 (21% of AGI, reported on 16.1% of returns)
Here:
$13,143
State:
$17,503
Here:
21.0% of AGI
State:
20.8% of AGI
(% of AGI for various income ranges: 3.8% for AGIs $10k-25k, 5.0% for AGIs $25k-50k, 6.6% for AGIs $50k-75k, 9.6% for AGIs $75k-100k, 10.4% for AGIs over 100k)
Charity contributions deductions: $1,773 (3% of AGI, reported on 11.1% of returns)
Here:
$1,773
State:
$3,087
Here:
2.7% of AGI
State:
3.4% of AGI
(% of AGI for various income ranges: 0.2% for AGIs $10k-25k, 0.6% for AGIs $25k-50k, 0.6% for AGIs $50k-75k, 0.9% for AGIs $75k-100k, 0.7% for AGIs over 100k)
Total tax: $3,554 (reported on 73.3% of returns)
45786:
$3,554
State:
$6,781
(% of AGI for various income ranges: 3.4% for AGIs below $10k, 3.8% for AGIs $10k-25k, 6.2% for AGIs $25k-50k, 8.1% for AGIs $50k-75k, 10.3% for AGIs $75k-100k, 15.8% for AGIs over 100k)
Earned income credit: $1,680 (reported on 13.1% of returns)
Here:
$1,680
State:
$1,696
Percentage of individuals using paid preparers for their 2004 taxes: 60.4%
Here:
60%
State:
55%
(% for various income ranges: 52.7% for AGIs below $10k, 62.3% for AGIs $10k-25k, 61.6% for AGIs $25k-50k, 61.0% for AGIs $50k-75k, 68.6% for AGIs $75k-100k, 65.5% for AGIs over 100k)
Household received Food Stamps/SNAP in the past 12 months: 30 Household did not receive Food Stamps/SNAP in the past 12 months: 1,159
Women who had a birth in the past 12 months: 8 (9 now married, 0 unmarried) Women who did not have a birth in the past 12 months: 533 (294 now married, 238 unmarried)
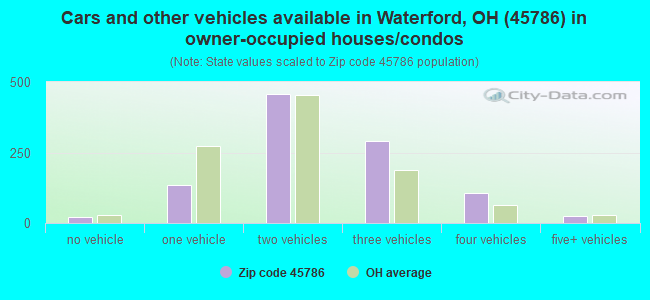
Housing units in zip code 45786 with a mortgage: 428 (25 second mortgage, 14 both second mortgage and home equity loan) Houses without a mortgage: 64
Median monthly owner costs for units with a mortgage: $1,375 Median monthly owner costs for units without a mortgage: $495
Residents with income below the poverty level in 2022:
This zip code:
7.2%
Whole state:
13.4%
Residents with income below 50% of the poverty level in 2022:
This zip code:
1.6%
Whole state:
7.0%
Median number of rooms in houses and condos:
Here:
6.6
State:
6.7
Median number of rooms in apartments:
Here:
4.6
State:
4.4
Notable locations in this zip code not listed on our city pages
Churches in zip code 45786 include: Center Memorial Church (A), Evangelical Church (B), Palmer United Methodist Church (C), Pleasant Grove Church (D). Display/hide their locations on the map
Cemeteries: Beckett Cemetery (1), Center Memorial Church Cemetery (2), Churchtown Cemetery (3), Evangelical Cemetery (4), Layman Cemetery (5), Pleasant Grove Cemetery (6), Salem Church Cemetery (7). Display/hide their locations on the map
Reservoirs: Wagner Pond (A), Middle Reservoir Fly Ash Impoundment (B), Lower Reservoir Bottom Ash Impoundment (C), Units 1-4 Bottom Ash Pond (D), Muskingum River Fly Ash Reservoir (E), Strahler Pond (F), Wagner Pond (G), Muskingum River Lock and Dam Number (H). Display/hide their locations on the map
Streams, rivers, and creeks: Hayward Run (A), Flint Run (B), Duck Creek (C), Culver Run (D), Congress Run (E), Wolf Creek (F), Boseman Run (G), Plumb Run (H), Painter Run (I). Display/hide their locations on the map
Size of family households: 423 2-persons, 177 3-persons, 169 4-persons, 41 5-persons, 9 6-persons, 12 7-or-more-persons
Size of nonfamily households: 330 1-person, 25 2-persons
344 married couples with children.
144 single-parent households (62 men, 82 women).
98.1% of residents of 45786 zip code speak English at home.
1.6% of residents speak Spanish at home (100% very well).
0.3% of residents speak other Indo-European language at home (100% very well).
Foreign born population: 0 (0.0%)
:
0.0%
Whole state:
5.0%
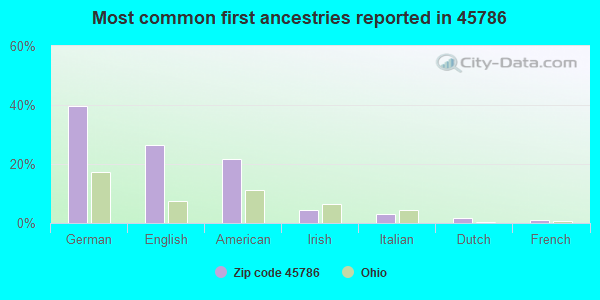
40%German
26%English
22%American
4%Irish
3%Italian
2%Dutch
1%French
Facilities with environmental interests located in this zip code:
AMERICAN ELECTRIC POWER MUSKINGUM RIVER PLANT (ROUTE # 2, BOX 310 in WATERFORD, OH)
OIL CONTROL (Facility Response Plan for oil discharge) Business SIC classification: ELECTRIC SERVICES Organizations: AEP OHIO POWER COMPANY (CONTACT/GENERAL)
Housing units lacking complete plumbing facilities: 0.8% Housing units lacking complete kitchen facilities: 0.8%
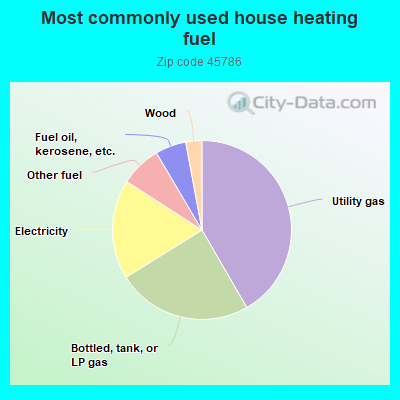
41.7%Utility gas
24.5%Bottled, tank, or LP gas
18.0%Electricity
7.4%Other fuel
5.6%Fuel oil, kerosene, etc.
2.9%Wood
Population in 1990: 3,932.
Place of birth for U.S.-born residents:
This state: 2,350
Northeast: 38
Midwest: 137
South: 277
West: 36
71% of the 45786 zip code residents lived in the same house 5 years ago. Out of people who lived in different houses, 73% lived in this county. Out of people who lived in different counties, 50% lived in Ohio.
97% of the 45786 zip code residents lived in the same house 1 year ago. Out of people who lived in different houses, 74% moved from this county. Out of people who lived in different houses, 25% moved from different county within same state. Out of people who lived in different houses, 13% moved from different state.
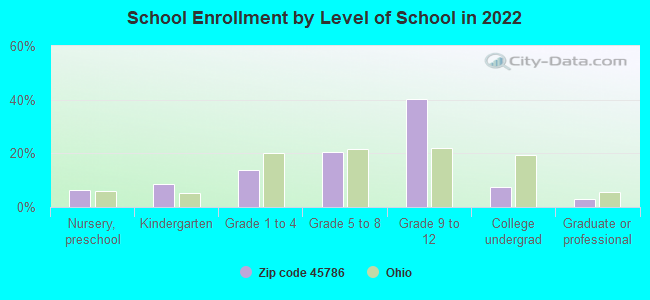
Private vs. public school enrollment:
Students in private schools in grades 1 to 8 (elementary and middle school): 24
Here:
12.4%
Ohio:
16.0%
Students in private schools in grades 9 to 12 (high school): 9
Here:
4.0%
Ohio:
13.1%
Students in private undergraduate colleges:
Here:
0.0%
Ohio:
22.3%
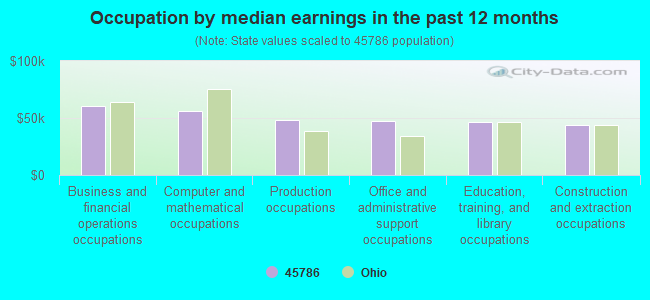
Occupation by median earnings in the past 12 months ($)
60,470Business and financial operations occupations
56,567Computer and mathematical occupations
48,174Production occupations
47,364Office and administrative support occupations
46,316Education, training, and library occupations
43,589Construction and extraction occupations
Companies with federal contracts located in this zip code:
MISTYRIDGE ORIGINALS (RT 2 BOX 190 A-1 in WATERFORD, OH; small business) : $187,933 in 12 contractsfrom 2001 to 2004
Contracts for Custodial Janitorial Services, Landscaping/Groundskeeping Services by U.S. Army Corps of Engineers - civil program financing only, Army Signed by year:2000: $0; 2001: $9,787; 2002: $45,305; 2003: $44,191; 2004: $88,650; 2005: $0; 2006: $0.
Biggest contracts:
$45,142 with U.S. Army Corps of Engineers - civil program financing only for Custodial Janitorial Services. Signed on 2002-02-27. Completion date: 2001-10-29.
$44,325, same as above.Signed on 2004-03-17. Completion date: 2001-10-29.
$44,325 with Army for Custodial Janitorial Services. Signed on 2004-03-17. Completion date: 2001-10-29.
$44,191 with U.S. Army Corps of Engineers - civil program financing only for Custodial Janitorial Services. Signed on 2003-02-27. Completion date: 2001-10-29.
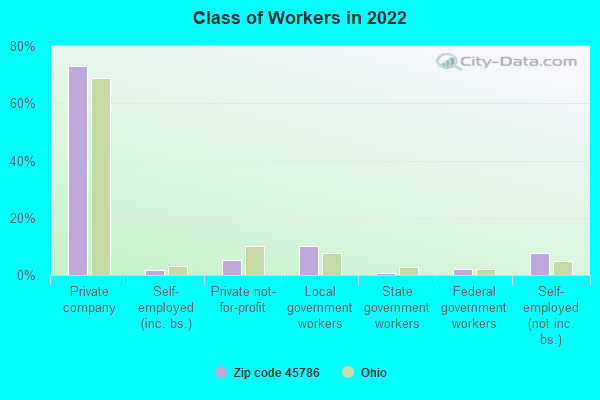
Top industries in this zip code by the number of employees in 2005:
Finance and Insurance: Commercial Banking (20-49: 1)
Other Services (except Public Administration): Commercial and Industrial Machinery and Equipment (except Automotive and Electronic) Repair and Maintenance (10-19: 2)
Construction: Commercial and Institutional Building Construction (10-19: 1, 5-9: 1, 1-4: 3)
Construction: New Single-Family Housing Construction (except Operative Builders) (5-9: 2, 1-4: 2)
Construction: Site Preparation Contractors (10-19: 1, 1-4: 1)
Construction: Painting and Wall Covering Contractors (10-19: 1)
Fatal accident statistics in 2014:
Fatal accident count: 1
Vehicles involved in fatal accidents: 1
Fatal accidents caused by drunken drivers: 0
Fatalities: 1
Persons involved in fatal accidents: 2
Pedestrians involved in fatal accidents: 1
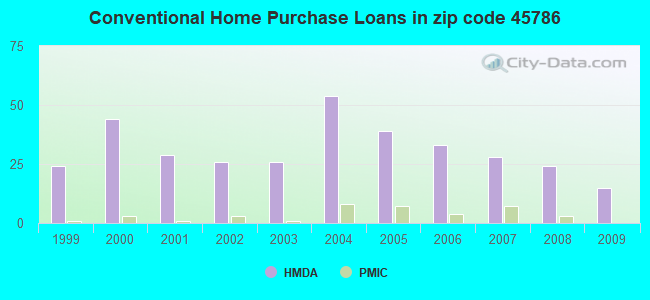
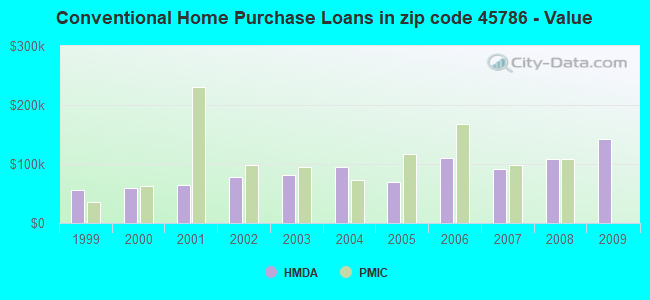
Home Mortgage Disclosure Act Aggregated Statistics For Year 2009 (Based on 2 partial tracts)
A) FHA, FSA/RHS & VA Home Purchase Loans
B) Conventional Home Purchase Loans
C) Refinancings
D) Home Improvement Loans
F) Non-occupant Loans on < 5 Family Dwellings (A B C & D)
G) Loans On Manufactured Home Dwelling (A B C & D)
Number
Average Value
Number
Average Value
Number
Average Value
Number
Average Value
Number
Average Value
Number
Average Value
LOANS ORIGINATED
6
$86,768
15
$142,614
72
$107,557
6
$42,000
3
$61,383
7
$63,494
APPLICATIONS APPROVED, NOT ACCEPTED
1
$221,540
0
$0
0
$0
0
$0
0
$0
0
$0
APPLICATIONS DENIED
0
$0
6
$56,768
22
$96,104
4
$185,190
0
$0
6
$32,307
APPLICATIONS WITHDRAWN
1
$196,610
4
$116,308
22
$144,565
0
$0
0
$0
4
$101,768
FILES CLOSED FOR INCOMPLETENESS
0
$0
0
$0
4
$152,305
0
$0
0
$0
0
$0
Aggregated Statistics For Year 2008 (Based on 2 partial tracts)
A) FHA, FSA/RHS & VA Home Purchase Loans
B) Conventional Home Purchase Loans
C) Refinancings
D) Home Improvement Loans
F) Non-occupant Loans on < 5 Family Dwellings (A B C & D)
G) Loans On Manufactured Home Dwelling (A B C & D)
Number
Average Value
Number
Average Value
Number
Average Value
Number
Average Value
Number
Average Value
Number
Average Value
LOANS ORIGINATED
10
$78,784
24
$108,864
28
$103,400
7
$49,054
4
$41,885
11
$63,944
APPLICATIONS APPROVED, NOT ACCEPTED
0
$0
1
$617,530
0
$0
0
$0
0
$0
0
$0
APPLICATIONS DENIED
1
$95,540
7
$63,890
32
$114,662
6
$77,538
0
$0
11
$61,804
APPLICATIONS WITHDRAWN
0
$0
3
$107,537
11
$121,341
0
$0
0
$0
1
$131,540
FILES CLOSED FOR INCOMPLETENESS
0
$0
0
$0
3
$96,000
1
$65,080
0
$0
0
$0
Aggregated Statistics For Year 2007 (Based on 2 partial tracts)
A) FHA, FSA/RHS & VA Home Purchase Loans
B) Conventional Home Purchase Loans
C) Refinancings
D) Home Improvement Loans
F) Non-occupant Loans on < 5 Family Dwellings (A B C & D)
G) Loans On Manufactured Home Dwelling (A B C & D)
Number
Average Value
Number
Average Value
Number
Average Value
Number
Average Value
Number
Average Value
Number
Average Value
LOANS ORIGINATED
6
$102,460
28
$91,334
47
$95,508
8
$36,519
4
$115,268
7
$41,736
APPLICATIONS APPROVED, NOT ACCEPTED
0
$0
1
$180,000
8
$88,441
4
$62,652
0
$0
0
$0
APPLICATIONS DENIED
6
$101,075
7
$89,207
35
$96,249
14
$30,560
0
$0
7
$88,417
APPLICATIONS WITHDRAWN
1
$186,920
3
$52,613
12
$79,845
0
$0
1
$138,460
3
$36,000
FILES CLOSED FOR INCOMPLETENESS
0
$0
0
$0
4
$93,115
0
$0
1
$94,150
0
$0
Aggregated Statistics For Year 2006 (Based on 2 partial tracts)
A) FHA, FSA/RHS & VA Home Purchase Loans
B) Conventional Home Purchase Loans
C) Refinancings
D) Home Improvement Loans
F) Non-occupant Loans on < 5 Family Dwellings (A B C & D)
G) Loans On Manufactured Home Dwelling (A B C & D)
Number
Average Value
Number
Average Value
Number
Average Value
Number
Average Value
Number
Average Value
Number
Average Value
LOANS ORIGINATED
1
$127,380
33
$109,719
33
$115,887
11
$31,216
6
$50,077
14
$50,439
APPLICATIONS APPROVED, NOT ACCEPTED
3
$107,537
10
$63,692
3
$154,153
0
$0
1
$56,770
1
$142,610
APPLICATIONS DENIED
1
$142,610
17
$70,941
48
$133,181
10
$67,984
1
$138,460
11
$57,020
APPLICATIONS WITHDRAWN
0
$0
6
$113,768
28
$110,719
8
$59,711
1
$98,310
6
$60,692
FILES CLOSED FOR INCOMPLETENESS
0
$0
1
$31,850
8
$133,441
0
$0
0
$0
1
$31,850
Aggregated Statistics For Year 2005 (Based on 2 partial tracts)
A) FHA, FSA/RHS & VA Home Purchase Loans
B) Conventional Home Purchase Loans
C) Refinancings
D) Home Improvement Loans
F) Non-occupant Loans on < 5 Family Dwellings (A B C & D)
G) Loans On Manufactured Home Dwelling (A B C & D)
Number
Average Value
Number
Average Value
Number
Average Value
Number
Average Value
Number
Average Value
Number
Average Value
LOANS ORIGINATED
4
$117,345
39
$70,224
57
$90,704
19
$45,765
8
$69,402
12
$37,269
APPLICATIONS APPROVED, NOT ACCEPTED
1
$121,840
10
$78,091
6
$111,460
0
$0
0
$0
7
$67,450
APPLICATIONS DENIED
0
$0
12
$79,038
40
$96,853
6
$52,383
1
$18,000
12
$73,153
APPLICATIONS WITHDRAWN
0
$0
1
$88,610
25
$120,571
3
$21,693
0
$0
3
$89,077
FILES CLOSED FOR INCOMPLETENESS
3
$69,690
0
$0
6
$115,383
0
$0
0
$0
0
$0
Aggregated Statistics For Year 2004 (Based on 2 partial tracts)
A) FHA, FSA/RHS & VA Home Purchase Loans
B) Conventional Home Purchase Loans
C) Refinancings
D) Home Improvement Loans
F) Non-occupant Loans on < 5 Family Dwellings (A B C & D)
G) Loans On Manufactured Home Dwelling (A B C & D)
Number
Average Value
Number
Average Value
Number
Average Value
Number
Average Value
Number
Average Value
Number
Average Value
LOANS ORIGINATED
0
$0
54
$94,179
83
$67,011
11
$97,677
19
$75,352
22
$50,223
APPLICATIONS APPROVED, NOT ACCEPTED
1
$70,610
7
$111,361
14
$59,636
0
$0
0
$0
4
$46,038
APPLICATIONS DENIED
0
$0
19
$61,359
40
$70,476
7
$16,021
4
$38,078
14
$50,439
APPLICATIONS WITHDRAWN
1
$145,380
7
$63,890
24
$73,211
4
$82,382
1
$63,690
10
$63,138
FILES CLOSED FOR INCOMPLETENESS
0
$0
1
$117,690
7
$73,186
1
$138,460
1
$106,610
1
$38,770
Aggregated Statistics For Year 2003 (Based on 2 partial tracts)
A) FHA, FSA/RHS & VA Home Purchase Loans
B) Conventional Home Purchase Loans
C) Refinancings
D) Home Improvement Loans
F) Non-occupant Loans on < 5 Family Dwellings (A B C & D)
Number
Average Value
Number
Average Value
Number
Average Value
Number
Average Value
Number
Average Value
LOANS ORIGINATED
1
$110,770
26
$81,212
165
$81,062
11
$20,643
10
$64,522
APPLICATIONS APPROVED, NOT ACCEPTED
1
$105,230
1
$99,690
14
$92,867
0
$0
0
$0
APPLICATIONS DENIED
0
$0
10
$43,892
51
$71,103
6
$12,000
0
$0
APPLICATIONS WITHDRAWN
0
$0
7
$58,351
33
$89,118
1
$38,770
1
$90,000
FILES CLOSED FOR INCOMPLETENESS
0
$0
0
$0
4
$106,268
0
$0
0
$0
Aggregated Statistics For Year 2002 (Based on 2 partial tracts)
A) FHA, FSA/RHS & VA Home Purchase Loans
B) Conventional Home Purchase Loans
C) Refinancings
D) Home Improvement Loans
F) Non-occupant Loans on < 5 Family Dwellings (A B C & D)
Number
Average Value
Number
Average Value
Number
Average Value
Number
Average Value
Number
Average Value
LOANS ORIGINATED
4
$60,578
26
$78,603
145
$73,556
12
$13,384
4
$63,692
APPLICATIONS APPROVED, NOT ACCEPTED
0
$0
7
$76,746
15
$48,092
4
$14,885
0
$0
APPLICATIONS DENIED
0
$0
11
$41,664
25
$52,282
11
$11,076
0
$0
APPLICATIONS WITHDRAWN
0
$0
3
$34,153
21
$54,659
0
$0
1
$48,460
FILES CLOSED FOR INCOMPLETENESS
0
$0
1
$124,610
4
$43,960
0
$0
0
$0
Aggregated Statistics For Year 2001 (Based on 2 partial tracts)
A) FHA, FSA/RHS & VA Home Purchase Loans
B) Conventional Home Purchase Loans
C) Refinancings
D) Home Improvement Loans
F) Non-occupant Loans on < 5 Family Dwellings (A B C & D)
Number
Average Value
Number
Average Value
Number
Average Value
Number
Average Value
Number
Average Value
LOANS ORIGINATED
1
$90,000
29
$64,742
148
$60,679
11
$30,209
3
$16,617
APPLICATIONS APPROVED, NOT ACCEPTED
3
$67,383
4
$39,808
10
$64,107
3
$18,000
1
$207,690
APPLICATIONS DENIED
1
$87,230
8
$37,384
37
$53,475
3
$33,693
0
$0
APPLICATIONS WITHDRAWN
0
$0
1
$94,150
43
$67,942
3
$11,540
0
$0
FILES CLOSED FOR INCOMPLETENESS
0
$0
3
$60,460
6
$62,077
0
$0
0
$0
Aggregated Statistics For Year 2000 (Based on 2 partial tracts)
A) FHA, FSA/RHS & VA Home Purchase Loans
B) Conventional Home Purchase Loans
C) Refinancings
D) Home Improvement Loans
F) Non-occupant Loans on < 5 Family Dwellings (A B C & D)
Number
Average Value
Number
Average Value
Number
Average Value
Number
Average Value
Number
Average Value
LOANS ORIGINATED
3
$68,307
44
$60,104
75
$43,643
22
$17,307
11
$32,097
APPLICATIONS APPROVED, NOT ACCEPTED
1
$96,920
14
$38,571
7
$54,593
0
$0
0
$0
APPLICATIONS DENIED
3
$49,383
24
$38,422
36
$49,115
4
$22,845
0
$0
APPLICATIONS WITHDRAWN
1
$45,690
8
$48,808
10
$37,938
0
$0
0
$0
FILES CLOSED FOR INCOMPLETENESS
0
$0
0
$0
1
$34,620
0
$0
0
$0
Aggregated Statistics For Year 1999 (Based on 1 partial tract)
A) FHA, FSA/RHS & VA Home Purchase Loans
B) Conventional Home Purchase Loans
C) Refinancings
D) Home Improvement Loans
F) Non-occupant Loans on < 5 Family Dwellings (A B C & D)
Detailed PMIC statistics for the following Tracts:0216.00
2002 - 2018 National Fire Incident Reporting System (NFIRS) incidents
According to the data from the years 2002 - 2018 the average number of fires per year is 12. The highest number of reported fire incidents - 19 took place in 2014, and the least - 6 in 2002. The data has a rising trend.
When looking into fire subcategories, the most incidents belonged to: Structure Fires (49.8%), and Outside Fires (29.6%).
Fire incident types reported to NFIRS in Zip Code 45786


 Nearest zip codes: 45787, 45721, 45729, 45715, 45784, 43787.
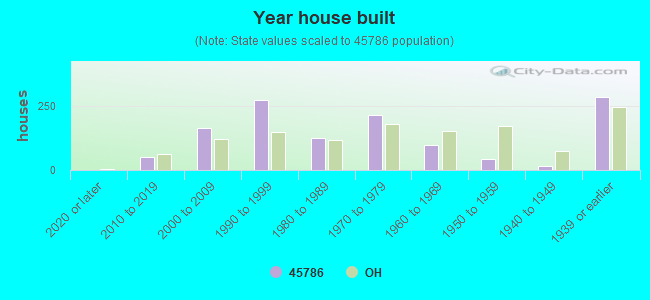


 According to the data from the years 2002 - 2018 the average number of fires per year is 12. The highest number of reported fire incidents - 19 took place in 2014, and the least - 6 in 2002. The data has a rising trend.
 When looking into fire subcategories, the most incidents belonged to: Structure Fires (49.8%), and Outside Fires (29.6%).