Estimated zip code population in 2022: 1,049 Zip code population in 2010: 1,179 Zip code population in 2000: 1,145
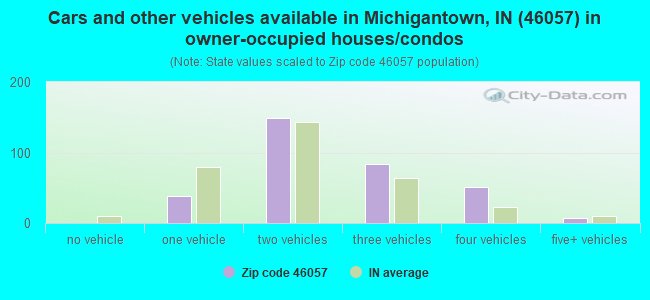
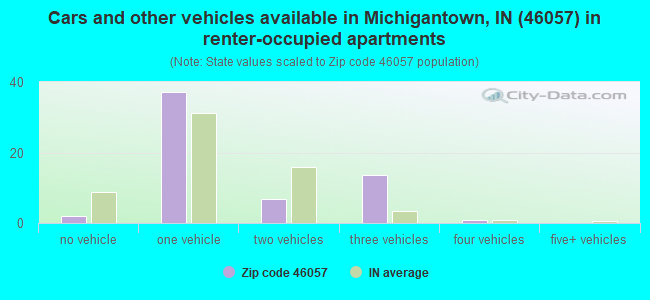
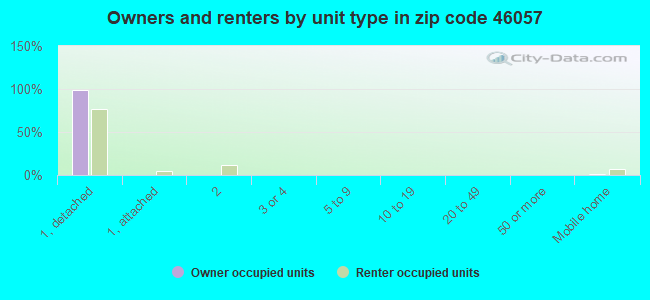
Houses and condos: 397 Renter-occupied apartments: 61
% of renters here:
16%
State:
29%
March 2022 cost of living index in zip code 46057: 85.9 (less than average, U.S. average is 100)
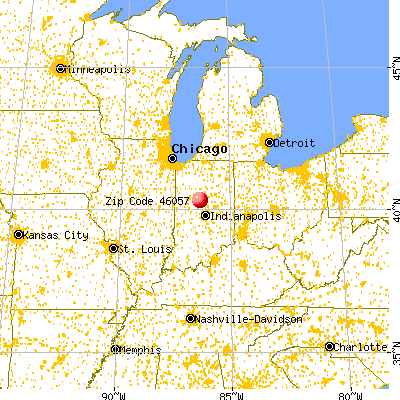
Land area: 24.9 sq. mi. Water area: 0.0 sq. mi.
Population density: 42 people per square mile
(very low).
OSM Map
General Map
Google Map
MSN Map
OSM Map
General Map
Google Map
MSN Map
OSM Map
General Map
Google Map
MSN Map
OSM Map
General Map
Google Map
MSN Map
Please wait while loading the map...
Real estate property taxes paid for housing units in 2022:
This zip code:
0.5% ($1,026)
Indiana:
0.7% ($1,467)
Median real estate property taxes paid for housing units with mortgages in 2022: $931 (0.5%) Median real estate property taxes paid for housing units with no mortgage in 2022: $1,172 (0.5%)
Business Search- 14 Million verified businesses
Males: 642
(61.3%)
Females: 406
(38.7%)
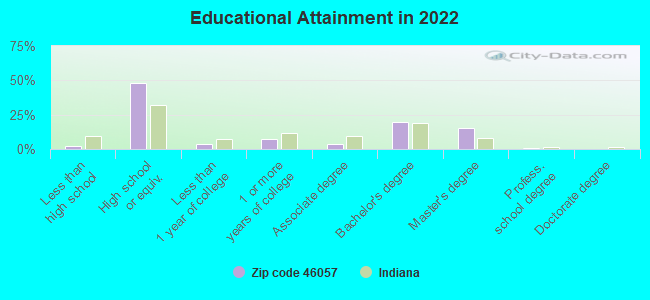
For population 25 years and over in 46057:
High school or higher: 96.8%
Bachelor's degree or higher: 35.2%
Graduate or professional degree: 15.7%
Unemployed: 0.2%
Mean travel time to work (commute): 23.7 minutes
For population 15 years and over in 46057:
Never married: 18.6%
Now married: 55.7%
Separated: 0.0%
Widowed: 17.4%
Divorced: 8.3%
Zip code 46057 compared to state average:
Unemployed percentage significantly below state average.
Black race population percentage significantly below state average.
Hispanic race population percentage above state average.
Foreign-born population percentage significantly below state average.
Renting percentage below state average.
Length of stay since moving in significantly below state average.
Number of college students significantly below state average.
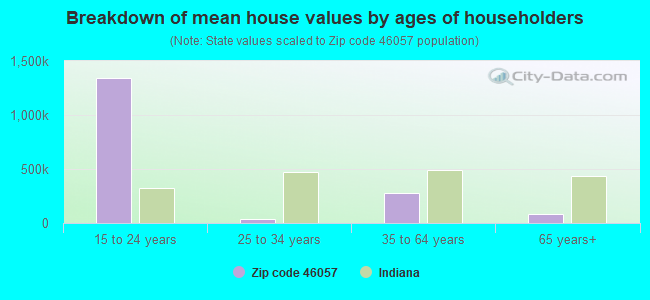
Estimated median house/condo value in 2022: $198,242
46057:
$198,242
Indiana:
$208,700
Median resident age:
This zip code:
37.2 years
Indiana median age:
38.2 years
Average household size:
This zip code:
2.7 people
Indiana:
2.4 people
Averages for the 2020 tax year for zip code 46057, filed in 2021:
Average Adjusted Gross Income (AGI) in 2020: $58,743 (Individual Income Tax Returns)
Here:
$58,743
State:
$64,978
Salary/wage: $50,254 (reported on 80.4% of returns)
Here:
$50,254
State:
$55,245
(% of AGI for various income ranges: 1257.0% for AGIs below $25k, 3446.7% for AGIs $25k-50k, 5436.7% for AGIs $50k-75k, 8908.0% for AGIs $75k-100k, 18737.5% for AGIs $100k-200k)
Taxable interest for individuals: $531 (reported on 25.5% of returns)
This zip code:
$531
Indiana:
$1,351
(% of AGI for various income ranges: 10.0% for AGIs below $25k, 8.3% for AGIs $25k-50k, 23.3% for AGIs $50k-75k, 87.5% for AGIs $100k-200k)
Ordinary dividends: $1,886 (reported on 13.7% of returns)
Here:
$1,886
State:
$5,827
(% of AGI for various income ranges: 27.0% for AGIs below $25k, 70.0% for AGIs $50k-75k, 157.5% for AGIs $100k-200k)
Net capital gain/loss in AGI: +$4,700 (reported on 13.7% of returns)
Here:
+$4,700
State:
+$17,730
(% of AGI for various income ranges: 98.3% for AGIs $25k-50k, 527.5% for AGIs $100k-200k)
Profit/loss from business: +$5,333 (reported on 11.8% of returns)
Here:
+$5,333
State:
+$12,144
(% of AGI for various income ranges: 245.0% for AGIs $25k-50k, 43.3% for AGIs $50k-75k)
Taxable individual retirement arrangement distribution: $15,517 (reported on 11.8% of returns)
46057:
$15,517
Indiana:
$18,302
(% of AGI for various income ranges: 285.0% for AGIs $25k-50k, 1178.0% for AGIs $75k-100k)
Earned income credit: $2,088 (reported on 15.7% of returns)
Here:
$2,088
State:
$2,298
(% of AGI for various income ranges: 71.0% for AGIs below $25k, 80.0% for AGIs $25k-50k)
Percentage of individuals using paid preparers for their 2020 taxes: 94.1%
Here:
94%
State:
94%
(% for various income ranges: 100.0% for AGIs below $25k, 93.3% for AGIs $25k-50k, 100.0% for AGIs $50k-75k, 85.7% for AGIs $75k-100k, 87.5% for AGIs $100k-200k)
Averages for the 2012 tax year for zip code 46057, filed in 2013:
Average Adjusted Gross Income (AGI) in 2012: $47,306 (Individual Income Tax Returns)
Here:
$47,306
State:
$52,932
Salary/wage: $37,589 (reported on 85.2% of returns)
Here:
$37,589
State:
$45,173
(% of AGI for various income ranges: 76.2% for AGIs below $25k, 80.3% for AGIs $25k-50k, 70.7% for AGIs $50k-75k, 77.9% for AGIs $75k-100k, 52.1% for AGIs $100k-200k)
Taxable interest for individuals: $653 (reported on 27.8% of returns)
This zip code:
$653
Indiana:
$1,311
(% of AGI for various income ranges: 1.5% for AGIs below $25k, 0.4% for AGIs $50k-75k, 0.6% for AGIs $75k-100k, 0.1% for AGIs $100k-200k)
Ordinary dividends: $3,271 (reported on 13.0% of returns)
Here:
$3,271
State:
$4,690
Net capital gain/loss in AGI: +$4,180 (reported on 9.3% of returns)
Here:
+$4,180
State:
+$10,406
Profit/loss from business: +$6,433 (reported on 11.1% of returns)
Here:
+$6,433
State:
+$11,105
Taxable individual retirement arrangement distribution: $9,260 (reported on 9.3% of returns)
46057:
$9,260
Indiana:
$13,841
Total itemized deductions: $17,182 (18% of AGI, reported on 20.4% of returns)
Here:
$17,182
State:
$20,913
Here:
18.0% of AGI
State:
18.2% of AGI
(% of AGI for various income ranges: 17.8% for AGIs below $25k, 6.9% for AGIs $50k-75k, 6.0% for AGIs $75k-100k, 9.4% for AGIs $100k-200k)
Charity contributions: $3,275 (reported on 14.8% of returns)
Here:
$3,275
State:
$4,697
Taxes paid: $6,418 (reported on 20.4% of returns)
46057:
$6,418
State:
$7,456
(% of AGI for various income ranges: 2.3% for AGIs below $25k, 2.2% for AGIs $50k-75k, 2.4% for AGIs $75k-100k, 4.7% for AGIs $100k-200k)
Earned income credit: $2,389 (reported on 16.7% of returns)
Here:
$2,389
State:
$2,265
(% of AGI for various income ranges: 6.6% for AGIs below $25k, 1.6% for AGIs $25k-50k)
Percentage of individuals using paid preparers for their 2012 taxes: 53.7%
Here:
54%
State:
53%
(% for various income ranges: 47.6% for AGIs below $25k, 58.3% for AGIs $25k-50k, 55.6% for AGIs $50k-75k, 50.0% for AGIs $75k-100k, 66.7% for AGIs $100k-200k)
Averages for the 2004 tax year for zip code 46057, filed in 2005:
Average Adjusted Gross Income (AGI) in 2004: $42,754 (Individual Income Tax Returns)
Here:
$42,754
State:
$44,790
Salary/wage: $35,772 (reported on 87.9% of returns)
Here:
$35,772
State:
$39,615
(% of AGI for various income ranges: 79.3% for AGIs below $10k, 69.6% for AGIs $10k-25k, 80.3% for AGIs $25k-50k, 80.0% for AGIs $50k-75k, 79.2% for AGIs $75k-100k, 55.6% for AGIs over 100k)
Taxable interest for individuals: $1,407 (reported on 40.5% of returns)
This zip code:
$1,407
Indiana:
$1,535
(% of AGI for various income ranges: 3.5% for AGIs below $10k, 4.5% for AGIs $10k-25k, 1.7% for AGIs $25k-50k, 0.6% for AGIs $50k-75k, 0.9% for AGIs $75k-100k, 0.9% for AGIs over 100k)
Taxable dividends: $965 (reported on 22.6% of returns)
Here:
$965
State:
$2,998
(% of AGI for various income ranges: 0.6% for AGIs below $10k, 0.2% for AGIs $10k-25k, 0.5% for AGIs $25k-50k, 0.6% for AGIs $50k-75k, 0.5% for AGIs $75k-100k, 0.5% for AGIs over 100k)
Net capital gain/loss: +$342 (reported on 14.5% of returns)
Here:
+$342
State:
+$8,619
(% of AGI for various income ranges: -0.8% for AGIs below $10k, -0.3% for AGIs $25k-50k, -0.2% for AGIs $50k-75k, 0.2% for AGIs $75k-100k, 0.9% for AGIs over 100k)
Profit/loss from business: +$1,850 (reported on 11.9% of returns)
Here:
+$1,850
State:
+$10,071
(% of AGI for various income ranges: 11.8% for AGIs below $10k, 1.2% for AGIs $25k-50k, 0.0% for AGIs $50k-75k, -0.1% for AGIs $75k-100k)
Profit/loss from farming: +$1,655 (reported on 5.8% of returns)
Here:
+$1,655
State:
-$2,212
Total itemized deductions: $14,411 (19% of AGI, reported on 24.6% of returns)
Here:
$14,411
State:
$17,065
Here:
19.4% of AGI
State:
19.5% of AGI
(% of AGI for various income ranges: 8.3% for AGIs $10k-25k, 6.1% for AGIs $25k-50k, 8.3% for AGIs $50k-75k, 11.1% for AGIs $75k-100k, 8.7% for AGIs over 100k)
Charity contributions deductions: $2,819 (4% of AGI, reported on 18.7% of returns)
Here:
$2,819
State:
$3,550
Here:
3.7% of AGI
State:
3.8% of AGI
(% of AGI for various income ranges: 0.8% for AGIs $25k-50k, 1.3% for AGIs $50k-75k, 1.0% for AGIs $75k-100k, 2.3% for AGIs over 100k)
Total tax: $5,789 (reported on 77.0% of returns)
46057:
$5,789
State:
$6,914
(% of AGI for various income ranges: 2.0% for AGIs below $10k, 4.6% for AGIs $10k-25k, 6.0% for AGIs $25k-50k, 8.5% for AGIs $50k-75k, 10.6% for AGIs $75k-100k, 19.4% for AGIs over 100k)
Earned income credit: $1,582 (reported on 13.3% of returns)
Here:
$1,582
State:
$1,685
Percentage of individuals using paid preparers for their 2004 taxes: 63.9%
Here:
64%
State:
59%
(% for various income ranges: 52.0% for AGIs below $10k, 70.4% for AGIs $10k-25k, 61.8% for AGIs $25k-50k, 67.0% for AGIs $50k-75k, 67.3% for AGIs $75k-100k, 75.8% for AGIs over 100k)
Household received Food Stamps/SNAP in the past 12 months: 11 Household did not receive Food Stamps/SNAP in the past 12 months: 380
Women who had a birth in the past 12 months: 20 (19 now married, 1 unmarried) Women who did not have a birth in the past 12 months: 175 (121 now married, 54 unmarried)
Housing units in zip code 46057 with a mortgage: 190 (15 second mortgage, 16 both second mortgage and home equity loan) Houses without a mortgage: 29
Median monthly owner costs for units with a mortgage: $1,056 Median monthly owner costs for units without a mortgage: $396
Residents with income below the poverty level in 2022:
This zip code:
10.2%
Whole state:
12.6%
Residents with income below 50% of the poverty level in 2022:
This zip code:
2.9%
Whole state:
6.3%
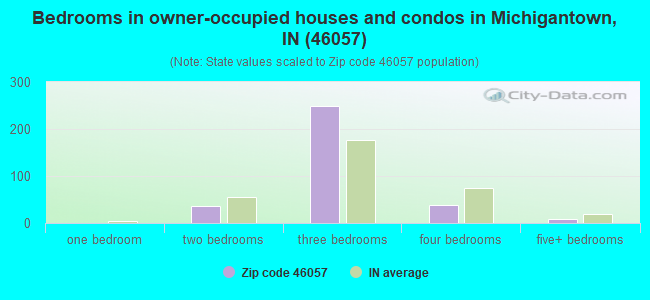
Median number of rooms in houses and condos:
Here:
7.0
State:
6.6
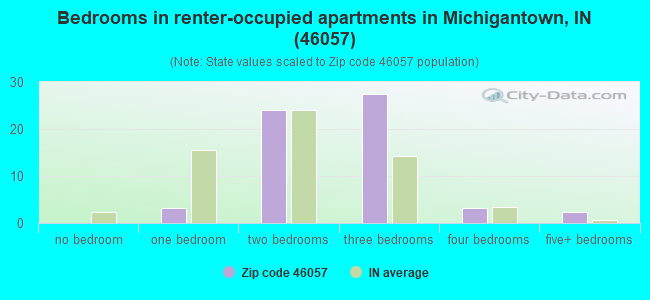
Median number of rooms in apartments:
Here:
5.6
State:
4.3
Notable locations in this zip code not listed on our city pages
Cemeteries: Whiteman Cemetery (1), Plummer Cemetery (2), Veneman Cemetery (3), Layman Cemetery (4), Paris Cemetery (5), Old Whiteman Cemetery (6), Old Liberty Cemetery (7). Display/hide their locations on the map
Size of family households: 95 2-persons, 58 3-persons, 38 4-persons, 21 5-persons, 1 6-persons
Size of nonfamily households: 157 1-person, 16 2-persons, 3 5-persons
260 married couples with children.
34 single-parent households (34 women).
87.8% of residents of 46057 zip code speak English at home.
11.6% of residents speak Spanish at home (96% very well, 4% not well).
0.2% of residents speak Asian or Pacific Island language at home (100% very well).
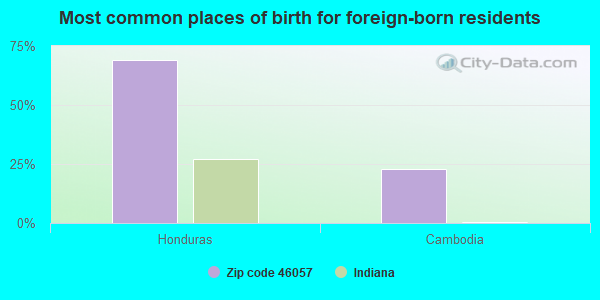
Foreign born population: 13 (1.2%) (25.9% of them are naturalized citizens)
This zip code:
1.2%
Whole state:
6.1%
69%Honduras
23%Cambodia
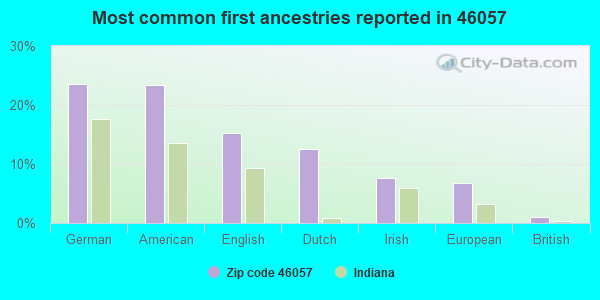
24%German
23%American
15%English
13%Dutch
8%Irish
7%European
1%British
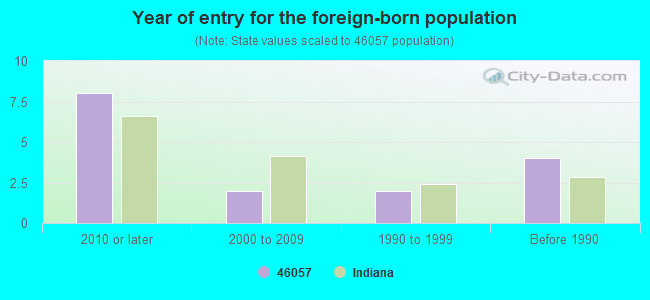
Year of entry for the foreign-born population
82010 or later
22000 to 2009
21990 to 1999
4Before 1990
Facilities with environmental interests located in this zip code:
MICHIGANTOWN MUNICIPAL WWTP (MAIN ST & 7TH in MICHIGANTOWN, IN)
STATE MASTER (Indiana facility tracking) National Pollutant Discharge Elimination System NON-MAJOR (Tracking pollutant discharge elimination systems) - permit (Resource Conservation and Recovery Act (tracking hazardous waste)) Business SIC classification: SEWERAGE SYSTEMS Organizations: JEFF STRONG CERT OPER (CONTACT/OPERATOR)
, CITY OF MICHIGANTOWN (CONTACT/OWNER)
, TOWN COUNCIL PRESIDENT (CONTACT/OWNER)
Alternative names: MICHIGANTOWN MUNICIPAL STP, MICHIGANTOWN SEWAGE
CLINTON CENTRAL ELEM SCHOOL (725 N SR 29 in MICHIGANTOWN, IN)
(National Center for Education Statistics) - STATE ID-0961 Organizations: CLINTON CENTRAL SCHOOL CORP (SCHOOL DISTRICT)
CLINTON CENTRAL JUNIOR-SENIOR HS (815 N SR 29 in MICHIGANTOWN, IN)
(National Center for Education Statistics) - STATE ID-0957 Organizations: CLINTON CENTRAL SCHOOL CORP (SCHOOL DISTRICT)
AT AND T LONG LINES MICHIGANTOWN IND (JCT OF HWY 29 AND CTY RTE 4 in MICHIGANTOWN, IN)
STATE MASTER (Indiana facility tracking) (Resource Conservation and Recovery Act (tracking hazardous waste))
CLINTON CENTRAL SCHOOL CORP (100 N & SR 29 in MICHIGANTOWN, IN)
STATE MASTER (Indiana facility tracking) COMPLIANCE ACTIVITY (Tracking inspections of insecticide, fungicide, and rodenticide, and toxic substances) Alternative names: CLINTON CENTRA SCHOOL CORP
Housing units lacking complete plumbing facilities: 0.8% Housing units lacking complete kitchen facilities: 0.9%
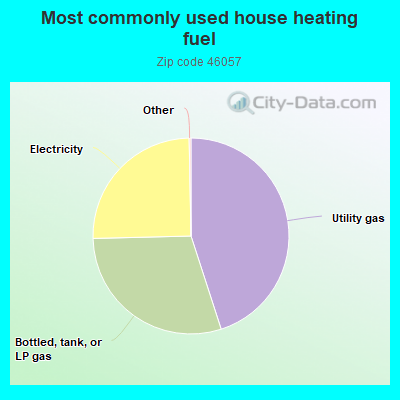
45.2%Utility gas
29.7%Bottled, tank, or LP gas
25.2%Electricity
Population in 1990: 2,207.
Place of birth for U.S.-born residents:
This state: 851
Northeast: 2
Midwest: 70
South: 41
West: 62
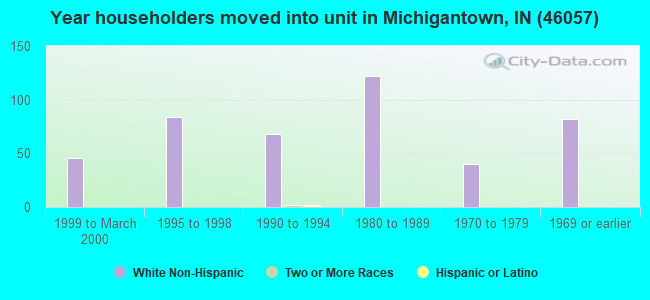
73% of the 46057 zip code residents lived in the same house 5 years ago. Out of people who lived in different houses, 68% lived in this county. Out of people who lived in different counties, 50% lived in Indiana.
96% of the 46057 zip code residents lived in the same house 1 year ago. Out of people who lived in different houses, 50% moved from this county. Out of people who lived in different houses, 54% moved from different county within same state.
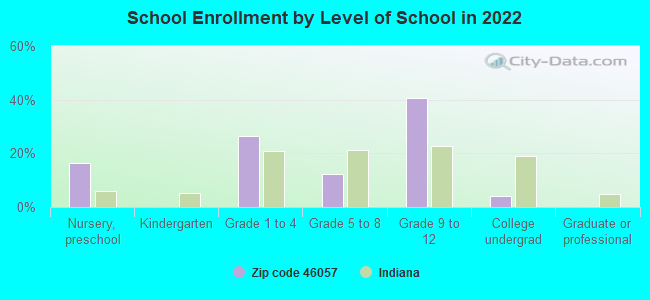
Private vs. public school enrollment:
Students in private schools in grades 1 to 8 (elementary and middle school): 16
Here:
23.7%
Indiana:
14.9%
Students in private schools in grades 9 to 12 (high school):
Here:
0.0%
Indiana:
11.4%
Students in private undergraduate colleges:
Here:
0.0%
Indiana:
22.3%
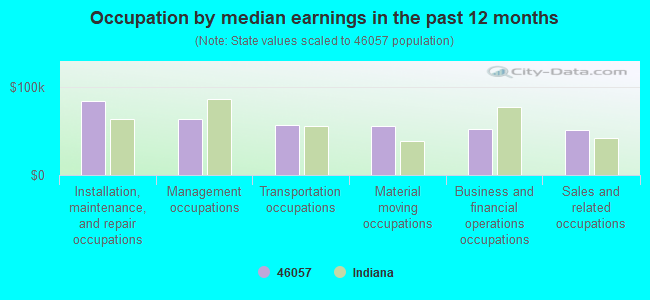
Occupation by median earnings in the past 12 months ($)
83,726Installation, maintenance, and repair occupations
63,653Management occupations
56,750Transportation occupations
55,486Material moving occupations
52,058Business and financial operations occupations
51,689Sales and related occupations
Top industries in this zip code by the number of employees in 2005:
Accommodation and Food Services: Limited-Service Restaurants (10-19 employees: 1 establishment)
Construction: All Other Specialty Trade Contractors (5-9: 1)
Finance and Insurance: Commercial Banking (5-9: 1)
Wholesale Trade: Farm and Garden Machinery and Equipment Merchant Wholesalers (5-9: 1)
Other Services (except Public Administration): Religious Organizations (5-9: 1)
Accommodation and Food Services: Full-Service Restaurants (1-4: 2)
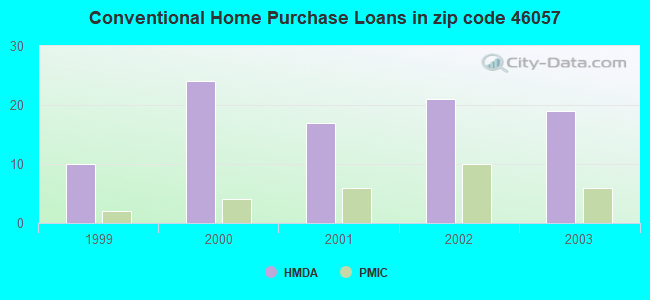
Home Mortgage Disclosure Act Aggregated Statistics For Year 2003 (Based on 2 partial tracts)
A) FHA, FSA/RHS & VA Home Purchase Loans
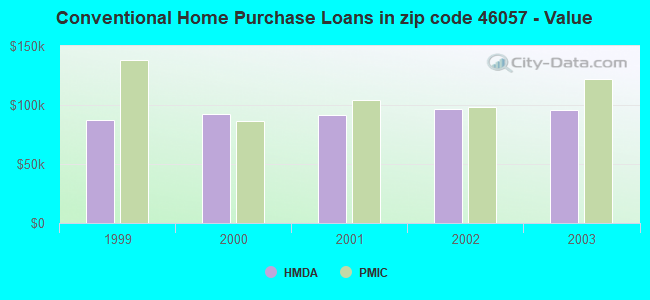
B) Conventional Home Purchase Loans
C) Refinancings
D) Home Improvement Loans
F) Non-occupant Loans on < 5 Family Dwellings (A B C & D)
Number
Average Value
Number
Average Value
Number
Average Value
Number
Average Value
Number
Average Value
LOANS ORIGINATED
3
$95,257
19
$95,720
101
$96,108
6
$26,048
7
$68,796
APPLICATIONS APPROVED, NOT ACCEPTED
0
$0
1
$152,410
11
$99,105
1
$37,750
0
$0
APPLICATIONS DENIED
1
$117,480
5
$102,454
31
$95,358
7
$18,699
2
$53,095
APPLICATIONS WITHDRAWN
0
$0
3
$86,437
18
$101,352
1
$19,400
0
$0
FILES CLOSED FOR INCOMPLETENESS
0
$0
0
$0
3
$120,540
0
$0
0
$0
Aggregated Statistics For Year 2002 (Based on 2 partial tracts)
A) FHA, FSA/RHS & VA Home Purchase Loans
B) Conventional Home Purchase Loans
C) Refinancings
D) Home Improvement Loans
F) Non-occupant Loans on < 5 Family Dwellings (A B C & D)
Number
Average Value
Number
Average Value
Number
Average Value
Number
Average Value
Number
Average Value
LOANS ORIGINATED
4
$89,700
21
$96,550
97
$90,440
6
$22,755
8
$81,056
APPLICATIONS APPROVED, NOT ACCEPTED
0
$0
2
$70,030
10
$76,875
1
$13,760
0
$0
APPLICATIONS DENIED
1
$73,030
5
$56,096
28
$80,098
1
$19,400
1
$31,050
APPLICATIONS WITHDRAWN
0
$0
2
$90,140
10
$74,335
1
$31,050
1
$49,390
FILES CLOSED FOR INCOMPLETENESS
0
$0
0
$0
4
$108,398
0
$0
0
$0
Aggregated Statistics For Year 2001 (Based on 2 partial tracts)
A) FHA, FSA/RHS & VA Home Purchase Loans
B) Conventional Home Purchase Loans
C) Refinancings
D) Home Improvement Loans
F) Non-occupant Loans on < 5 Family Dwellings (A B C & D)
Number
Average Value
Number
Average Value
Number
Average Value
Number
Average Value
Number
Average Value
LOANS ORIGINATED
2
$75,850
17
$91,458
66
$90,851
9
$13,289
4
$62,358
APPLICATIONS APPROVED, NOT ACCEPTED
0
$0
1
$125,950
6
$75,793
2
$14,640
0
$0
APPLICATIONS DENIED
1
$56,800
6
$57,977
26
$76,734
3
$13,877
0
$0
APPLICATIONS WITHDRAWN
0
$0
2
$91,375
11
$78,385
1
$12,350
1
$36,340
FILES CLOSED FOR INCOMPLETENESS
0
$0
1
$54,330
2
$134,770
1
$9,170
0
$0
Aggregated Statistics For Year 2000 (Based on 2 partial tracts)
A) FHA, FSA/RHS & VA Home Purchase Loans
B) Conventional Home Purchase Loans
C) Refinancings
D) Home Improvement Loans
F) Non-occupant Loans on < 5 Family Dwellings (A B C & D)
Number
Average Value
Number
Average Value
Number
Average Value
Number
Average Value
Number
Average Value
LOANS ORIGINATED
2
$92,435
24
$92,184
26
$74,672
14
$42,185
2
$86,965
APPLICATIONS APPROVED, NOT ACCEPTED
0
$0
2
$67,560
4
$64,122
0
$0
0
$0
APPLICATIONS DENIED
1
$49,390
3
$52,683
14
$67,586
4
$24,520
0
$0
APPLICATIONS WITHDRAWN
0
$0
2
$115,720
4
$59,535
0
$0
0
$0
FILES CLOSED FOR INCOMPLETENESS
0
$0
0
$0
0
$0
0
$0
0
$0
Aggregated Statistics For Year 1999 (Based on 1 partial tract)
A) FHA, FSA/RHS & VA Home Purchase Loans
B) Conventional Home Purchase Loans
C) Refinancings
D) Home Improvement Loans
F) Non-occupant Loans on < 5 Family Dwellings (A B C & D)
Detailed PMIC statistics for the following Tracts:9502.00
2002 - 2018 National Fire Incident Reporting System (NFIRS) incidents
Based on the data from the years 2002 - 2018 the average number of fires per year is 7. The highest number of fires - 19 took place in 2005, and the least - 1 in 2013. The data has a rising trend.
When looking into fire subcategories, the most reports belonged to: Structure Fires (46.0%), and Outside Fires (30.6%).
Fire incident types reported to NFIRS in Zip Code 46057


+$1,655
-$2,212
 Nearest zip codes: 46039, 46041, 46050, 46979, 46915, 46049.
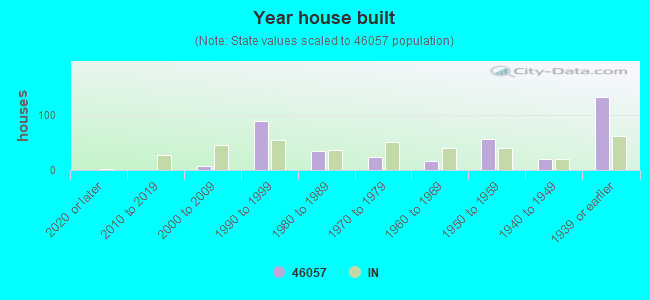


 Based on the data from the years 2002 - 2018 the average number of fires per year is 7. The highest number of fires - 19 took place in 2005, and the least - 1 in 2013. The data has a rising trend.
 When looking into fire subcategories, the most reports belonged to: Structure Fires (46.0%), and Outside Fires (30.6%).